

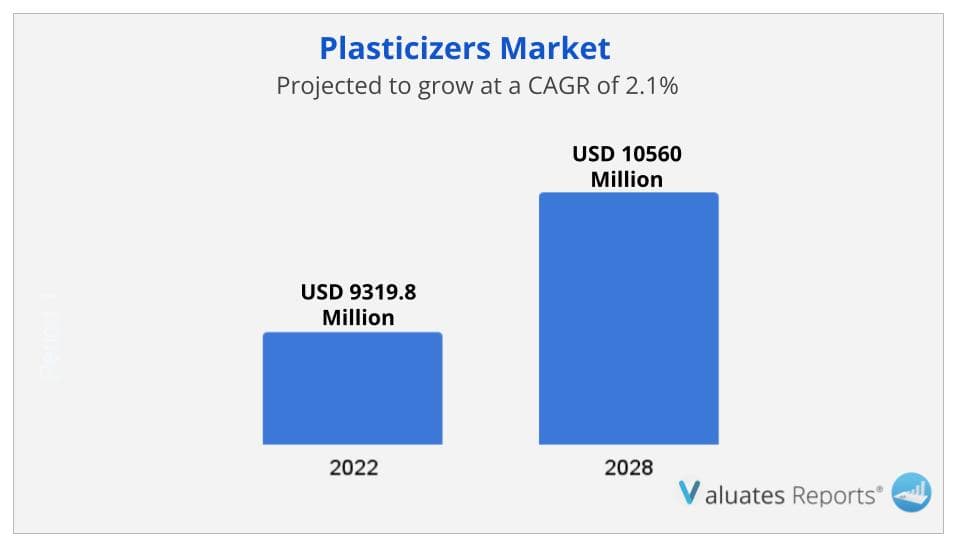
Due to the COVID-19 pandemic, the global Plasticizers market size is estimated to be worth USD 9319.8 Million in 2022 and is forecast to a readjusted size of USD 10560 Million by 2028 with a CAGR of 2.1% during the review period. Fully considering the economic change by this health crisis, Low Phthalates accounting for % of the Plasticizers global market in 2021, is projected to value US$ million by 2028, growing at a revised % CAGR in the post-COVID-19 period. While Flooring & Wall Coverings segment is altered to an % CAGR throughout this forecast period.
China is the largest Plasticizers market with about 45% market share. Europe is follower, accounting for about 26% market share.
The key players are UPC Group, Bluesail, Exxonmobil, Henan Qing'an Chemical Hi-Tech, Nan Ya Plastics, Aekyung Petrochemical, Evonik, Hongxin Chemical, Anqing Sheng Feng Chemical, Basf, Eastman, Lg Chem, Perstorp, Sinopec Jinling, Guangdong Rongtai, Zhejiang Jianye Chemical, Deza etc. Top 3 companies occupied about36% market share.
In terms of production side, this report researches the Plasticizers capacity, production, growth rate, market share by manufacturers and by region (region level and country level), from 2017 to 2022, and forecast to 2028.
In terms of sales side, this report focuses on the sales of Plasticizers by region (region level and country level), by company, by Type and by Application. from 2017 to 2022 and forecast to 2028.
The authors of this research report have explored the key segments: Type and Application. The report offers an in-depth breakdown of type and application segments and their sub-segments. The lucrativeness and growth potential have been looked into by the industry experts in this report. This section of the report also provides sales and revenue forecast data by type and application segments based on sales, price, and revenue for the period 2017-2028. The specialists, to broaden the understanding of the users, have done value chain and raw material analysis in this section.
The authors of this study have enlightened the readers on the rise and effect of the Covid-19 outbreak on the development. They have investigated the changes brought about in the demand/supply side, consumption, supply chain, and production/manufacturing. The readers will get familiar with the measures that have helped the key players to bring the Plasticizers market back to the pre-covid levels.
In this segment of the report, the specialists have delved into the key growth opportunities that are likely to emerge. This will aid the key players to simplify complex issues related to business and frame future strategies to compete in this competitive environment. This section will certainly assist the players to boldly position their business.
1 Study Coverage
1.1 Plasticizers Product Introduction
1.2 Market by Type
1.2.1 Global Plasticizers Market Size by Type, 2017 VS 2021 VS 2028
1.2.2 Low Phthalates
1.2.3 High Phthalates
1.2.4 Non-phthalates
1.3 Market by Application
1.3.1 Global Plasticizers Market Size by Application, 2017 VS 2021 VS 2028
1.3.2 Flooring & Wall Coverings
1.3.3 Film & Sheet
1.3.4 Wire & Cable
1.3.5 Coated Fabric
1.3.6 Consumer Goods
1.3.7 Others
1.4 Study Objectives
1.5 Years Considered
2 Global Plasticizers Production
2.1 Global Plasticizers Production Capacity (2017-2028)
2.2 Global Plasticizers Production by Region: 2017 VS 2021 VS 2028
2.3 Global Plasticizers Production by Region
2.3.1 Global Plasticizers Historic Production by Region (2017-2022)
2.3.2 Global Plasticizers Forecasted Production by Region (2023-2028)
2.4 North America
2.5 Europe
2.6 China
2.7 Japan
3 Global Plasticizers Sales in Volume & Value Estimates and Forecasts
3.1 Global Plasticizers Sales Estimates and Forecasts 2017-2028
3.2 Global Plasticizers Revenue Estimates and Forecasts 2017-2028
3.3 Global Plasticizers Revenue by Region: 2017 VS 2021 VS 2028
3.4 Global Plasticizers Sales by Region
3.4.1 Global Plasticizers Sales by Region (2017-2022)
3.4.2 Global Sales Plasticizers by Region (2023-2028)
3.5 Global Plasticizers Revenue by Region
3.5.1 Global Plasticizers Revenue by Region (2017-2022)
3.5.2 Global Plasticizers Revenue by Region (2023-2028)
3.6 North America
3.7 Europe
3.8 Asia-Pacific
3.9 Latin America
3.10 Middle East & Africa
4 Competition by Manufactures
4.1 Global Plasticizers Production Capacity by Manufacturers
4.2 Global Plasticizers Sales by Manufacturers
4.2.1 Global Plasticizers Sales by Manufacturers (2017-2022)
4.2.2 Global Plasticizers Sales Market Share by Manufacturers (2017-2022)
4.2.3 Global Top 10 and Top 5 Largest Manufacturers of Plasticizers in 2021
4.3 Global Plasticizers Revenue by Manufacturers
4.3.1 Global Plasticizers Revenue by Manufacturers (2017-2022)
4.3.2 Global Plasticizers Revenue Market Share by Manufacturers (2017-2022)
4.3.3 Global Top 10 and Top 5 Companies by Plasticizers Revenue in 2021
4.4 Global Plasticizers Sales Price by Manufacturers
4.5 Analysis of Competitive Landscape
4.5.1 Manufacturers Market Concentration Ratio (CR5 and HHI)
4.5.2 Global Plasticizers Market Share by Company Type (Tier 1, Tier 2, and Tier 3)
4.5.3 Global Plasticizers Manufacturers Geographical Distribution
4.6 Mergers & Acquisitions, Expansion Plans
5 Market Size by Type
5.1 Global Plasticizers Sales by Type
5.1.1 Global Plasticizers Historical Sales by Type (2017-2022)
5.1.2 Global Plasticizers Forecasted Sales by Type (2023-2028)
5.1.3 Global Plasticizers Sales Market Share by Type (2017-2028)
5.2 Global Plasticizers Revenue by Type
5.2.1 Global Plasticizers Historical Revenue by Type (2017-2022)
5.2.2 Global Plasticizers Forecasted Revenue by Type (2023-2028)
5.2.3 Global Plasticizers Revenue Market Share by Type (2017-2028)
5.3 Global Plasticizers Price by Type
5.3.1 Global Plasticizers Price by Type (2017-2022)
5.3.2 Global Plasticizers Price Forecast by Type (2023-2028)
6 Market Size by Application
6.1 Global Plasticizers Sales by Application
6.1.1 Global Plasticizers Historical Sales by Application (2017-2022)
6.1.2 Global Plasticizers Forecasted Sales by Application (2023-2028)
6.1.3 Global Plasticizers Sales Market Share by Application (2017-2028)
6.2 Global Plasticizers Revenue by Application
6.2.1 Global Plasticizers Historical Revenue by Application (2017-2022)
6.2.2 Global Plasticizers Forecasted Revenue by Application (2023-2028)
6.2.3 Global Plasticizers Revenue Market Share by Application (2017-2028)
6.3 Global Plasticizers Price by Application
6.3.1 Global Plasticizers Price by Application (2017-2022)
6.3.2 Global Plasticizers Price Forecast by Application (2023-2028)
7 North America
7.1 North America Plasticizers Market Size by Type
7.1.1 North America Plasticizers Sales by Type (2017-2028)
7.1.2 North America Plasticizers Revenue by Type (2017-2028)
7.2 North America Plasticizers Market Size by Application
7.2.1 North America Plasticizers Sales by Application (2017-2028)
7.2.2 North America Plasticizers Revenue by Application (2017-2028)
7.3 North America Plasticizers Sales by Country
7.3.1 North America Plasticizers Sales by Country (2017-2028)
7.3.2 North America Plasticizers Revenue by Country (2017-2028)
7.3.3 U.S.
7.3.4 Canada
8 Europe
8.1 Europe Plasticizers Market Size by Type
8.1.1 Europe Plasticizers Sales by Type (2017-2028)
8.1.2 Europe Plasticizers Revenue by Type (2017-2028)
8.2 Europe Plasticizers Market Size by Application
8.2.1 Europe Plasticizers Sales by Application (2017-2028)
8.2.2 Europe Plasticizers Revenue by Application (2017-2028)
8.3 Europe Plasticizers Sales by Country
8.3.1 Europe Plasticizers Sales by Country (2017-2028)
8.3.2 Europe Plasticizers Revenue by Country (2017-2028)
8.3.3 Germany
8.3.4 France
8.3.5 U.K.
8.3.6 Italy
8.3.7 Russia
9 Asia Pacific
9.1 Asia Pacific Plasticizers Market Size by Type
9.1.1 Asia Pacific Plasticizers Sales by Type (2017-2028)
9.1.2 Asia Pacific Plasticizers Revenue by Type (2017-2028)
9.2 Asia Pacific Plasticizers Market Size by Application
9.2.1 Asia Pacific Plasticizers Sales by Application (2017-2028)
9.2.2 Asia Pacific Plasticizers Revenue by Application (2017-2028)
9.3 Asia Pacific Plasticizers Sales by Region
9.3.1 Asia Pacific Plasticizers Sales by Region (2017-2028)
9.3.2 Asia Pacific Plasticizers Revenue by Region (2017-2028)
9.3.3 China
9.3.4 Japan
9.3.5 South Korea
9.3.6 India
9.3.7 Australia
9.3.8 Taiwan
9.3.9 Indonesia
9.3.10 Thailand
9.3.11 Malaysia
9.3.12 Philippines
10 Latin America
10.1 Latin America Plasticizers Market Size by Type
10.1.1 Latin America Plasticizers Sales by Type (2017-2028)
10.1.2 Latin America Plasticizers Revenue by Type (2017-2028)
10.2 Latin America Plasticizers Market Size by Application
10.2.1 Latin America Plasticizers Sales by Application (2017-2028)
10.2.2 Latin America Plasticizers Revenue by Application (2017-2028)
10.3 Latin America Plasticizers Sales by Country
10.3.1 Latin America Plasticizers Sales by Country (2017-2028)
10.3.2 Latin America Plasticizers Revenue by Country (2017-2028)
10.3.3 Mexico
10.3.4 Brazil
10.3.5 Argentina
11 Middle East and Africa
11.1 Middle East and Africa Plasticizers Market Size by Type
11.1.1 Middle East and Africa Plasticizers Sales by Type (2017-2028)
11.1.2 Middle East and Africa Plasticizers Revenue by Type (2017-2028)
11.2 Middle East and Africa Plasticizers Market Size by Application
11.2.1 Middle East and Africa Plasticizers Sales by Application (2017-2028)
11.2.2 Middle East and Africa Plasticizers Revenue by Application (2017-2028)
11.3 Middle East and Africa Plasticizers Sales by Country
11.3.1 Middle East and Africa Plasticizers Sales by Country (2017-2028)
11.3.2 Middle East and Africa Plasticizers Revenue by Country (2017-2028)
11.3.3 Turkey
11.3.4 Saudi Arabia
11.3.5 U.A.E
12 Corporate Profiles
12.1 UPC Group
12.1.1 UPC Group Corporation Information
12.1.2 UPC Group Overview
12.1.3 UPC Group Plasticizers Sales, Price, Revenue and Gross Margin (2017-2022)
12.1.4 UPC Group Plasticizers Product Model Numbers, Pictures, Descriptions and Specifications
12.1.5 UPC Group Recent Developments
12.2 Bluesail
12.2.1 Bluesail Corporation Information
12.2.2 Bluesail Overview
12.2.3 Bluesail Plasticizers Sales, Price, Revenue and Gross Margin (2017-2022)
12.2.4 Bluesail Plasticizers Product Model Numbers, Pictures, Descriptions and Specifications
12.2.5 Bluesail Recent Developments
12.3 Exxonmobil
12.3.1 Exxonmobil Corporation Information
12.3.2 Exxonmobil Overview
12.3.3 Exxonmobil Plasticizers Sales, Price, Revenue and Gross Margin (2017-2022)
12.3.4 Exxonmobil Plasticizers Product Model Numbers, Pictures, Descriptions and Specifications
12.3.5 Exxonmobil Recent Developments
12.4 Henan Qing'an Chemical Hi-Tech
12.4.1 Henan Qing'an Chemical Hi-Tech Corporation Information
12.4.2 Henan Qing'an Chemical Hi-Tech Overview
12.4.3 Henan Qing'an Chemical Hi-Tech Plasticizers Sales, Price, Revenue and Gross Margin (2017-2022)
12.4.4 Henan Qing'an Chemical Hi-Tech Plasticizers Product Model Numbers, Pictures, Descriptions and Specifications
12.4.5 Henan Qing'an Chemical Hi-Tech Recent Developments
12.5 Nan Ya Plastics
12.5.1 Nan Ya Plastics Corporation Information
12.5.2 Nan Ya Plastics Overview
12.5.3 Nan Ya Plastics Plasticizers Sales, Price, Revenue and Gross Margin (2017-2022)
12.5.4 Nan Ya Plastics Plasticizers Product Model Numbers, Pictures, Descriptions and Specifications
12.5.5 Nan Ya Plastics Recent Developments
12.6 Aekyung Petrochemical
12.6.1 Aekyung Petrochemical Corporation Information
12.6.2 Aekyung Petrochemical Overview
12.6.3 Aekyung Petrochemical Plasticizers Sales, Price, Revenue and Gross Margin (2017-2022)
12.6.4 Aekyung Petrochemical Plasticizers Product Model Numbers, Pictures, Descriptions and Specifications
12.6.5 Aekyung Petrochemical Recent Developments
12.7 Evonik
12.7.1 Evonik Corporation Information
12.7.2 Evonik Overview
12.7.3 Evonik Plasticizers Sales, Price, Revenue and Gross Margin (2017-2022)
12.7.4 Evonik Plasticizers Product Model Numbers, Pictures, Descriptions and Specifications
12.7.5 Evonik Recent Developments
12.8 Hongxin Chemical
12.8.1 Hongxin Chemical Corporation Information
12.8.2 Hongxin Chemical Overview
12.8.3 Hongxin Chemical Plasticizers Sales, Price, Revenue and Gross Margin (2017-2022)
12.8.4 Hongxin Chemical Plasticizers Product Model Numbers, Pictures, Descriptions and Specifications
12.8.5 Hongxin Chemical Recent Developments
12.9 Anqing Sheng Feng Chemical
12.9.1 Anqing Sheng Feng Chemical Corporation Information
12.9.2 Anqing Sheng Feng Chemical Overview
12.9.3 Anqing Sheng Feng Chemical Plasticizers Sales, Price, Revenue and Gross Margin (2017-2022)
12.9.4 Anqing Sheng Feng Chemical Plasticizers Product Model Numbers, Pictures, Descriptions and Specifications
12.9.5 Anqing Sheng Feng Chemical Recent Developments
12.10 Basf
12.10.1 Basf Corporation Information
12.10.2 Basf Overview
12.10.3 Basf Plasticizers Sales, Price, Revenue and Gross Margin (2017-2022)
12.10.4 Basf Plasticizers Product Model Numbers, Pictures, Descriptions and Specifications
12.10.5 Basf Recent Developments
12.11 Eastman
12.11.1 Eastman Corporation Information
12.11.2 Eastman Overview
12.11.3 Eastman Plasticizers Sales, Price, Revenue and Gross Margin (2017-2022)
12.11.4 Eastman Plasticizers Product Model Numbers, Pictures, Descriptions and Specifications
12.11.5 Eastman Recent Developments
12.12 Lg Chem
12.12.1 Lg Chem Corporation Information
12.12.2 Lg Chem Overview
12.12.3 Lg Chem Plasticizers Sales, Price, Revenue and Gross Margin (2017-2022)
12.12.4 Lg Chem Plasticizers Product Model Numbers, Pictures, Descriptions and Specifications
12.12.5 Lg Chem Recent Developments
12.13 Perstorp
12.13.1 Perstorp Corporation Information
12.13.2 Perstorp Overview
12.13.3 Perstorp Plasticizers Sales, Price, Revenue and Gross Margin (2017-2022)
12.13.4 Perstorp Plasticizers Product Model Numbers, Pictures, Descriptions and Specifications
12.13.5 Perstorp Recent Developments
12.14 Sinopec Jinling
12.14.1 Sinopec Jinling Corporation Information
12.14.2 Sinopec Jinling Overview
12.14.3 Sinopec Jinling Plasticizers Sales, Price, Revenue and Gross Margin (2017-2022)
12.14.4 Sinopec Jinling Plasticizers Product Model Numbers, Pictures, Descriptions and Specifications
12.14.5 Sinopec Jinling Recent Developments
12.15 Guangdong Rongtai
12.15.1 Guangdong Rongtai Corporation Information
12.15.2 Guangdong Rongtai Overview
12.15.3 Guangdong Rongtai Plasticizers Sales, Price, Revenue and Gross Margin (2017-2022)
12.15.4 Guangdong Rongtai Plasticizers Product Model Numbers, Pictures, Descriptions and Specifications
12.15.5 Guangdong Rongtai Recent Developments
12.16 Zhejiang Jianye Chemical
12.16.1 Zhejiang Jianye Chemical Corporation Information
12.16.2 Zhejiang Jianye Chemical Overview
12.16.3 Zhejiang Jianye Chemical Plasticizers Sales, Price, Revenue and Gross Margin (2017-2022)
12.16.4 Zhejiang Jianye Chemical Plasticizers Product Model Numbers, Pictures, Descriptions and Specifications
12.16.5 Zhejiang Jianye Chemical Recent Developments
12.17 Deza
12.17.1 Deza Corporation Information
12.17.2 Deza Overview
12.17.3 Deza Plasticizers Sales, Price, Revenue and Gross Margin (2017-2022)
12.17.4 Deza Plasticizers Product Model Numbers, Pictures, Descriptions and Specifications
12.17.5 Deza Recent Developments
13 Industry Chain and Sales Channels Analysis
13.1 Plasticizers Industry Chain Analysis
13.2 Plasticizers Key Raw Materials
13.2.1 Key Raw Materials
13.2.2 Raw Materials Key Suppliers
13.3 Plasticizers Production Mode & Process
13.4 Plasticizers Sales and Marketing
13.4.1 Plasticizers Sales Channels
13.4.2 Plasticizers Distributors
13.5 Plasticizers Customers
14 Market Drivers, Opportunities, Challenges and Risks Factors Analysis
14.1 Plasticizers Industry Trends
14.2 Plasticizers Market Drivers
14.3 Plasticizers Market Challenges
14.4 Plasticizers Market Restraints
15 Key Finding in The Global Plasticizers Study
16 Appendix
16.1 Research Methodology
16.1.1 Methodology/Research Approach
16.1.2 Data Source
16.2 Author Details
16.3 Disclaimer
List of Tables
Table 1. Global Plasticizers Market Size Growth Rate by Type, 2017 VS 2021 VS 2028 (US$ Million)
Table 2. Major Manufacturers of Low Phthalates
Table 3. Major Manufacturers of High Phthalates
Table 4. Major Manufacturers of Non-phthalates
Table 5. Global Plasticizers Market Size Growth Rate by Application, 2017 VS 2021 2028 (US$ Million)
Table 6. Global Plasticizers Production by Region: 2017 VS 2021 VS 2028 (K MT)
Table 7. Global Plasticizers Production by Region (2017-2022) & (K MT)
Table 8. Global Plasticizers Production Market Share by Region (2017-2022)
Table 9. Global Plasticizers Production by Region (2023-2028) & (K MT)
Table 10. Global Plasticizers Production Market Share by Region (2023-2028)
Table 11. Global Plasticizers Revenue by Region: 2017 VS 2021 VS 2028 (US$ Million)
Table 12. Global Plasticizers Sales by Region (2017-2022) & (K MT)
Table 13. Global Plasticizers Sales Market Share by Region (2017-2022)
Table 14. Global Plasticizers Sales by Region (2023-2028) & (K MT)
Table 15. Global Plasticizers Sales Market Share by Region (2023-2028)
Table 16. Global Plasticizers Revenue by Region (2017-2022) & (US$ Million)
Table 17. Global Plasticizers Revenue Market Share by Region (2017-2022)
Table 18. Global Plasticizers Revenue by Region (2023-2028) & (US$ Million)
Table 19. Global Plasticizers Revenue Market Share by Region (2023-2028)
Table 20. Global Plasticizers Production Capacity by Manufacturers (2017-2022) & (K MT)
Table 21. Global Plasticizers Capacity Market Share by Manufacturers (2017-2022)
Table 22. Global Plasticizers Sales by Manufacturers (2017-2022) & (K MT)
Table 23. Global Plasticizers Sales Market Share by Manufacturers (2017-2022)
Table 24. Global Plasticizers Revenue by Manufacturers (2017-2022) & (US$ Million)
Table 25. Global Plasticizers Revenue Share by Manufacturers (2017-2022)
Table 26. Plasticizers Price by Manufacturers 2017-2022 (USD/MT)
Table 27. Global Plasticizers Manufacturers Market Concentration Ratio (CR5 and HHI)
Table 28. Global Plasticizers by Company Type (Tier 1, Tier 2, and Tier 3) & (based on the Revenue in Plasticizers as of 2021)
Table 29. Plasticizers Manufacturing Base Distribution and Headquarters
Table 30. Manufacturers Plasticizers Product Offered
Table 31. Date of Manufacturers Enter into Plasticizers Market
Table 32. Mergers & Acquisitions, Expansion Plans
Table 33. Global Plasticizers Sales by Type (2017-2022) & (K MT)
Table 34. Global Plasticizers Sales by Type (2023-2028) & (K MT)
Table 35. Global Plasticizers Sales Share by Type (2017-2022)
Table 36. Global Plasticizers Sales Share by Type (2023-2028)
Table 37. Global Plasticizers Revenue by Type (2017-2022) & (US$ Million)
Table 38. Global Plasticizers Revenue by Type (2023-2028) & (US$ Million)
Table 39. Global Plasticizers Revenue Share by Type (2017-2022)
Table 40. Global Plasticizers Revenue Share by Type (2023-2028)
Table 41. Plasticizers Price by Type (2017-2022) & (USD/MT)
Table 42. Global Plasticizers Price Forecast by Type (2023-2028) & (USD/MT)
Table 43. Global Plasticizers Sales by Application (2017-2022) & (K MT)
Table 44. Global Plasticizers Sales by Application (2023-2028) & (K MT)
Table 45. Global Plasticizers Sales Share by Application (2017-2022)
Table 46. Global Plasticizers Sales Share by Application (2023-2028)
Table 47. Global Plasticizers Revenue by Application (2017-2022) & (US$ Million)
Table 48. Global Plasticizers Revenue by Application (2023-2028) & (US$ Million)
Table 49. Global Plasticizers Revenue Share by Application (2017-2022)
Table 50. Global Plasticizers Revenue Share by Application (2023-2028)
Table 51. Plasticizers Price by Application (2017-2022) & (USD/MT)
Table 52. Global Plasticizers Price Forecast by Application (2023-2028) & (USD/MT)
Table 53. North America Plasticizers Sales by Type (2017-2022) & (K MT)
Table 54. North America Plasticizers Sales by Type (2023-2028) & (K MT)
Table 55. North America Plasticizers Revenue by Type (2017-2022) & (US$ Million)
Table 56. North America Plasticizers Revenue by Type (2023-2028) & (US$ Million)
Table 57. North America Plasticizers Sales by Application (2017-2022) & (K MT)
Table 58. North America Plasticizers Sales by Application (2023-2028) & (K MT)
Table 59. North America Plasticizers Revenue by Application (2017-2022) & (US$ Million)
Table 60. North America Plasticizers Revenue by Application (2023-2028) & (US$ Million)
Table 61. North America Plasticizers Sales by Country (2017-2022) & (K MT)
Table 62. North America Plasticizers Sales by Country (2023-2028) & (K MT)
Table 63. North America Plasticizers Revenue by Country (2017-2022) & (US$ Million)
Table 64. North America Plasticizers Revenue by Country (2023-2028) & (US$ Million)
Table 65. Europe Plasticizers Sales by Type (2017-2022) & (K MT)
Table 66. Europe Plasticizers Sales by Type (2023-2028) & (K MT)
Table 67. Europe Plasticizers Revenue by Type (2017-2022) & (US$ Million)
Table 68. Europe Plasticizers Revenue by Type (2023-2028) & (US$ Million)
Table 69. Europe Plasticizers Sales by Application (2017-2022) & (K MT)
Table 70. Europe Plasticizers Sales by Application (2023-2028) & (K MT)
Table 71. Europe Plasticizers Revenue by Application (2017-2022) & (US$ Million)
Table 72. Europe Plasticizers Revenue by Application (2023-2028) & (US$ Million)
Table 73. Europe Plasticizers Sales by Country (2017-2022) & (K MT)
Table 74. Europe Plasticizers Sales by Country (2023-2028) & (K MT)
Table 75. Europe Plasticizers Revenue by Country (2017-2022) & (US$ Million)
Table 76. Europe Plasticizers Revenue by Country (2023-2028) & (US$ Million)
Table 77. Asia Pacific Plasticizers Sales by Type (2017-2022) & (K MT)
Table 78. Asia Pacific Plasticizers Sales by Type (2023-2028) & (K MT)
Table 79. Asia Pacific Plasticizers Revenue by Type (2017-2022) & (US$ Million)
Table 80. Asia Pacific Plasticizers Revenue by Type (2023-2028) & (US$ Million)
Table 81. Asia Pacific Plasticizers Sales by Application (2017-2022) & (K MT)
Table 82. Asia Pacific Plasticizers Sales by Application (2023-2028) & (K MT)
Table 83. Asia Pacific Plasticizers Revenue by Application (2017-2022) & (US$ Million)
Table 84. Asia Pacific Plasticizers Revenue by Application (2023-2028) & (US$ Million)
Table 85. Asia Pacific Plasticizers Sales by Region (2017-2022) & (K MT)
Table 86. Asia Pacific Plasticizers Sales by Region (2023-2028) & (K MT)
Table 87. Asia Pacific Plasticizers Revenue by Region (2017-2022) & (US$ Million)
Table 88. Asia Pacific Plasticizers Revenue by Region (2023-2028) & (US$ Million)
Table 89. Latin America Plasticizers Sales by Type (2017-2022) & (K MT)
Table 90. Latin America Plasticizers Sales by Type (2023-2028) & (K MT)
Table 91. Latin America Plasticizers Revenue by Type (2017-2022) & (US$ Million)
Table 92. Latin America Plasticizers Revenue by Type (2023-2028) & (US$ Million)
Table 93. Latin America Plasticizers Sales by Application (2017-2022) & (K MT)
Table 94. Latin America Plasticizers Sales by Application (2023-2028) & (K MT)
Table 95. Latin America Plasticizers Revenue by Application (2017-2022) & (US$ Million)
Table 96. Latin America Plasticizers Revenue by Application (2023-2028) & (US$ Million)
Table 97. Latin America Plasticizers Sales by Country (2017-2022) & (K MT)
Table 98. Latin America Plasticizers Sales by Country (2023-2028) & (K MT)
Table 99. Latin America Plasticizers Revenue by Country (2017-2022) & (US$ Million)
Table 100. Latin America Plasticizers Revenue by Country (2023-2028) & (US$ Million)
Table 101. Middle East and Africa Plasticizers Sales by Type (2017-2022) & (K MT)
Table 102. Middle East and Africa Plasticizers Sales by Type (2023-2028) & (K MT)
Table 103. Middle East and Africa Plasticizers Revenue by Type (2017-2022) & (US$ Million)
Table 104. Middle East and Africa Plasticizers Revenue by Type (2023-2028) & (US$ Million)
Table 105. Middle East and Africa Plasticizers Sales by Application (2017-2022) & (K MT)
Table 106. Middle East and Africa Plasticizers Sales by Application (2023-2028) & (K MT)
Table 107. Middle East and Africa Plasticizers Revenue by Application (2017-2022) & (US$ Million)
Table 108. Middle East and Africa Plasticizers Revenue by Application (2023-2028) & (US$ Million)
Table 109. Middle East and Africa Plasticizers Sales by Country (2017-2022) & (K MT)
Table 110. Middle East and Africa Plasticizers Sales by Country (2023-2028) & (K MT)
Table 111. Middle East and Africa Plasticizers Revenue by Country (2017-2022) & (US$ Million)
Table 112. Middle East and Africa Plasticizers Revenue by Country (2023-2028) & (US$ Million)
Table 113. UPC Group Corporation Information
Table 114. UPC Group Description and Major Businesses
Table 115. UPC Group Plasticizers Sales (K MT), Revenue (US$ Million), Price (USD/MT) and Gross Margin (2017-2022)
Table 116. UPC Group Plasticizers Product Model Numbers, Pictures, Descriptions and Specifications
Table 117. UPC Group Recent Development
Table 118. Bluesail Corporation Information
Table 119. Bluesail Description and Major Businesses
Table 120. Bluesail Plasticizers Sales (K MT), Revenue (US$ Million), Price (USD/MT) and Gross Margin (2017-2022)
Table 121. Bluesail Plasticizers Product Model Numbers, Pictures, Descriptions and Specifications
Table 122. Bluesail Recent Development
Table 123. Exxonmobil Corporation Information
Table 124. Exxonmobil Description and Major Businesses
Table 125. Exxonmobil Plasticizers Sales (K MT), Revenue (US$ Million), Price (USD/MT) and Gross Margin (2017-2022)
Table 126. Exxonmobil Plasticizers Product Model Numbers, Pictures, Descriptions and Specifications
Table 127. Exxonmobil Recent Development
Table 128. Henan Qing'an Chemical Hi-Tech Corporation Information
Table 129. Henan Qing'an Chemical Hi-Tech Description and Major Businesses
Table 130. Henan Qing'an Chemical Hi-Tech Plasticizers Sales (K MT), Revenue (US$ Million), Price (USD/MT) and Gross Margin (2017-2022)
Table 131. Henan Qing'an Chemical Hi-Tech Plasticizers Product Model Numbers, Pictures, Descriptions and Specifications
Table 132. Henan Qing'an Chemical Hi-Tech Recent Development
Table 133. Nan Ya Plastics Corporation Information
Table 134. Nan Ya Plastics Description and Major Businesses
Table 135. Nan Ya Plastics Plasticizers Sales (K MT), Revenue (US$ Million), Price (USD/MT) and Gross Margin (2017-2022)
Table 136. Nan Ya Plastics Plasticizers Product Model Numbers, Pictures, Descriptions and Specifications
Table 137. Nan Ya Plastics Recent Development
Table 138. Aekyung Petrochemical Corporation Information
Table 139. Aekyung Petrochemical Description and Major Businesses
Table 140. Aekyung Petrochemical Plasticizers Sales (K MT), Revenue (US$ Million), Price (USD/MT) and Gross Margin (2017-2022)
Table 141. Aekyung Petrochemical Plasticizers Product Model Numbers, Pictures, Descriptions and Specifications
Table 142. Aekyung Petrochemical Recent Development
Table 143. Evonik Corporation Information
Table 144. Evonik Description and Major Businesses
Table 145. Evonik Plasticizers Sales (K MT), Revenue (US$ Million), Price (USD/MT) and Gross Margin (2017-2022)
Table 146. Evonik Plasticizers Product Model Numbers, Pictures, Descriptions and Specifications
Table 147. Evonik Recent Development
Table 148. Hongxin Chemical Corporation Information
Table 149. Hongxin Chemical Description and Major Businesses
Table 150. Hongxin Chemical Plasticizers Sales (K MT), Revenue (US$ Million), Price (USD/MT) and Gross Margin (2017-2022)
Table 151. Hongxin Chemical Plasticizers Product Model Numbers, Pictures, Descriptions and Specifications
Table 152. Hongxin Chemical Recent Development
Table 153. Anqing Sheng Feng Chemical Corporation Information
Table 154. Anqing Sheng Feng Chemical Description and Major Businesses
Table 155. Anqing Sheng Feng Chemical Plasticizers Sales (K MT), Revenue (US$ Million), Price (USD/MT) and Gross Margin (2017-2022)
Table 156. Anqing Sheng Feng Chemical Plasticizers Product Model Numbers, Pictures, Descriptions and Specifications
Table 157. Anqing Sheng Feng Chemical Recent Development
Table 158. Basf Corporation Information
Table 159. Basf Description and Major Businesses
Table 160. Basf Plasticizers Sales (K MT), Revenue (US$ Million), Price (USD/MT) and Gross Margin (2017-2022)
Table 161. Basf Plasticizers Product Model Numbers, Pictures, Descriptions and Specifications
Table 162. Basf Recent Development
Table 163. Eastman Corporation Information
Table 164. Eastman Description and Major Businesses
Table 165. Eastman Plasticizers Sales (K MT), Revenue (US$ Million), Price (USD/MT) and Gross Margin (2017-2022)
Table 166. Eastman Plasticizers Product Model Numbers, Pictures, Descriptions and Specifications
Table 167. Eastman Recent Development
Table 168. Lg Chem Corporation Information
Table 169. Lg Chem Description and Major Businesses
Table 170. Lg Chem Plasticizers Sales (K MT), Revenue (US$ Million), Price (USD/MT) and Gross Margin (2017-2022)
Table 171. Lg Chem Plasticizers Product Model Numbers, Pictures, Descriptions and Specifications
Table 172. Lg Chem Recent Development
Table 173. Perstorp Corporation Information
Table 174. Perstorp Description and Major Businesses
Table 175. Perstorp Plasticizers Sales (K MT), Revenue (US$ Million), Price (USD/MT) and Gross Margin (2017-2022)
Table 176. Perstorp Plasticizers Product Model Numbers, Pictures, Descriptions and Specifications
Table 177. Perstorp Recent Development
Table 178. Sinopec Jinling Corporation Information
Table 179. Sinopec Jinling Description and Major Businesses
Table 180. Sinopec Jinling Plasticizers Sales (K MT), Revenue (US$ Million), Price (USD/MT) and Gross Margin (2017-2022)
Table 181. Sinopec Jinling Plasticizers Product Model Numbers, Pictures, Descriptions and Specifications
Table 182. Sinopec Jinling Recent Development
Table 183. Guangdong Rongtai Corporation Information
Table 184. Guangdong Rongtai Description and Major Businesses
Table 185. Guangdong Rongtai Plasticizers Sales (K MT), Revenue (US$ Million), Price (USD/MT) and Gross Margin (2017-2022)
Table 186. Guangdong Rongtai Plasticizers Product Model Numbers, Pictures, Descriptions and Specifications
Table 187. Guangdong Rongtai Recent Development
Table 188. Zhejiang Jianye Chemical Corporation Information
Table 189. Zhejiang Jianye Chemical Description and Major Businesses
Table 190. Zhejiang Jianye Chemical Plasticizers Sales (K MT), Revenue (US$ Million), Price (USD/MT) and Gross Margin (2017-2022)
Table 191. Zhejiang Jianye Chemical Plasticizers Product Model Numbers, Pictures, Descriptions and Specifications
Table 192. Zhejiang Jianye Chemical Recent Development
Table 193. Deza Corporation Information
Table 194. Deza Description and Major Businesses
Table 195. Deza Plasticizers Sales (K MT), Revenue (US$ Million), Price (USD/MT) and Gross Margin (2017-2022)
Table 196. Deza Plasticizers Product Model Numbers, Pictures, Descriptions and Specifications
Table 197. Deza Recent Development
Table 198. Key Raw Materials Lists
Table 199. Raw Materials Key Suppliers Lists
Table 200. Plasticizers Distributors List
Table 201. Plasticizers Customers List
Table 202. Plasticizers Market Trends
Table 203. Plasticizers Market Drivers
Table 204. Plasticizers Market Challenges
Table 205. Plasticizers Market Restraints
Table 206. Research Programs/Design for This Report
Table 207. Key Data Information from Secondary Sources
Table 208. Key Data Information from Primary Sources
List of Figures
Figure 1. Plasticizers Product Picture
Figure 2. Global Plasticizers Market Share by Type in 2021 & 2028
Figure 3. Low Phthalates Product Picture
Figure 4. High Phthalates Product Picture
Figure 5. Non-phthalates Product Picture
Figure 6. Global Plasticizers Market Share by Application in 2021 & 2028
Figure 7. Flooring & Wall Coverings
Figure 8. Film & Sheet
Figure 9. Wire & Cable
Figure 10. Coated Fabric
Figure 11. Consumer Goods
Figure 12. Others
Figure 13. Plasticizers Report Years Considered
Figure 14. Global Plasticizers Capacity, Production and Utilization (2017-2028) & (K MT)
Figure 15. Global Plasticizers Production Market Share by Region in Percentage: 2021 Versus 2028
Figure 16. Global Plasticizers Production Market Share by Region (2017-2022)
Figure 17. Global Plasticizers Production Market Share by Region (2023-2028)
Figure 18. Plasticizers Production Growth Rate in North America (2017-2028) & (K MT)
Figure 19. Plasticizers Production Growth Rate in Europe (2017-2028) & (K MT)
Figure 20. Plasticizers Production Growth Rate in China (2017-2028) & (K MT)
Figure 21. Plasticizers Production Growth Rate in Japan (2017-2028) & (K MT)
Figure 22. Global Plasticizers Sales 2017-2028 (K MT)
Figure 23. Global Plasticizers Revenue, (US$ Million), 2017 VS 2021 VS 2028
Figure 24. Global Plasticizers Revenue 2017-2028 (US$ Million)
Figure 25. Global Plasticizers Revenue Market Share by Region in Percentage: 2021 Versus 2028
Figure 26. Global Plasticizers Sales Market Share by Region (2017-2022)
Figure 27. Global Plasticizers Sales Market Share by Region (2023-2028)
Figure 28. North America Plasticizers Sales YoY (2017-2028) & (K MT)
Figure 29. North America Plasticizers Revenue YoY (2017-2028) & (US$ Million)
Figure 30. Europe Plasticizers Sales YoY (2017-2028) & (K MT)
Figure 31. Europe Plasticizers Revenue YoY (2017-2028) & (US$ Million)
Figure 32. Asia-Pacific Plasticizers Sales YoY (2017-2028) & (K MT)
Figure 33. Asia-Pacific Plasticizers Revenue YoY (2017-2028) & (US$ Million)
Figure 34. Latin America Plasticizers Sales YoY (2017-2028) & (K MT)
Figure 35. Latin America Plasticizers Revenue YoY (2017-2028) & (US$ Million)
Figure 36. Middle East & Africa Plasticizers Sales YoY (2017-2028) & (K MT)
Figure 37. Middle East & Africa Plasticizers Revenue YoY (2017-2028) & (US$ Million)
Figure 38. The Plasticizers Market Share of Top 10 and Top 5 Largest Manufacturers Around the World in 2021
Figure 39. The Top 5 and 10 Largest Manufacturers of Plasticizers in the World: Market Share by Plasticizers Revenue in 2021
Figure 40. Plasticizers Market Share by Company Type (Tier 1, Tier 2, and Tier 3): 2017 VS 2021
Figure 41. Global Plasticizers Sales Market Share by Type (2017-2028)
Figure 42. Global Plasticizers Revenue Market Share by Type (2017-2028)
Figure 43. Global Plasticizers Sales Market Share by Application (2017-2028)
Figure 44. Global Plasticizers Revenue Market Share by Application (2017-2028)
Figure 45. North America Plasticizers Sales Market Share by Type (2017-2028)
Figure 46. North America Plasticizers Revenue Market Share by Type (2017-2028)
Figure 47. North America Plasticizers Sales Market Share by Application (2017-2028)
Figure 48. North America Plasticizers Revenue Market Share by Application (2017-2028)
Figure 49. North America Plasticizers Sales Share by Country (2017-2028)
Figure 50. North America Plasticizers Revenue Share by Country (2017-2028)
Figure 51. U.S. Plasticizers Revenue (2017-2028) & (US$ Million)
Figure 52. Canada Plasticizers Revenue (2017-2028) & (US$ Million)
Figure 53. Europe Plasticizers Sales Market Share by Type (2017-2028)
Figure 54. Europe Plasticizers Revenue Market Share by Type (2017-2028)
Figure 55. Europe Plasticizers Sales Market Share by Application (2017-2028)
Figure 56. Europe Plasticizers Revenue Market Share by Application (2017-2028)
Figure 57. Europe Plasticizers Sales Share by Country (2017-2028)
Figure 58. Europe Plasticizers Revenue Share by Country (2017-2028)
Figure 59. Germany Plasticizers Revenue (2017-2028) & (US$ Million)
Figure 60. France Plasticizers Revenue (2017-2028) & (US$ Million)
Figure 61. U.K. Plasticizers Revenue (2017-2028) & (US$ Million)
Figure 62. Italy Plasticizers Revenue (2017-2028) & (US$ Million)
Figure 63. Russia Plasticizers Revenue (2017-2028) & (US$ Million)
Figure 64. Asia Pacific Plasticizers Sales Market Share by Type (2017-2028)
Figure 65. Asia Pacific Plasticizers Revenue Market Share by Type (2017-2028)
Figure 66. Asia Pacific Plasticizers Sales Market Share by Application (2017-2028)
Figure 67. Asia Pacific Plasticizers Revenue Market Share by Application (2017-2028)
Figure 68. Asia Pacific Plasticizers Sales Share by Region (2017-2028)
Figure 69. Asia Pacific Plasticizers Revenue Share by Region (2017-2028)
Figure 70. China Plasticizers Revenue (2017-2028) & (US$ Million)
Figure 71. Japan Plasticizers Revenue (2017-2028) & (US$ Million)
Figure 72. South Korea Plasticizers Revenue (2017-2028) & (US$ Million)
Figure 73. India Plasticizers Revenue (2017-2028) & (US$ Million)
Figure 74. Australia Plasticizers Revenue (2017-2028) & (US$ Million)
Figure 75. Taiwan Plasticizers Revenue (2017-2028) & (US$ Million)
Figure 76. Indonesia Plasticizers Revenue (2017-2028) & (US$ Million)
Figure 77. Thailand Plasticizers Revenue (2017-2028) & (US$ Million)
Figure 78. Malaysia Plasticizers Revenue (2017-2028) & (US$ Million)
Figure 79. Philippines Plasticizers Revenue (2017-2028) & (US$ Million)
Figure 80. Latin America Plasticizers Sales Market Share by Type (2017-2028)
Figure 81. Latin America Plasticizers Revenue Market Share by Type (2017-2028)
Figure 82. Latin America Plasticizers Sales Market Share by Application (2017-2028)
Figure 83. Latin America Plasticizers Revenue Market Share by Application (2017-2028)
Figure 84. Latin America Plasticizers Sales Share by Country (2017-2028)
Figure 85. Latin America Plasticizers Revenue Share by Country (2017-2028)
Figure 86. Mexico Plasticizers Revenue (2017-2028) & (US$ Million)
Figure 87. Brazil Plasticizers Revenue (2017-2028) & (US$ Million)
Figure 88. Argentina Plasticizers Revenue (2017-2028) & (US$ Million)
Figure 89. Middle East and Africa Plasticizers Sales Market Share by Type (2017-2028)
Figure 90. Middle East and Africa Plasticizers Revenue Market Share by Type (2017-2028)
Figure 91. Middle East and Africa Plasticizers Sales Market Share by Application (2017-2028)
Figure 92. Middle East and Africa Plasticizers Revenue Market Share by Application (2017-2028)
Figure 93. Middle East and Africa Plasticizers Sales Share by Country (2017-2028)
Figure 94. Middle East and Africa Plasticizers Revenue Share by Country (2017-2028)
Figure 95. Turkey Plasticizers Revenue (2017-2028) & (US$ Million)
Figure 96. Saudi Arabia Plasticizers Revenue (2017-2028) & (US$ Million)
Figure 97. U.A.E Plasticizers Revenue (2017-2028) & (US$ Million)
Figure 98. Plasticizers Value Chain
Figure 99. Plasticizers Production Process
Figure 100. Channels of Distribution
Figure 101. Distributors Profiles
Figure 102. Bottom-up and Top-down Approaches for This Report
Figure 103. Data Triangulation
Figure 104. Key Executives Interviewed
$4900
$9800
