List of Tables
Table 1. Global Rubber Molding Service Market Size Growth Rate by Type (US$ Million): 2021 vs 2025 vs 2032
Table 2. Key Players of Compression Molding of Rubber
Table 3. Key Players of Injection Molding of Rubber
Table 4. Key Players of Extrusion Molding of Rubber
Table 5. Key Players of Casting Molding of Rubber
Table 6. Key Players of Other
Table 7. Global Rubber Molding Service Market Size Growth Rate by Applicable Rubber (US$ Million): 2021 vs 2025 vs 2032
Table 8. Key Players of General Rubber
Table 9. Key Players of Specialty Rubber
Table 10. Key Players of Foamed Rubber
Table 11. Key Players of Liquid Rubber
Table 12. Global Rubber Molding Service Market Size Growth Rate by Service Content (US$ Million): 2021 vs 2025 vs 2032
Table 13. Key Players of Full-Process Customized Molding Services
Table 14. Key Players of Mass Production Molding Services
Table 15. Key Players of Sample Prototyping Molding Services
Table 16. Key Players of Mold + Molding Integrated Services
Table 17. Key Players of Post-Processing Molding Services
Table 18. Global Rubber Molding Service Market Size Growth by Application (US$ Million): 2021 vs 2025 vs 2032
Table 19. Global Rubber Molding Service Market Size by Region (US$ Million): 2021 vs 2025 vs 2032
Table 20. Global Rubber Molding Service Market Size by Region (US$ Million), 2021–2026
Table 21. Global Rubber Molding Service Market Share by Region (2021–2026)
Table 22. Global Rubber Molding Service Forecasted Market Size by Region (US$ Million), 2027–2032
Table 23. Global Rubber Molding Service Market Share by Region (2027–2032)
Table 24. Rubber Molding Service Market Trends
Table 25. Rubber Molding Service Market Drivers
Table 26. Rubber Molding Service Market Challenges
Table 27. Rubber Molding Service Market Restraints
Table 28. Global Rubber Molding Service Revenue by Players (US$ Million), 2021–2026
Table 29. Global Rubber Molding Service Market Share by Players (2021–2026)
Table 30. Global Top Rubber Molding Service Players by Tier (Tier 1, Tier 2, and Tier 3), based on Rubber Molding Service Revenue, 2025
Table 31. Ranking of Global Top Rubber Molding Service Companies by Revenue (US$ Million) in 2025
Table 32. Global 5 Largest Players Market Share by Rubber Molding Service Revenue (CR5 and HHI), 2021–2026
Table 33. Global Key Players of Rubber Molding Service, Headquarters and Area Served
Table 34. Global Key Players of Rubber Molding Service, Products and Applications
Table 35. Global Key Players of Rubber Molding Service, Date of General Availability (GA)
Table 36. Mergers and Acquisitions, Expansion Plans
Table 37. Global Rubber Molding Service Market Size by Type (US$ Million), 2021–2026
Table 38. Global Rubber Molding Service Revenue Market Share by Type (2021–2026)
Table 39. Global Rubber Molding Service Forecasted Market Size by Type (US$ Million), 2027–2032
Table 40. Global Rubber Molding Service Revenue Market Share by Type (2027–2032)
Table 41. Global Rubber Molding Service Market Size by Application (US$ Million), 2021–2026
Table 42. Global Rubber Molding Service Revenue Market Share by Application (2021–2026)
Table 43. Global Rubber Molding Service Forecasted Market Size by Application (US$ Million), 2027–2032
Table 44. Global Rubber Molding Service Revenue Market Share by Application (2027–2032)
Table 45. North America Rubber Molding Service Market Size Growth Rate by Country (US$ Million): 2021 vs 2025 vs 2032
Table 46. North America Rubber Molding Service Market Size by Country (US$ Million), 2021–2026
Table 47. North America Rubber Molding Service Market Size by Country (US$ Million), 2027–2032
Table 48. Europe Rubber Molding Service Market Size Growth Rate by Country (US$ Million): 2021 vs 2025 vs 2032
Table 49. Europe Rubber Molding Service Market Size by Country (US$ Million), 2021–2026
Table 50. Europe Rubber Molding Service Market Size by Country (US$ Million), 2027–2032
Table 51. Asia-Pacific Rubber Molding Service Market Size Growth Rate by Region (US$ Million): 2021 vs 2025 vs 2032
Table 52. Asia-Pacific Rubber Molding Service Market Size by Region (US$ Million), 2021–2026
Table 53. Asia-Pacific Rubber Molding Service Market Size by Region (US$ Million), 2027–2032
Table 54. Latin America Rubber Molding Service Market Size Growth Rate by Country (US$ Million): 2021 vs 2025 vs 2032
Table 55. Latin America Rubber Molding Service Market Size by Country (US$ Million), 2021–2026
Table 56. Latin America Rubber Molding Service Market Size by Country (US$ Million), 2027–2032
Table 57. Middle East & Africa Rubber Molding Service Market Size Growth Rate by Country (US$ Million): 2021 vs 2025 vs 2032
Table 58. Middle East & Africa Rubber Molding Service Market Size by Country (US$ Million), 2021–2026
Table 59. Middle East & Africa Rubber Molding Service Market Size by Country (US$ Million), 2027–2032
Table 60. Trelleborg Company Details
Table 61. Trelleborg Business Overview
Table 62. Trelleborg Rubber Molding Service Product
Table 63. Trelleborg Revenue in Rubber Molding Service Business (US$ Million), 2021–2026
Table 64. Trelleborg Recent Development
Table 65. Freudenberg Sealing Technologies Company Details
Table 66. Freudenberg Sealing Technologies Business Overview
Table 67. Freudenberg Sealing Technologies Rubber Molding Service Product
Table 68. Freudenberg Sealing Technologies Revenue in Rubber Molding Service Business (US$ Million), 2021–2026
Table 69. Freudenberg Sealing Technologies Recent Development
Table 70. Hutchinson Company Details
Table 71. Hutchinson Business Overview
Table 72. Hutchinson Rubber Molding Service Product
Table 73. Hutchinson Revenue in Rubber Molding Service Business (US$ Million), 2021–2026
Table 74. Hutchinson Recent Development
Table 75. Continental Company Details
Table 76. Continental Business Overview
Table 77. Continental Rubber Molding Service Product
Table 78. Continental Revenue in Rubber Molding Service Business (US$ Million), 2021–2026
Table 79. Continental Recent Development
Table 80. Datwyler Company Details
Table 81. Datwyler Business Overview
Table 82. Datwyler Rubber Molding Service Product
Table 83. Datwyler Revenue in Rubber Molding Service Business (US$ Million), 2021–2026
Table 84. Datwyler Recent Development
Table 85. Parker Hannifin Company Details
Table 86. Parker Hannifin Business Overview
Table 87. Parker Hannifin Rubber Molding Service Product
Table 88. Parker Hannifin Revenue in Rubber Molding Service Business (US$ Million), 2021–2026
Table 89. Parker Hannifin Recent Development
Table 90. Cooper Standard Company Details
Table 91. Cooper Standard Business Overview
Table 92. Cooper Standard Rubber Molding Service Product
Table 93. Cooper Standard Revenue in Rubber Molding Service Business (US$ Million), 2021–2026
Table 94. Cooper Standard Recent Development
Table 95. Sumitomo Riko Company Details
Table 96. Sumitomo Riko Business Overview
Table 97. Sumitomo Riko Rubber Molding Service Product
Table 98. Sumitomo Riko Revenue in Rubber Molding Service Business (US$ Million), 2021–2026
Table 99. Sumitomo Riko Recent Development
Table 100. Toyoda Gosei Company Details
Table 101. Toyoda Gosei Business Overview
Table 102. Toyoda Gosei Rubber Molding Service Product
Table 103. Toyoda Gosei Revenue in Rubber Molding Service Business (US$ Million), 2021–2026
Table 104. Toyoda Gosei Recent Development
Table 105. NOK Company Details
Table 106. NOK Business Overview
Table 107. NOK Rubber Molding Service Product
Table 108. NOK Revenue in Rubber Molding Service Business (US$ Million), 2021–2026
Table 109. NOK Recent Development
Table 110. Anhui Zhongding Holding Group Company Details
Table 111. Anhui Zhongding Holding Group Business Overview
Table 112. Anhui Zhongding Holding Group Rubber Molding Service Product
Table 113. Anhui Zhongding Holding Group Revenue in Rubber Molding Service Business (US$ Million), 2021–2026
Table 114. Anhui Zhongding Holding Group Recent Development
Table 115. Greene Tweed Company Details
Table 116. Greene Tweed Business Overview
Table 117. Greene Tweed Rubber Molding Service Product
Table 118. Greene Tweed Revenue in Rubber Molding Service Business (US$ Million), 2021–2026
Table 119. Greene Tweed Recent Development
Table 120. James Walker Company Details
Table 121. James Walker Business Overview
Table 122. James Walker Rubber Molding Service Product
Table 123. James Walker Revenue in Rubber Molding Service Business (US$ Million), 2021–2026
Table 124. James Walker Recent Development
Table 125. Precision Polymer Engineering Company Details
Table 126. Precision Polymer Engineering Business Overview
Table 127. Precision Polymer Engineering Rubber Molding Service Product
Table 128. Precision Polymer Engineering Revenue in Rubber Molding Service Business (US$ Million), 2021–2026
Table 129. Precision Polymer Engineering Recent Development
Table 130. RICO Elastomere Projecting Company Details
Table 131. RICO Elastomere Projecting Business Overview
Table 132. RICO Elastomere Projecting Rubber Molding Service Product
Table 133. RICO Elastomere Projecting Revenue in Rubber Molding Service Business (US$ Million), 2021–2026
Table 134. RICO Elastomere Projecting Recent Development
Table 135. Nishikawa Rubber Company Details
Table 136. Nishikawa Rubber Business Overview
Table 137. Nishikawa Rubber Rubber Molding Service Product
Table 138. Nishikawa Rubber Revenue in Rubber Molding Service Business (US$ Million), 2021–2026
Table 139. Nishikawa Rubber Recent Development
Table 140. Sumitomo Rubber Industries Company Details
Table 141. Sumitomo Rubber Industries Business Overview
Table 142. Sumitomo Rubber Industries Rubber Molding Service Product
Table 143. Sumitomo Rubber Industries Revenue in Rubber Molding Service Business (US$ Million), 2021–2026
Table 144. Sumitomo Rubber Industries Recent Development
Table 145. Yokohama Industries Americas Ohio Company Details
Table 146. Yokohama Industries Americas Ohio Business Overview
Table 147. Yokohama Industries Americas Ohio Rubber Molding Service Product
Table 148. Yokohama Industries Americas Ohio Revenue in Rubber Molding Service Business (US$ Million), 2021–2026
Table 149. Yokohama Industries Americas Ohio Recent Development
Table 150. Protolabs Company Details
Table 151. Protolabs Business Overview
Table 152. Protolabs Rubber Molding Service Product
Table 153. Protolabs Revenue in Rubber Molding Service Business (US$ Million), 2021–2026
Table 154. Protolabs Recent Development
Table 155. Borflex Group Company Details
Table 156. Borflex Group Business Overview
Table 157. Borflex Group Rubber Molding Service Product
Table 158. Borflex Group Revenue in Rubber Molding Service Business (US$ Million), 2021–2026
Table 159. Borflex Group Recent Development
Table 160. EXSTO Company Details
Table 161. EXSTO Business Overview
Table 162. EXSTO Rubber Molding Service Product
Table 163. EXSTO Revenue in Rubber Molding Service Business (US$ Million), 2021–2026
Table 164. EXSTO Recent Development
Table 165. Camberley Rubber Mouldings Company Details
Table 166. Camberley Rubber Mouldings Business Overview
Table 167. Camberley Rubber Mouldings Rubber Molding Service Product
Table 168. Camberley Rubber Mouldings Revenue in Rubber Molding Service Business (US$ Million), 2021–2026
Table 169. Camberley Rubber Mouldings Recent Development
Table 170. Rubber Industries Company Details
Table 171. Rubber Industries Business Overview
Table 172. Rubber Industries Rubber Molding Service Product
Table 173. Rubber Industries Revenue in Rubber Molding Service Business (US$ Million), 2021–2026
Table 174. Rubber Industries Recent Development
Table 175. Custom Rubber Corp. Company Details
Table 176. Custom Rubber Corp. Business Overview
Table 177. Custom Rubber Corp. Rubber Molding Service Product
Table 178. Custom Rubber Corp. Revenue in Rubber Molding Service Business (US$ Million), 2021–2026
Table 179. Custom Rubber Corp. Recent Development
Table 180. The Rubber Group Company Details
Table 181. The Rubber Group Business Overview
Table 182. The Rubber Group Rubber Molding Service Product
Table 183. The Rubber Group Revenue in Rubber Molding Service Business (US$ Million), 2021–2026
Table 184. The Rubber Group Recent Development
Table 185. Stockwell Elastomerics Company Details
Table 186. Stockwell Elastomerics Business Overview
Table 187. Stockwell Elastomerics Rubber Molding Service Product
Table 188. Stockwell Elastomerics Revenue in Rubber Molding Service Business (US$ Million), 2021–2026
Table 189. Stockwell Elastomerics Recent Development
Table 190. Apple Rubber Products Company Details
Table 191. Apple Rubber Products Business Overview
Table 192. Apple Rubber Products Rubber Molding Service Product
Table 193. Apple Rubber Products Revenue in Rubber Molding Service Business (US$ Million), 2021–2026
Table 194. Apple Rubber Products Recent Development
Table 195. Minnesota Rubber & Plastics Company Details
Table 196. Minnesota Rubber & Plastics Business Overview
Table 197. Minnesota Rubber & Plastics Rubber Molding Service Product
Table 198. Minnesota Rubber & Plastics Revenue in Rubber Molding Service Business (US$ Million), 2021–2026
Table 199. Minnesota Rubber & Plastics Recent Development
Table 200. RD Rubber Technology Corporation Company Details
Table 201. RD Rubber Technology Corporation Business Overview
Table 202. RD Rubber Technology Corporation Rubber Molding Service Product
Table 203. RD Rubber Technology Corporation Revenue in Rubber Molding Service Business (US$ Million), 2021–2026
Table 204. RD Rubber Technology Corporation Recent Development
Table 205. REDCO Rubber Engineering & Development Company Company Details
Table 206. REDCO Rubber Engineering & Development Company Business Overview
Table 207. REDCO Rubber Engineering & Development Company Rubber Molding Service Product
Table 208. REDCO Rubber Engineering & Development Company Revenue in Rubber Molding Service Business (US$ Million), 2021–2026
Table 209. REDCO Rubber Engineering & Development Company Recent Development
Table 210. Accurate Products Company Details
Table 211. Accurate Products Business Overview
Table 212. Accurate Products Rubber Molding Service Product
Table 213. Accurate Products Revenue in Rubber Molding Service Business (US$ Million), 2021–2026
Table 214. Accurate Products Recent Development
Table 215. Pierce-Roberts Rubber Company Details
Table 216. Pierce-Roberts Rubber Business Overview
Table 217. Pierce-Roberts Rubber Rubber Molding Service Product
Table 218. Pierce-Roberts Rubber Revenue in Rubber Molding Service Business (US$ Million), 2021–2026
Table 219. Pierce-Roberts Rubber Recent Development
Table 220. Britech Industries Company Details
Table 221. Britech Industries Business Overview
Table 222. Britech Industries Rubber Molding Service Product
Table 223. Britech Industries Revenue in Rubber Molding Service Business (US$ Million), 2021–2026
Table 224. Britech Industries Recent Development
Table 225. Lake Erie Rubber & Manufacturing Company Details
Table 226. Lake Erie Rubber & Manufacturing Business Overview
Table 227. Lake Erie Rubber & Manufacturing Rubber Molding Service Product
Table 228. Lake Erie Rubber & Manufacturing Revenue in Rubber Molding Service Business (US$ Million), 2021–2026
Table 229. Lake Erie Rubber & Manufacturing Recent Development
Table 230. Mason Rubber Company Details
Table 231. Mason Rubber Business Overview
Table 232. Mason Rubber Rubber Molding Service Product
Table 233. Mason Rubber Revenue in Rubber Molding Service Business (US$ Million), 2021–2026
Table 234. Mason Rubber Recent Development
Table 235. Jet Rubber Company Company Details
Table 236. Jet Rubber Company Business Overview
Table 237. Jet Rubber Company Rubber Molding Service Product
Table 238. Jet Rubber Company Revenue in Rubber Molding Service Business (US$ Million), 2021–2026
Table 239. Jet Rubber Company Recent Development
Table 240. National Rubber Corp Company Details
Table 241. National Rubber Corp Business Overview
Table 242. National Rubber Corp Rubber Molding Service Product
Table 243. National Rubber Corp Revenue in Rubber Molding Service Business (US$ Million), 2021–2026
Table 244. National Rubber Corp Recent Development
Table 245. Polymax Company Details
Table 246. Polymax Business Overview
Table 247. Polymax Rubber Molding Service Product
Table 248. Polymax Revenue in Rubber Molding Service Business (US$ Million), 2021–2026
Table 249. Polymax Recent Development
Table 250. Wye Valley Precision Engineering Company Details
Table 251. Wye Valley Precision Engineering Business Overview
Table 252. Wye Valley Precision Engineering Rubber Molding Service Product
Table 253. Wye Valley Precision Engineering Revenue in Rubber Molding Service Business (US$ Million), 2021–2026
Table 254. Wye Valley Precision Engineering Recent Development
Table 255. MeadeX Company Details
Table 256. MeadeX Business Overview
Table 257. MeadeX Rubber Molding Service Product
Table 258. MeadeX Revenue in Rubber Molding Service Business (US$ Million), 2021–2026
Table 259. MeadeX Recent Development
Table 260. Research Programs/Design for This Report
Table 261. Key Data Information from Secondary Sources
Table 262. Key Data Information from Primary Sources
Table 263. Authors List of This Report
List of Figures
Figure 1. Rubber Molding Service Picture
Figure 2. Global Rubber Molding Service Market Size Comparison by Type (US$ Million), 2021–2032
Figure 3. Global Rubber Molding Service Market Share by Type: 2025 vs 2032
Figure 4. Compression Molding of Rubber Features
Figure 5. Injection Molding of Rubber Features
Figure 6. Extrusion Molding of Rubber Features
Figure 7. Casting Molding of Rubber Features
Figure 8. Other Features
Figure 9. Global Rubber Molding Service Market Size Comparison by Applicable Rubber (US$ Million), 2021–2032
Figure 10. General Rubber Features
Figure 11. Specialty Rubber Features
Figure 12. Foamed Rubber Features
Figure 13. Liquid Rubber Features
Figure 14. Global Rubber Molding Service Market Size Comparison by Service Content (US$ Million), 2021–2032
Figure 15. Full-Process Customized Molding Services Features
Figure 16. Mass Production Molding Services Features
Figure 17. Sample Prototyping Molding Services Features
Figure 18. Mold + Molding Integrated Services Features
Figure 19. Post-Processing Molding Services Features
Figure 20. Global Rubber Molding Service Market Size by Application (US$ Million), 2021–2032
Figure 21. Global Rubber Molding Service Market Share by Application: 2025 vs 2032
Figure 22. Automotive Case Studies
Figure 23. Industrial Manufacturing Case Studies
Figure 24. Medical Case Studies
Figure 25. Electronics Case Studies
Figure 26. Food Case Studies
Figure 27. Others Case Studies
Figure 28. Rubber Molding Service Report Years Considered
Figure 29. Global Rubber Molding Service Market Size (US$ Million), Year-over-Year: 2021–2032
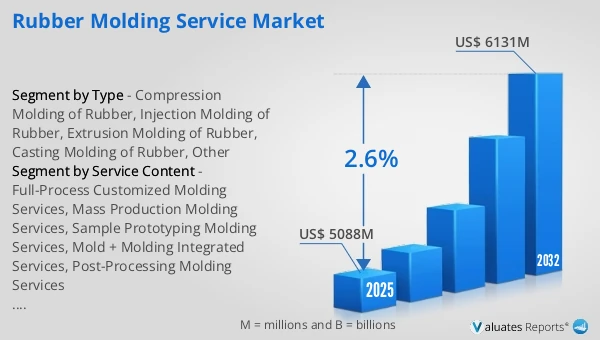
Figure 30. Global Rubber Molding Service Market Size, (US$ Million), 2021 vs 2025 vs 2032
Figure 31. Global Rubber Molding Service Market Share by Region: 2025 vs 2032
Figure 32. Global Rubber Molding Service Market Share by Players in 2025
Figure 33. Global Rubber Molding Service Market Share by Company Type (Tier 1, Tier 2, and Tier 3)
Figure 34. The Top 10 and 5 Players Market Share by Rubber Molding Service Revenue in 2025
Figure 35. North America Rubber Molding Service Market Size YoY Growth (US$ Million), 2021–2032
Figure 36. North America Rubber Molding Service Market Share by Country (2021–2032)
Figure 37. United States Rubber Molding Service Market Size YoY Growth (US$ Million), 2021–2032
Figure 38. Canada Rubber Molding Service Market Size YoY Growth (US$ Million), 2021–2032
Figure 39. Europe Rubber Molding Service Market Size YoY Growth (US$ Million), 2021–2032
Figure 40. Europe Rubber Molding Service Market Share by Country (2021–2032)
Figure 41. Germany Rubber Molding Service Market Size YoY Growth (US$ Million), 2021–2032
Figure 42. France Rubber Molding Service Market Size YoY Growth (US$ Million), 2021–2032
Figure 43. U.K. Rubber Molding Service Market Size YoY Growth (US$ Million), 2021–2032
Figure 44. Italy Rubber Molding Service Market Size YoY Growth (US$ Million), 2021–2032
Figure 45. Russia Rubber Molding Service Market Size YoY Growth (US$ Million), 2021–2032
Figure 46. Ireland Rubber Molding Service Market Size YoY Growth (US$ Million), 2021–2032
Figure 47. Asia-Pacific Rubber Molding Service Market Size YoY Growth (US$ Million), 2021–2032
Figure 48. Asia-Pacific Rubber Molding Service Market Share by Region (2021–2032)
Figure 49. China Rubber Molding Service Market Size YoY Growth (US$ Million), 2021–2032
Figure 50. Japan Rubber Molding Service Market Size YoY Growth (US$ Million), 2021–2032
Figure 51. South Korea Rubber Molding Service Market Size YoY Growth (US$ Million), 2021–2032
Figure 52. Southeast Asia Rubber Molding Service Market Size YoY Growth (US$ Million), 2021–2032
Figure 53. India Rubber Molding Service Market Size YoY Growth (US$ Million), 2021–2032
Figure 54. Australia & New Zealand Rubber Molding Service Market Size YoY Growth (US$ Million), 2021–2032
Figure 55. Latin America Rubber Molding Service Market Size YoY Growth (US$ Million), 2021–2032
Figure 56. Latin America Rubber Molding Service Market Share by Country (2021–2032)
Figure 57. Mexico Rubber Molding Service Market Size YoY Growth (US$ Million), 2021–2032
Figure 58. Brazil Rubber Molding Service Market Size YoY Growth (US$ Million), 2021–2032
Figure 59. Middle East & Africa Rubber Molding Service Market Size YoY Growth (US$ Million), 2021–2032
Figure 60. Middle East & Africa Rubber Molding Service Market Share by Country (2021–2032)
Figure 61. Israel Rubber Molding Service Market Size YoY Growth (US$ Million), 2021–2032
Figure 62. Saudi Arabia Rubber Molding Service Market Size YoY Growth (US$ Million), 2021–2032
Figure 63. UAE Rubber Molding Service Market Size YoY Growth (US$ Million), 2021–2032
Figure 64. Trelleborg Revenue Growth Rate in Rubber Molding Service Business (2021–2026)
Figure 65. Freudenberg Sealing Technologies Revenue Growth Rate in Rubber Molding Service Business (2021–2026)
Figure 66. Hutchinson Revenue Growth Rate in Rubber Molding Service Business (2021–2026)
Figure 67. Continental Revenue Growth Rate in Rubber Molding Service Business (2021–2026)
Figure 68. Datwyler Revenue Growth Rate in Rubber Molding Service Business (2021–2026)
Figure 69. Parker Hannifin Revenue Growth Rate in Rubber Molding Service Business (2021–2026)
Figure 70. Cooper Standard Revenue Growth Rate in Rubber Molding Service Business (2021–2026)
Figure 71. Sumitomo Riko Revenue Growth Rate in Rubber Molding Service Business (2021–2026)
Figure 72. Toyoda Gosei Revenue Growth Rate in Rubber Molding Service Business (2021–2026)
Figure 73. NOK Revenue Growth Rate in Rubber Molding Service Business (2021–2026)
Figure 74. Anhui Zhongding Holding Group Revenue Growth Rate in Rubber Molding Service Business (2021–2026)
Figure 75. Greene Tweed Revenue Growth Rate in Rubber Molding Service Business (2021–2026)
Figure 76. James Walker Revenue Growth Rate in Rubber Molding Service Business (2021–2026)
Figure 77. Precision Polymer Engineering Revenue Growth Rate in Rubber Molding Service Business (2021–2026)
Figure 78. RICO Elastomere Projecting Revenue Growth Rate in Rubber Molding Service Business (2021–2026)
Figure 79. Nishikawa Rubber Revenue Growth Rate in Rubber Molding Service Business (2021–2026)
Figure 80. Sumitomo Rubber Industries Revenue Growth Rate in Rubber Molding Service Business (2021–2026)
Figure 81. Yokohama Industries Americas Ohio Revenue Growth Rate in Rubber Molding Service Business (2021–2026)
Figure 82. Protolabs Revenue Growth Rate in Rubber Molding Service Business (2021–2026)
Figure 83. Borflex Group Revenue Growth Rate in Rubber Molding Service Business (2021–2026)
Figure 84. EXSTO Revenue Growth Rate in Rubber Molding Service Business (2021–2026)
Figure 85. Camberley Rubber Mouldings Revenue Growth Rate in Rubber Molding Service Business (2021–2026)
Figure 86. Rubber Industries Revenue Growth Rate in Rubber Molding Service Business (2021–2026)
Figure 87. Custom Rubber Corp. Revenue Growth Rate in Rubber Molding Service Business (2021–2026)
Figure 88. The Rubber Group Revenue Growth Rate in Rubber Molding Service Business (2021–2026)
Figure 89. Stockwell Elastomerics Revenue Growth Rate in Rubber Molding Service Business (2021–2026)
Figure 90. Apple Rubber Products Revenue Growth Rate in Rubber Molding Service Business (2021–2026)
Figure 91. Minnesota Rubber & Plastics Revenue Growth Rate in Rubber Molding Service Business (2021–2026)
Figure 92. RD Rubber Technology Corporation Revenue Growth Rate in Rubber Molding Service Business (2021–2026)
Figure 93. REDCO Rubber Engineering & Development Company Revenue Growth Rate in Rubber Molding Service Business (2021–2026)
Figure 94. Accurate Products Revenue Growth Rate in Rubber Molding Service Business (2021–2026)
Figure 95. Pierce-Roberts Rubber Revenue Growth Rate in Rubber Molding Service Business (2021–2026)
Figure 96. Britech Industries Revenue Growth Rate in Rubber Molding Service Business (2021–2026)
Figure 97. Lake Erie Rubber & Manufacturing Revenue Growth Rate in Rubber Molding Service Business (2021–2026)
Figure 98. Mason Rubber Revenue Growth Rate in Rubber Molding Service Business (2021–2026)
Figure 99. Jet Rubber Company Revenue Growth Rate in Rubber Molding Service Business (2021–2026)
Figure 100. National Rubber Corp Revenue Growth Rate in Rubber Molding Service Business (2021–2026)
Figure 101. Polymax Revenue Growth Rate in Rubber Molding Service Business (2021–2026)
Figure 102. Wye Valley Precision Engineering Revenue Growth Rate in Rubber Molding Service Business (2021–2026)
Figure 103. MeadeX Revenue Growth Rate in Rubber Molding Service Business (2021–2026)
Figure 104. Bottom-up and Top-down Approaches for This Report
Figure 105. Data Triangulation
Figure 106. Key Executives Interviewed