List of Tables
Table 1. Global Puncture-Proof Tire System Market Value by Type, (US$ Million) & (2023 VS 2030)
Table 2. Global Puncture-Proof Tire System Market Value by Application, (US$ Million) & (2023 VS 2030)
Table 3. Global Puncture-Proof Tire System Production Capacity (Tons) by Manufacturers in 2023
Table 4. Global Puncture-Proof Tire System Production by Manufacturers (2019-2024) & (Tons)
Table 5. Global Puncture-Proof Tire System Production Market Share by Manufacturers (2019-2024)
Table 6. Global Puncture-Proof Tire System Production Value by Manufacturers (2019-2024) & (US$ Million)
Table 7. Global Puncture-Proof Tire System Production Value Share by Manufacturers (2019-2024)
Table 8. Global Puncture-Proof Tire System Industry Ranking 2022 VS 2023 VS 2024
Table 9. Company Type (Tier 1, Tier 2 and Tier 3) & (based on the Revenue in Puncture-Proof Tire System as of 2023)
Table 10. Global Market Puncture-Proof Tire System Average Price by Manufacturers (US$/Ton) & (2019-2024)
Table 11. Manufacturers Puncture-Proof Tire System Production Sites and Area Served
Table 12. Manufacturers Puncture-Proof Tire System Product Types
Table 13. Global Puncture-Proof Tire System Manufacturers Market Concentration Ratio (CR5 and HHI)
Table 14. Mergers & Acquisitions, Expansion
Table 15. Global Puncture-Proof Tire System Production Value by Region: 2019 VS 2023 VS 2030 (US$ Million)
Table 16. Global Puncture-Proof Tire System Production Value (US$ Million) by Region (2019-2024)
Table 17. Global Puncture-Proof Tire System Production Value Market Share by Region (2019-2024)
Table 18. Global Puncture-Proof Tire System Production Value (US$ Million) Forecast by Region (2025-2030)
Table 19. Global Puncture-Proof Tire System Production Value Market Share Forecast by Region (2025-2030)
Table 20. Global Puncture-Proof Tire System Production Comparison by Region: 2019 VS 2023 VS 2030 (Tons)
Table 21. Global Puncture-Proof Tire System Production (Tons) by Region (2019-2024)
Table 22. Global Puncture-Proof Tire System Production Market Share by Region (2019-2024)
Table 23. Global Puncture-Proof Tire System Production (Tons) Forecast by Region (2025-2030)
Table 24. Global Puncture-Proof Tire System Production Market Share Forecast by Region (2025-2030)
Table 25. Global Puncture-Proof Tire System Market Average Price (US$/Ton) by Region (2019-2024)
Table 26. Global Puncture-Proof Tire System Market Average Price (US$/Ton) by Region (2025-2030)
Table 27. Global Puncture-Proof Tire System Consumption Growth Rate by Region: 2019 VS 2023 VS 2030 (Tons)
Table 28. Global Puncture-Proof Tire System Consumption by Region (2019-2024) & (Tons)
Table 29. Global Puncture-Proof Tire System Consumption Market Share by Region (2019-2024)
Table 30. Global Puncture-Proof Tire System Forecasted Consumption by Region (2025-2030) & (Tons)
Table 31. Global Puncture-Proof Tire System Forecasted Consumption Market Share by Region (2019-2024)
Table 32. North America Puncture-Proof Tire System Consumption Growth Rate by Country: 2019 VS 2023 VS 2030 (Tons)
Table 33. North America Puncture-Proof Tire System Consumption by Country (2019-2024) & (Tons)
Table 34. North America Puncture-Proof Tire System Consumption by Country (2025-2030) & (Tons)
Table 35. Europe Puncture-Proof Tire System Consumption Growth Rate by Country: 2019 VS 2023 VS 2030 (Tons)
Table 36. Europe Puncture-Proof Tire System Consumption by Country (2019-2024) & (Tons)
Table 37. Europe Puncture-Proof Tire System Consumption by Country (2025-2030) & (Tons)
Table 38. Asia Pacific Puncture-Proof Tire System Consumption Growth Rate by Region: 2019 VS 2023 VS 2030 (Tons)
Table 39. Asia Pacific Puncture-Proof Tire System Consumption by Region (2019-2024) & (Tons)
Table 40. Asia Pacific Puncture-Proof Tire System Consumption by Region (2025-2030) & (Tons)
Table 41. Latin America, Middle East & Africa Puncture-Proof Tire System Consumption Growth Rate by Country: 2019 VS 2023 VS 2030 (Tons)
Table 42. Latin America, Middle East & Africa Puncture-Proof Tire System Consumption by Country (2019-2024) & (Tons)
Table 43. Latin America, Middle East & Africa Puncture-Proof Tire System Consumption by Country (2025-2030) & (Tons)
Table 44. Global Puncture-Proof Tire System Production (Tons) by Type (2019-2024)
Table 45. Global Puncture-Proof Tire System Production (Tons) by Type (2025-2030)
Table 46. Global Puncture-Proof Tire System Production Market Share by Type (2019-2024)
Table 47. Global Puncture-Proof Tire System Production Market Share by Type (2025-2030)
Table 48. Global Puncture-Proof Tire System Production Value (US$ Million) by Type (2019-2024)
Table 49. Global Puncture-Proof Tire System Production Value (US$ Million) by Type (2025-2030)
Table 50. Global Puncture-Proof Tire System Production Value Share by Type (2019-2024)
Table 51. Global Puncture-Proof Tire System Production Value Share by Type (2025-2030)
Table 52. Global Puncture-Proof Tire System Price (US$/Ton) by Type (2019-2024)
Table 53. Global Puncture-Proof Tire System Price (US$/Ton) by Type (2025-2030)
Table 54. Global Puncture-Proof Tire System Production (Tons) by Application (2019-2024)
Table 55. Global Puncture-Proof Tire System Production (Tons) by Application (2025-2030)
Table 56. Global Puncture-Proof Tire System Production Market Share by Application (2019-2024)
Table 57. Global Puncture-Proof Tire System Production Market Share by Application (2025-2030)
Table 58. Global Puncture-Proof Tire System Production Value (US$ Million) by Application (2019-2024)
Table 59. Global Puncture-Proof Tire System Production Value (US$ Million) by Application (2025-2030)
Table 60. Global Puncture-Proof Tire System Production Value Share by Application (2019-2024)
Table 61. Global Puncture-Proof Tire System Production Value Share by Application (2025-2030)
Table 62. Global Puncture-Proof Tire System Price (US$/Ton) by Application (2019-2024)
Table 63. Global Puncture-Proof Tire System Price (US$/Ton) by Application (2025-2030)
Table 64. Bridgestone Puncture-Proof Tire System Corporation Information
Table 65. Bridgestone Specification and Application
Table 66. Bridgestone Puncture-Proof Tire System Production (Tons), Value (US$ Million), Price (US$/Ton) and Gross Margin (2019-2024)
Table 67. Bridgestone Main Business and Markets Served
Table 68. Bridgestone Recent Developments/Updates
Table 69. Goodyear Tire and Rubber Company Puncture-Proof Tire System Corporation Information
Table 70. Goodyear Tire and Rubber Company Specification and Application
Table 71. Goodyear Tire and Rubber Company Puncture-Proof Tire System Production (Tons), Value (US$ Million), Price (US$/Ton) and Gross Margin (2019-2024)
Table 72. Goodyear Tire and Rubber Company Main Business and Markets Served
Table 73. Goodyear Tire and Rubber Company Recent Developments/Updates
Table 74. Michelin Inc. Puncture-Proof Tire System Corporation Information
Table 75. Michelin Inc. Specification and Application
Table 76. Michelin Inc. Puncture-Proof Tire System Production (Tons), Value (US$ Million), Price (US$/Ton) and Gross Margin (2019-2024)
Table 77. Michelin Inc. Main Business and Markets Served
Table 78. Michelin Inc. Recent Developments/Updates
Table 79. Hankook Tire Group Puncture-Proof Tire System Corporation Information
Table 80. Hankook Tire Group Specification and Application
Table 81. Hankook Tire Group Puncture-Proof Tire System Production (Tons), Value (US$ Million), Price (US$/Ton) and Gross Margin (2019-2024)
Table 82. Hankook Tire Group Main Business and Markets Served
Table 83. Hankook Tire Group Recent Developments/Updates
Table 84. Yokohama Tire Corp. Puncture-Proof Tire System Corporation Information
Table 85. Yokohama Tire Corp. Specification and Application
Table 86. Yokohama Tire Corp. Puncture-Proof Tire System Production (Tons), Value (US$ Million), Price (US$/Ton) and Gross Margin (2019-2024)
Table 87. Yokohama Tire Corp. Main Business and Markets Served
Table 88. Yokohama Tire Corp. Recent Developments/Updates
Table 89. Sumitomo Rubber Industries, Ltd. Puncture-Proof Tire System Corporation Information
Table 90. Sumitomo Rubber Industries, Ltd. Specification and Application
Table 91. Sumitomo Rubber Industries, Ltd. Puncture-Proof Tire System Production (Tons), Value (US$ Million), Price (US$/Ton) and Gross Margin (2019-2024)
Table 92. Sumitomo Rubber Industries, Ltd. Main Business and Markets Served
Table 93. Sumitomo Rubber Industries, Ltd. Recent Developments/Updates
Table 94. Crocodile Tyres Puncture-Proof Tire System Corporation Information
Table 95. Crocodile Tyres Specification and Application
Table 96. Crocodile Tyres Puncture-Proof Tire System Production (Tons), Value (US$ Million), Price (US$/Ton) and Gross Margin (2019-2024)
Table 97. Crocodile Tyres Main Business and Markets Served
Table 98. Crocodile Tyres Recent Developments/Updates
Table 99. Big Tyre Puncture-Proof Tire System Corporation Information
Table 100. Big Tyre Specification and Application
Table 101. Big Tyre Puncture-Proof Tire System Production (Tons), Value (US$ Million), Price (US$/Ton) and Gross Margin (2019-2024)
Table 102. Big Tyre Main Business and Markets Served
Table 103. Big Tyre Recent Developments/Updates
Table 104. Toyo Tire and Rubber Co. LTD. Puncture-Proof Tire System Corporation Information
Table 105. Toyo Tire and Rubber Co. LTD. Specification and Application
Table 106. Toyo Tire and Rubber Co. LTD. Puncture-Proof Tire System Production (Tons), Value (US$ Million), Price (US$/Ton) and Gross Margin (2019-2024)
Table 107. Toyo Tire and Rubber Co. LTD. Main Business and Markets Served
Table 108. Toyo Tire and Rubber Co. LTD. Recent Developments/Updates
Table 109. Continental AG Puncture-Proof Tire System Corporation Information
Table 110. Continental AG Specification and Application
Table 111. Continental AG Puncture-Proof Tire System Production (Tons), Value (US$ Million), Price (US$/Ton) and Gross Margin (2019-2024)
Table 112. Continental AG Main Business and Markets Served
Table 113. Continental AG Recent Developments/Updates
Table 114. SciTech Industries Puncture-Proof Tire System Corporation Information
Table 115. SciTech Industries Specification and Application
Table 116. SciTech Industries Puncture-Proof Tire System Production (Tons), Value (US$ Million), Price (US$/Ton) and Gross Margin (2019-2024)
Table 117. SciTech Industries Main Business and Markets Served
Table 118. SciTech Industries Recent Developments/Updates
Table 119. WUXI I-REACH TECONOLOGY CO.,LTD Puncture-Proof Tire System Corporation Information
Table 120. WUXI I-REACH TECONOLOGY CO.,LTD Specification and Application
Table 121. WUXI I-REACH TECONOLOGY CO.,LTD Puncture-Proof Tire System Production (Tons), Value (US$ Million), Price (US$/Ton) and Gross Margin (2019-2024)
Table 122. WUXI I-REACH TECONOLOGY CO.,LTD Main Business and Markets Served
Table 123. WUXI I-REACH TECONOLOGY CO.,LTD Recent Developments/Updates
Table 124. Key Raw Materials Lists
Table 125. Raw Materials Key Suppliers Lists
Table 126. Puncture-Proof Tire System Distributors List
Table 127. Puncture-Proof Tire System Customers List
Table 128. Puncture-Proof Tire System Market Trends
Table 129. Puncture-Proof Tire System Market Drivers
Table 130. Puncture-Proof Tire System Market Challenges
Table 131. Puncture-Proof Tire System Market Restraints
Table 132. Research Programs/Design for This Report
Table 133. Key Data Information from Secondary Sources
Table 134. Key Data Information from Primary Sources
List of Figures
Figure 1. Product Picture of Puncture-Proof Tire System
Figure 2. Global Puncture-Proof Tire System Market Value by Type, (US$ Million) & (2023 VS 2030)
Figure 3. Global Puncture-Proof Tire System Market Share by Type: 2023 VS 2030
Figure 4. Bias Tires Product Picture
Figure 5. Radial Tires Product Picture
Figure 6. Global Puncture-Proof Tire System Market Value by Application, (US$ Million) & (2023 VS 2030)
Figure 7. Global Puncture-Proof Tire System Market Share by Application: 2023 VS 2030
Figure 8. Two-Wheelers
Figure 9. Commercial Vehicles
Figure 10. Passenger Cars
Figure 11. Others
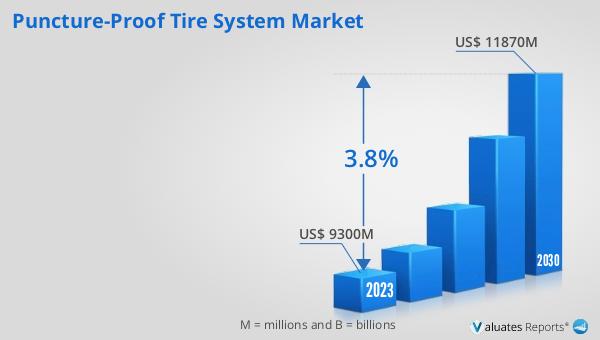
Figure 12. Global Puncture-Proof Tire System Production Value (US$ Million), 2019 VS 2023 VS 2030
Figure 13. Global Puncture-Proof Tire System Production Value (US$ Million) & (2019-2030)
Figure 14. Global Puncture-Proof Tire System Production Capacity (Tons) & (2019-2030)
Figure 15. Global Puncture-Proof Tire System Production (Tons) & (2019-2030)
Figure 16. Global Puncture-Proof Tire System Average Price (US$/Ton) & (2019-2030)
Figure 17. Puncture-Proof Tire System Report Years Considered
Figure 18. Puncture-Proof Tire System Production Share by Manufacturers in 2023
Figure 19. Puncture-Proof Tire System Market Share by Company Type (Tier 1, Tier 2, and Tier 3): 2019 VS 2023
Figure 20. The Global 5 and 10 Largest Players: Market Share by Puncture-Proof Tire System Revenue in 2023
Figure 21. Global Puncture-Proof Tire System Production Value by Region: 2019 VS 2023 VS 2030 (US$ Million)
Figure 22. Global Puncture-Proof Tire System Production Value Market Share by Region: 2019 VS 2023 VS 2030
Figure 23. Global Puncture-Proof Tire System Production Comparison by Region: 2019 VS 2023 VS 2030 (Tons)
Figure 24. Global Puncture-Proof Tire System Production Market Share by Region: 2019 VS 2023 VS 2030
Figure 25. North America Puncture-Proof Tire System Production Value (US$ Million) Growth Rate (2019-2030)
Figure 26. Europe Puncture-Proof Tire System Production Value (US$ Million) Growth Rate (2019-2030)
Figure 27. China Puncture-Proof Tire System Production Value (US$ Million) Growth Rate (2019-2030)
Figure 28. Japan Puncture-Proof Tire System Production Value (US$ Million) Growth Rate (2019-2030)
Figure 29. Global Puncture-Proof Tire System Consumption by Region: 2019 VS 2023 VS 2030 (Tons)
Figure 30. Global Puncture-Proof Tire System Consumption Market Share by Region: 2019 VS 2023 VS 2030
Figure 31. North America Puncture-Proof Tire System Consumption and Growth Rate (2019-2024) & (Tons)
Figure 32. North America Puncture-Proof Tire System Consumption Market Share by Country (2019-2030)
Figure 33. Canada Puncture-Proof Tire System Consumption and Growth Rate (2019-2024) & (Tons)
Figure 34. U.S. Puncture-Proof Tire System Consumption and Growth Rate (2019-2024) & (Tons)
Figure 35. Europe Puncture-Proof Tire System Consumption and Growth Rate (2019-2024) & (Tons)
Figure 36. Europe Puncture-Proof Tire System Consumption Market Share by Country (2019-2030)
Figure 37. Germany Puncture-Proof Tire System Consumption and Growth Rate (2019-2024) & (Tons)
Figure 38. France Puncture-Proof Tire System Consumption and Growth Rate (2019-2024) & (Tons)
Figure 39. U.K. Puncture-Proof Tire System Consumption and Growth Rate (2019-2024) & (Tons)
Figure 40. Italy Puncture-Proof Tire System Consumption and Growth Rate (2019-2024) & (Tons)
Figure 41. Russia Puncture-Proof Tire System Consumption and Growth Rate (2019-2024) & (Tons)
Figure 42. Asia Pacific Puncture-Proof Tire System Consumption and Growth Rate (2019-2024) & (Tons)
Figure 43. Asia Pacific Puncture-Proof Tire System Consumption Market Share by Regions (2019-2030)
Figure 44. China Puncture-Proof Tire System Consumption and Growth Rate (2019-2024) & (Tons)
Figure 45. Japan Puncture-Proof Tire System Consumption and Growth Rate (2019-2024) & (Tons)
Figure 46. South Korea Puncture-Proof Tire System Consumption and Growth Rate (2019-2024) & (Tons)
Figure 47. China Taiwan Puncture-Proof Tire System Consumption and Growth Rate (2019-2024) & (Tons)
Figure 48. Southeast Asia Puncture-Proof Tire System Consumption and Growth Rate (2019-2024) & (Tons)
Figure 49. India Puncture-Proof Tire System Consumption and Growth Rate (2019-2024) & (Tons)
Figure 50. Latin America, Middle East & Africa Puncture-Proof Tire System Consumption and Growth Rate (2019-2024) & (Tons)
Figure 51. Latin America, Middle East & Africa Puncture-Proof Tire System Consumption Market Share by Country (2019-2030)
Figure 52. Mexico Puncture-Proof Tire System Consumption and Growth Rate (2019-2024) & (Tons)
Figure 53. Brazil Puncture-Proof Tire System Consumption and Growth Rate (2019-2024) & (Tons)
Figure 54. Turkey Puncture-Proof Tire System Consumption and Growth Rate (2019-2024) & (Tons)
Figure 55. GCC Countries Puncture-Proof Tire System Consumption and Growth Rate (2019-2024) & (Tons)
Figure 56. Global Production Market Share of Puncture-Proof Tire System by Type (2019-2030)
Figure 57. Global Production Value Market Share of Puncture-Proof Tire System by Type (2019-2030)
Figure 58. Global Puncture-Proof Tire System Price (US$/Ton) by Type (2019-2030)
Figure 59. Global Production Market Share of Puncture-Proof Tire System by Application (2019-2030)
Figure 60. Global Production Value Market Share of Puncture-Proof Tire System by Application (2019-2030)
Figure 61. Global Puncture-Proof Tire System Price (US$/Ton) by Application (2019-2030)
Figure 62. Puncture-Proof Tire System Value Chain
Figure 63. Puncture-Proof Tire System Production Process
Figure 64. Channels of Distribution (Direct Vs Distribution)
Figure 65. Distributors Profiles
Figure 66. Bottom-up and Top-down Approaches for This Report
Figure 67. Data Triangulation