List of Tables
Table 1. Global Plant-based and Cultured Meat Market Value by Type, (US$ Million) & (2023 VS 2030)
Table 2. Global Plant-based and Cultured Meat Market Value by Application, (US$ Million) & (2023 VS 2030)
Table 3. Global Plant-based and Cultured Meat Production Capacity (Tons) by Manufacturers in 2023
Table 4. Global Plant-based and Cultured Meat Production by Manufacturers (2019-2024) & (Tons)
Table 5. Global Plant-based and Cultured Meat Production Market Share by Manufacturers (2019-2024)
Table 6. Global Plant-based and Cultured Meat Production Value by Manufacturers (2019-2024) & (US$ Million)
Table 7. Global Plant-based and Cultured Meat Production Value Share by Manufacturers (2019-2024)
Table 8. Global Plant-based and Cultured Meat Industry Ranking 2022 VS 2023 VS 2024
Table 9. Company Type (Tier 1, Tier 2 and Tier 3) & (based on the Revenue in Plant-based and Cultured Meat as of 2023)
Table 10. Global Market Plant-based and Cultured Meat Average Price by Manufacturers (US$/Ton) & (2019-2024)
Table 11. Manufacturers Plant-based and Cultured Meat Production Sites and Area Served
Table 12. Manufacturers Plant-based and Cultured Meat Product Types
Table 13. Global Plant-based and Cultured Meat Manufacturers Market Concentration Ratio (CR5 and HHI)
Table 14. Mergers & Acquisitions, Expansion
Table 15. Global Plant-based and Cultured Meat Production Value by Region: 2019 VS 2023 VS 2030 (US$ Million)
Table 16. Global Plant-based and Cultured Meat Production Value (US$ Million) by Region (2019-2024)
Table 17. Global Plant-based and Cultured Meat Production Value Market Share by Region (2019-2024)
Table 18. Global Plant-based and Cultured Meat Production Value (US$ Million) Forecast by Region (2025-2030)
Table 19. Global Plant-based and Cultured Meat Production Value Market Share Forecast by Region (2025-2030)
Table 20. Global Plant-based and Cultured Meat Production Comparison by Region: 2019 VS 2023 VS 2030 (Tons)
Table 21. Global Plant-based and Cultured Meat Production (Tons) by Region (2019-2024)
Table 22. Global Plant-based and Cultured Meat Production Market Share by Region (2019-2024)
Table 23. Global Plant-based and Cultured Meat Production (Tons) Forecast by Region (2025-2030)
Table 24. Global Plant-based and Cultured Meat Production Market Share Forecast by Region (2025-2030)
Table 25. Global Plant-based and Cultured Meat Market Average Price (US$/Ton) by Region (2019-2024)
Table 26. Global Plant-based and Cultured Meat Market Average Price (US$/Ton) by Region (2025-2030)
Table 27. Global Plant-based and Cultured Meat Consumption Growth Rate by Region: 2019 VS 2023 VS 2030 (Tons)
Table 28. Global Plant-based and Cultured Meat Consumption by Region (2019-2024) & (Tons)
Table 29. Global Plant-based and Cultured Meat Consumption Market Share by Region (2019-2024)
Table 30. Global Plant-based and Cultured Meat Forecasted Consumption by Region (2025-2030) & (Tons)
Table 31. Global Plant-based and Cultured Meat Forecasted Consumption Market Share by Region (2019-2024)
Table 32. North America Plant-based and Cultured Meat Consumption Growth Rate by Country: 2019 VS 2023 VS 2030 (Tons)
Table 33. North America Plant-based and Cultured Meat Consumption by Country (2019-2024) & (Tons)
Table 34. North America Plant-based and Cultured Meat Consumption by Country (2025-2030) & (Tons)
Table 35. Europe Plant-based and Cultured Meat Consumption Growth Rate by Country: 2019 VS 2023 VS 2030 (Tons)
Table 36. Europe Plant-based and Cultured Meat Consumption by Country (2019-2024) & (Tons)
Table 37. Europe Plant-based and Cultured Meat Consumption by Country (2025-2030) & (Tons)
Table 38. Asia Pacific Plant-based and Cultured Meat Consumption Growth Rate by Region: 2019 VS 2023 VS 2030 (Tons)
Table 39. Asia Pacific Plant-based and Cultured Meat Consumption by Region (2019-2024) & (Tons)
Table 40. Asia Pacific Plant-based and Cultured Meat Consumption by Region (2025-2030) & (Tons)
Table 41. Latin America, Middle East & Africa Plant-based and Cultured Meat Consumption Growth Rate by Country: 2019 VS 2023 VS 2030 (Tons)
Table 42. Latin America, Middle East & Africa Plant-based and Cultured Meat Consumption by Country (2019-2024) & (Tons)
Table 43. Latin America, Middle East & Africa Plant-based and Cultured Meat Consumption by Country (2025-2030) & (Tons)
Table 44. Global Plant-based and Cultured Meat Production (Tons) by Type (2019-2024)
Table 45. Global Plant-based and Cultured Meat Production (Tons) by Type (2025-2030)
Table 46. Global Plant-based and Cultured Meat Production Market Share by Type (2019-2024)
Table 47. Global Plant-based and Cultured Meat Production Market Share by Type (2025-2030)
Table 48. Global Plant-based and Cultured Meat Production Value (US$ Million) by Type (2019-2024)
Table 49. Global Plant-based and Cultured Meat Production Value (US$ Million) by Type (2025-2030)
Table 50. Global Plant-based and Cultured Meat Production Value Share by Type (2019-2024)
Table 51. Global Plant-based and Cultured Meat Production Value Share by Type (2025-2030)
Table 52. Global Plant-based and Cultured Meat Price (US$/Ton) by Type (2019-2024)
Table 53. Global Plant-based and Cultured Meat Price (US$/Ton) by Type (2025-2030)
Table 54. Global Plant-based and Cultured Meat Production (Tons) by Application (2019-2024)
Table 55. Global Plant-based and Cultured Meat Production (Tons) by Application (2025-2030)
Table 56. Global Plant-based and Cultured Meat Production Market Share by Application (2019-2024)
Table 57. Global Plant-based and Cultured Meat Production Market Share by Application (2025-2030)
Table 58. Global Plant-based and Cultured Meat Production Value (US$ Million) by Application (2019-2024)
Table 59. Global Plant-based and Cultured Meat Production Value (US$ Million) by Application (2025-2030)
Table 60. Global Plant-based and Cultured Meat Production Value Share by Application (2019-2024)
Table 61. Global Plant-based and Cultured Meat Production Value Share by Application (2025-2030)
Table 62. Global Plant-based and Cultured Meat Price (US$/Ton) by Application (2019-2024)
Table 63. Global Plant-based and Cultured Meat Price (US$/Ton) by Application (2025-2030)
Table 64. Kellogg Plant-based and Cultured Meat Corporation Information
Table 65. Kellogg Specification and Application
Table 66. Kellogg Plant-based and Cultured Meat Production (Tons), Value (US$ Million), Price (US$/Ton) and Gross Margin (2019-2024)
Table 67. Kellogg Main Business and Markets Served
Table 68. Kellogg Recent Developments/Updates
Table 69. Hormel Plant-based and Cultured Meat Corporation Information
Table 70. Hormel Specification and Application
Table 71. Hormel Plant-based and Cultured Meat Production (Tons), Value (US$ Million), Price (US$/Ton) and Gross Margin (2019-2024)
Table 72. Hormel Main Business and Markets Served
Table 73. Hormel Recent Developments/Updates
Table 74. Smithfield Foods (WH Group) Plant-based and Cultured Meat Corporation Information
Table 75. Smithfield Foods (WH Group) Specification and Application
Table 76. Smithfield Foods (WH Group) Plant-based and Cultured Meat Production (Tons), Value (US$ Million), Price (US$/Ton) and Gross Margin (2019-2024)
Table 77. Smithfield Foods (WH Group) Main Business and Markets Served
Table 78. Smithfield Foods (WH Group) Recent Developments/Updates
Table 79. Beyond Meat Plant-based and Cultured Meat Corporation Information
Table 80. Beyond Meat Specification and Application
Table 81. Beyond Meat Plant-based and Cultured Meat Production (Tons), Value (US$ Million), Price (US$/Ton) and Gross Margin (2019-2024)
Table 82. Beyond Meat Main Business and Markets Served
Table 83. Beyond Meat Recent Developments/Updates
Table 84. Impossible Foods Plant-based and Cultured Meat Corporation Information
Table 85. Impossible Foods Specification and Application
Table 86. Impossible Foods Plant-based and Cultured Meat Production (Tons), Value (US$ Million), Price (US$/Ton) and Gross Margin (2019-2024)
Table 87. Impossible Foods Main Business and Markets Served
Table 88. Impossible Foods Recent Developments/Updates
Table 89. Cargill Plant-based and Cultured Meat Corporation Information
Table 90. Cargill Specification and Application
Table 91. Cargill Plant-based and Cultured Meat Production (Tons), Value (US$ Million), Price (US$/Ton) and Gross Margin (2019-2024)
Table 92. Cargill Main Business and Markets Served
Table 93. Cargill Recent Developments/Updates
Table 94. Maple Leaf Foods Plant-based and Cultured Meat Corporation Information
Table 95. Maple Leaf Foods Specification and Application
Table 96. Maple Leaf Foods Plant-based and Cultured Meat Production (Tons), Value (US$ Million), Price (US$/Ton) and Gross Margin (2019-2024)
Table 97. Maple Leaf Foods Main Business and Markets Served
Table 98. Maple Leaf Foods Recent Developments/Updates
Table 99. The Very Good Food Plant-based and Cultured Meat Corporation Information
Table 100. The Very Good Food Specification and Application
Table 101. The Very Good Food Plant-based and Cultured Meat Production (Tons), Value (US$ Million), Price (US$/Ton) and Gross Margin (2019-2024)
Table 102. The Very Good Food Main Business and Markets Served
Table 103. The Very Good Food Recent Developments/Updates
Table 104. Right Treat Plant-based and Cultured Meat Corporation Information
Table 105. Right Treat Specification and Application
Table 106. Right Treat Plant-based and Cultured Meat Production (Tons), Value (US$ Million), Price (US$/Ton) and Gross Margin (2019-2024)
Table 107. Right Treat Main Business and Markets Served
Table 108. Right Treat Recent Developments/Updates
Table 109. JUST Plant-based and Cultured Meat Corporation Information
Table 110. JUST Specification and Application
Table 111. JUST Plant-based and Cultured Meat Production (Tons), Value (US$ Million), Price (US$/Ton) and Gross Margin (2019-2024)
Table 112. JUST Main Business and Markets Served
Table 113. JUST Recent Developments/Updates
Table 114. Turtle Island Foods Plant-based and Cultured Meat Corporation Information
Table 115. Turtle Island Foods Specification and Application
Table 116. Turtle Island Foods Plant-based and Cultured Meat Production (Tons), Value (US$ Million), Price (US$/Ton) and Gross Margin (2019-2024)
Table 117. Turtle Island Foods Main Business and Markets Served
Table 118. Turtle Island Foods Recent Developments/Updates
Table 119. Plantible Foods Plant-based and Cultured Meat Corporation Information
Table 120. Plantible Foods Specification and Application
Table 121. Plantible Foods Plant-based and Cultured Meat Production (Tons), Value (US$ Million), Price (US$/Ton) and Gross Margin (2019-2024)
Table 122. Plantible Foods Main Business and Markets Served
Table 123. Plantible Foods Recent Developments/Updates
Table 124. Rebellyous Foods Plant-based and Cultured Meat Corporation Information
Table 125. Rebellyous Foods Specification and Application
Table 126. Rebellyous Foods Plant-based and Cultured Meat Production (Tons), Value (US$ Million), Price (US$/Ton) and Gross Margin (2019-2024)
Table 127. Rebellyous Foods Main Business and Markets Served
Table 128. Rebellyous Foods Recent Developments/Updates
Table 129. Livekindly Plant-based and Cultured Meat Corporation Information
Table 130. Livekindly Specification and Application
Table 131. Livekindly Plant-based and Cultured Meat Production (Tons), Value (US$ Million), Price (US$/Ton) and Gross Margin (2019-2024)
Table 132. Livekindly Main Business and Markets Served
Table 133. Livekindly Recent Developments/Updates
Table 134. Livekindly Plant-based and Cultured Meat Corporation Information
Table 135. InnovoPro Specification and Application
Table 136. InnovoPro Plant-based and Cultured Meat Production (Tons), Value (US$ Million), Price (US$/Ton) and Gross Margin (2019-2024)
Table 137. InnovoPro Main Business and Markets Served
Table 138. InnovoPro Recent Developments/Updates
Table 139. Tyson Plant-based and Cultured Meat Corporation Information
Table 140. Tyson Plant-based and Cultured Meat Production (Tons), Value (US$ Million), Price (US$/Ton) and Gross Margin (2019-2024)
Table 141. Tyson Main Business and Markets Served
Table 142. Tyson Recent Developments/Updates
Table 143. Shuang Ta Food Plant-based and Cultured Meat Corporation Information
Table 144. Shuang Ta Food Specification and Application
Table 145. Shuang Ta Food Plant-based and Cultured Meat Production (Tons), Value (US$ Million), Price (US$/Ton) and Gross Margin (2019-2024)
Table 146. Shuang Ta Food Main Business and Markets Served
Table 147. Shuang Ta Food Recent Developments/Updates
Table 148. Hai Xin Food Plant-based and Cultured Meat Corporation Information
Table 149. Hai Xin Food Specification and Application
Table 150. Hai Xin Food Plant-based and Cultured Meat Production (Tons), Value (US$ Million), Price (US$/Ton) and Gross Margin (2019-2024)
Table 151. Hai Xin Food Main Business and Markets Served
Table 152. Hai Xin Food Recent Developments/Updates
Table 153. Aleph Farms Plant-based and Cultured Meat Corporation Information
Table 154. Aleph Farms Specification and Application
Table 155. Aleph Farms Plant-based and Cultured Meat Production (Tons), Value (US$ Million), Price (US$/Ton) and Gross Margin (2019-2024)
Table 156. Aleph Farms Main Business and Markets Served
Table 157. Aleph Farms Recent Developments/Updates
Table 158. Avant Meats Company Limited Plant-based and Cultured Meat Corporation Information
Table 159. Avant Meats Company Limited Specification and Application
Table 160. Avant Meats Company Limited Plant-based and Cultured Meat Production (Tons), Value (US$ Million), Price (US$/Ton) and Gross Margin (2019-2024)
Table 161. Avant Meats Company Limited Main Business and Markets Served
Table 162. Avant Meats Company Limited Recent Developments/Updates
Table 163. Biftek INC Plant-based and Cultured Meat Corporation Information
Table 164. Biftek INC Specification and Application
Table 165. Biftek INC Plant-based and Cultured Meat Production (Tons), Value (US$ Million), Price (US$/Ton) and Gross Margin (2019-2024)
Table 166. Biftek INC Main Business and Markets Served
Table 167. Biftek INC Recent Developments/Updates
Table 168. Mosa Meat Plant-based and Cultured Meat Corporation Information
Table 169. Mosa Meat Specification and Application
Table 170. Mosa Meat Plant-based and Cultured Meat Production (Tons), Value (US$ Million), Price (US$/Ton) and Gross Margin (2019-2024)
Table 171. Mosa Meat Main Business and Markets Served
Table 172. Mosa Meat Recent Developments/Updates
Table 173. BlueNalu, Inc. Plant-based and Cultured Meat Corporation Information
Table 174. BlueNalu, Inc. Specification and Application
Table 175. BlueNalu, Inc. Plant-based and Cultured Meat Production (Tons), Value (US$ Million), Price (US$/Ton) and Gross Margin (2019-2024)
Table 176. BlueNalu, Inc. Main Business and Markets Served
Table 177. BlueNalu, Inc. Recent Developments/Updates
Table 178. BioFood Systems Ltd Plant-based and Cultured Meat Corporation Information
Table 179. BioFood Systems Ltd Specification and Application
Table 180. BioFood Systems Ltd Plant-based and Cultured Meat Production (Tons), Value (US$ Million), Price (US$/Ton) and Gross Margin (2019-2024)
Table 181. BioFood Systems Ltd Main Business and Markets Served
Table 182. BioFood Systems Ltd Recent Developments/Updates
Table 183. WildType Plant-based and Cultured Meat Corporation Information
Table 184. WildType Specification and Application
Table 185. WildType Plant-based and Cultured Meat Production (Tons), Value (US$ Million), Price (US$/Ton) and Gross Margin (2019-2024)
Table 186. WildType Main Business and Markets Served
Table 187. WildType Recent Developments/Updates
Table 188. New Age Eats Plant-based and Cultured Meat Corporation Information
Table 189. New Age Eats Specification and Application
Table 190. New Age Eats Plant-based and Cultured Meat Production (Tons), Value (US$ Million), Price (US$/Ton) and Gross Margin (2019-2024)
Table 191. New Age Eats Main Business and Markets Served
Table 192. New Age Eats Recent Developments/Updates
Table 193. Shiok Meats Pte Ltd Plant-based and Cultured Meat Corporation Information
Table 194. Shiok Meats Pte Ltd Specification and Application
Table 195. Shiok Meats Pte Ltd Plant-based and Cultured Meat Production (Tons), Value (US$ Million), Price (US$/Ton) and Gross Margin (2019-2024)
Table 196. Shiok Meats Pte Ltd Main Business and Markets Served
Table 197. Shiok Meats Pte Ltd Recent Developments/Updates
Table 198. SuperMeat Plant-based and Cultured Meat Corporation Information
Table 199. SuperMeat Specification and Application
Table 200. SuperMeat Plant-based and Cultured Meat Production (Tons), Value (US$ Million), Price (US$/Ton) and Gross Margin (2019-2024)
Table 201. SuperMeat Main Business and Markets Served
Table 202. SuperMeat Recent Developments/Updates
Table 203. Meatable Plant-based and Cultured Meat Corporation Information
Table 204. Meatable Specification and Application
Table 205. Meatable Plant-based and Cultured Meat Production (Tons), Value (US$ Million), Price (US$/Ton) and Gross Margin (2019-2024)
Table 206. Meatable Main Business and Markets Served
Table 207. Meatable Recent Developments/Updates
Table 208. Finless Foods, Inc Plant-based and Cultured Meat Corporation Information
Table 209. Finless Foods, Inc Specification and Application
Table 210. Finless Foods, Inc Plant-based and Cultured Meat Production (Tons), Value (US$ Million), Price (US$/Ton) and Gross Margin (2019-2024)
Table 211. Finless Foods, Inc Main Business and Markets Served
Table 212. Finless Foods, Inc Recent Developments/Updates
Table 213. Key Raw Materials Lists
Table 214. Raw Materials Key Suppliers Lists
Table 215. Plant-based and Cultured Meat Distributors List
Table 216. Plant-based and Cultured Meat Customers List
Table 217. Plant-based and Cultured Meat Market Trends
Table 218. Plant-based and Cultured Meat Market Drivers
Table 219. Plant-based and Cultured Meat Market Challenges
Table 220. Plant-based and Cultured Meat Market Restraints
Table 221. Research Programs/Design for This Report
Table 222. Key Data Information from Secondary Sources
Table 223. Key Data Information from Primary Sources
List of Figures
Figure 1. Product Picture of Plant-based and Cultured Meat
Figure 2. Global Plant-based and Cultured Meat Market Value by Type, (US$ Million) & (2023 VS 2030)
Figure 3. Global Plant-based and Cultured Meat Market Share by Type: 2023 VS 2030
Figure 4. Soy Protein Type Product Picture
Figure 5. Peanut Protein Type Product Picture
Figure 6. Others Product Picture
Figure 7. Global Plant-based and Cultured Meat Market Value by Application, (US$ Million) & (2023 VS 2030)
Figure 8. Global Plant-based and Cultured Meat Market Share by Application: 2023 VS 2030
Figure 9. Human Food
Figure 10. Feed Addictive
Figure 11. Others
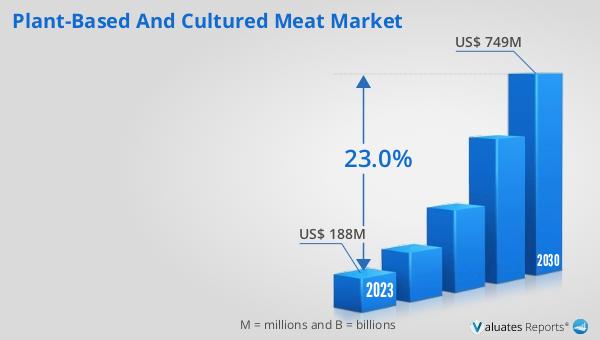
Figure 12. Global Plant-based and Cultured Meat Production Value (US$ Million), 2019 VS 2023 VS 2030
Figure 13. Global Plant-based and Cultured Meat Production Value (US$ Million) & (2019-2030)
Figure 14. Global Plant-based and Cultured Meat Production Capacity (Tons) & (2019-2030)
Figure 15. Global Plant-based and Cultured Meat Production (Tons) & (2019-2030)
Figure 16. Global Plant-based and Cultured Meat Average Price (US$/Ton) & (2019-2030)
Figure 17. Plant-based and Cultured Meat Report Years Considered
Figure 18. Plant-based and Cultured Meat Production Share by Manufacturers in 2023
Figure 19. Plant-based and Cultured Meat Market Share by Company Type (Tier 1, Tier 2, and Tier 3): 2019 VS 2023
Figure 20. The Global 5 and 10 Largest Players: Market Share by Plant-based and Cultured Meat Revenue in 2023
Figure 21. Global Plant-based and Cultured Meat Production Value by Region: 2019 VS 2023 VS 2030 (US$ Million)
Figure 22. Global Plant-based and Cultured Meat Production Value Market Share by Region: 2019 VS 2023 VS 2030
Figure 23. Global Plant-based and Cultured Meat Production Comparison by Region: 2019 VS 2023 VS 2030 (Tons)
Figure 24. Global Plant-based and Cultured Meat Production Market Share by Region: 2019 VS 2023 VS 2030
Figure 25. North America Plant-based and Cultured Meat Production Value (US$ Million) Growth Rate (2019-2030)
Figure 26. Europe Plant-based and Cultured Meat Production Value (US$ Million) Growth Rate (2019-2030)
Figure 27. China Plant-based and Cultured Meat Production Value (US$ Million) Growth Rate (2019-2030)
Figure 28. Japan Plant-based and Cultured Meat Production Value (US$ Million) Growth Rate (2019-2030)
Figure 29. Global Plant-based and Cultured Meat Consumption by Region: 2019 VS 2023 VS 2030 (Tons)
Figure 30. Global Plant-based and Cultured Meat Consumption Market Share by Region: 2019 VS 2023 VS 2030
Figure 31. North America Plant-based and Cultured Meat Consumption and Growth Rate (2019-2024) & (Tons)
Figure 32. North America Plant-based and Cultured Meat Consumption Market Share by Country (2019-2030)
Figure 33. Canada Plant-based and Cultured Meat Consumption and Growth Rate (2019-2024) & (Tons)
Figure 34. U.S. Plant-based and Cultured Meat Consumption and Growth Rate (2019-2024) & (Tons)
Figure 35. Europe Plant-based and Cultured Meat Consumption and Growth Rate (2019-2024) & (Tons)
Figure 36. Europe Plant-based and Cultured Meat Consumption Market Share by Country (2019-2030)
Figure 37. Germany Plant-based and Cultured Meat Consumption and Growth Rate (2019-2024) & (Tons)
Figure 38. France Plant-based and Cultured Meat Consumption and Growth Rate (2019-2024) & (Tons)
Figure 39. U.K. Plant-based and Cultured Meat Consumption and Growth Rate (2019-2024) & (Tons)
Figure 40. Italy Plant-based and Cultured Meat Consumption and Growth Rate (2019-2024) & (Tons)
Figure 41. Russia Plant-based and Cultured Meat Consumption and Growth Rate (2019-2024) & (Tons)
Figure 42. Asia Pacific Plant-based and Cultured Meat Consumption and Growth Rate (2019-2024) & (Tons)
Figure 43. Asia Pacific Plant-based and Cultured Meat Consumption Market Share by Regions (2019-2030)
Figure 44. China Plant-based and Cultured Meat Consumption and Growth Rate (2019-2024) & (Tons)
Figure 45. Japan Plant-based and Cultured Meat Consumption and Growth Rate (2019-2024) & (Tons)
Figure 46. South Korea Plant-based and Cultured Meat Consumption and Growth Rate (2019-2024) & (Tons)
Figure 47. China Taiwan Plant-based and Cultured Meat Consumption and Growth Rate (2019-2024) & (Tons)
Figure 48. Southeast Asia Plant-based and Cultured Meat Consumption and Growth Rate (2019-2024) & (Tons)
Figure 49. India Plant-based and Cultured Meat Consumption and Growth Rate (2019-2024) & (Tons)
Figure 50. Latin America, Middle East & Africa Plant-based and Cultured Meat Consumption and Growth Rate (2019-2024) & (Tons)
Figure 51. Latin America, Middle East & Africa Plant-based and Cultured Meat Consumption Market Share by Country (2019-2030)
Figure 52. Mexico Plant-based and Cultured Meat Consumption and Growth Rate (2019-2024) & (Tons)
Figure 53. Brazil Plant-based and Cultured Meat Consumption and Growth Rate (2019-2024) & (Tons)
Figure 54. Turkey Plant-based and Cultured Meat Consumption and Growth Rate (2019-2024) & (Tons)
Figure 55. GCC Countries Plant-based and Cultured Meat Consumption and Growth Rate (2019-2024) & (Tons)
Figure 56. Global Production Market Share of Plant-based and Cultured Meat by Type (2019-2030)
Figure 57. Global Production Value Market Share of Plant-based and Cultured Meat by Type (2019-2030)
Figure 58. Global Plant-based and Cultured Meat Price (US$/Ton) by Type (2019-2030)
Figure 59. Global Production Market Share of Plant-based and Cultured Meat by Application (2019-2030)
Figure 60. Global Production Value Market Share of Plant-based and Cultured Meat by Application (2019-2030)
Figure 61. Global Plant-based and Cultured Meat Price (US$/Ton) by Application (2019-2030)
Figure 62. Plant-based and Cultured Meat Value Chain
Figure 63. Plant-based and Cultured Meat Production Process
Figure 64. Channels of Distribution (Direct Vs Distribution)
Figure 65. Distributors Profiles
Figure 66. Bottom-up and Top-down Approaches for This Report
Figure 67. Data Triangulation