
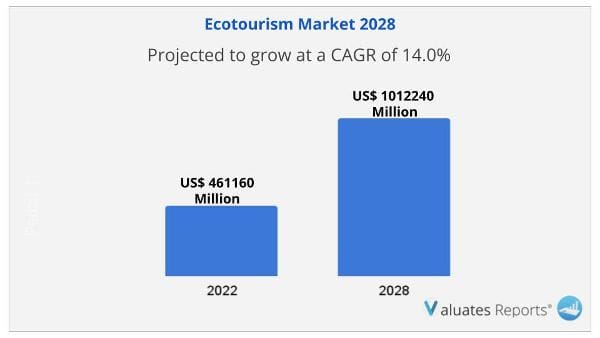
Considering the economic change due to COVID-19 and Russia-Ukraine War Influence, the global Ecotourism market is projected to reach US$ 1012240 million by 2028 from an estimated US$ 461160 million in 2022, at a CAGR of 14.0% during 2023 and 2028.
Environmental awareness among people is expected to increase the demand for ecotourism. Due to heightened awareness of the damaging consequences of tourism on the environment, such as water pollution, soil erosion, and habitat loss, sustainable travelers and government organizations are supporting ecotourism and aiding the industry's growth. The growing popularity of solo travel, outdoor recreation, and immersion travel, as well as rapid urbanization and the availability of low-cost flights, are further factors driving the growth of the ecotourism industry.
Major players in the industry include Expedia Group, Booking Holdings and American Express Global Business Travel, which accounted for 3.16%,2.39% and 1.06% of revenues respectively in 2019. By region, North America has the highest market share, at more than 38 percent.
Ecotourism is a form of tourism involving visiting fragile, pristine, and relatively undisturbed natural areas, intended as a low-impact and often small-scale alternative to standard commercial mass tourism.
Ecotourism market expansion will be accelerated by rising environmental consciousness. Ecotourism seeks to raise environmental consciousness through exploring ecology and ecosystems and by providing outdoor-themed activities. People's thinking is influenced by actively engaging in ecology and understanding personally how ecosystems work, which ultimately raises awareness of conservation and protection. Today's travelers are more driven to make a difference, and interest in trips that benefit various global communities is growing. Two-thirds of customers give sustainable travel high priority, and 37% of respondents in a recent Amadeus study agreed that giving tourists the chance to contribute to the industry's long-term sustainability will help protect tourist destinations.
The preference for immersive travel is anticipated to fuel the expansion of the ecotourism industry. Learning about local cultures is seen as a crucial element of sustainable travel by those who seek out authentic experiences that offer insight into local culture and customs, away from over-the-top tourist attractions. Travelers should never choose to live like tourists over forming new habits and experiencing genuine life. This is referred to as life and serves as a regional mindset. Going outside of one's comfort zone to experience new realities is one of the most important aspects of sustainable tourism.
Government organizations like the World Tourism Organization and the United Nations Educational, Scientific and Cultural Organization (UNESCO) are supporting the leisure industry in an effort to attract customers and various tourist groups from all over the world. Countries like the UAE have started a variety of programs and sustainability projects to safeguard the environment and establish themselves as global leaders among eco-friendly tourist spots. This is anticipated to fuel the expansion of the ecotourism market.
Furthermore, as the importance of environmentally friendly travel increases, the leading companies in the field are setting the standard. This will subsequently support the growth of the ecotourism market.
This report aims to provide a comprehensive presentation of the global market for Ecotourism, with both quantitative and qualitative analysis, to help readers develop business/growth strategies, assess the market competitive situation, analyse their position in the current marketplace, and make informed business decisions regarding Ecotourism.
The Ecotourism market size, estimations, and forecasts are provided in terms of and revenue ($ millions), considering 2021 as the base year, with history and forecast data for the period from 2017 to 2028. This report segments the global Ecotourism market comprehensively. Regional market sizes, concerning products by type, by application, and by players, are also provided. The influence of COVID-19 and the Russia-Ukraine War were considered while estimating market sizes.
For a more in-depth understanding of the market, the report provides profiles of the competitive landscape, key competitors, and their respective market ranks. The report also discusses technological trends and new product developments.
The report will help the Ecotourism companies, new entrants, and industry chain related companies in this market with information on the revenues for the overall market and the sub-segments across the different segments, by company, product type, application, and regions.
In this section, the readers will gain an understanding of the key players competing. This report has studied the key growth strategies, such as innovative trends and developments, intensification of product portfolio, mergers and acquisitions, collaborations, new product innovation, and geographical expansion, undertaken by these participants to maintain their presence. Apart from business strategies, the study includes current developments and key financials. The readers will also get access to the data related to global revenue by companies for the period 2017-2022. This all-inclusive report will certainly serve the clients to stay updated and make effective decisions in their businesses. Some of the prominent players reviewed in the research report include:
Product Type Insights
Global markets are presented by Ecotourism type, along with growth forecasts through 2028. Estimates on revenue are based on the price in the supply chain at which the Ecotourism are procured by the companies.
This report has studied every segment and provided the market size using historical data. They have also talked about the growth opportunities that the segment may pose in the future. This study bestows revenue data by type, and during the historical period (2017-2022) and forecast period (2023-2028).
Application Insights
This report has provided the market size (revenue data) by application, during the historical period (2017-2022) and forecast period (2023-2028).
This report also outlines the market trends of each segment and consumer behaviors impacting the Ecotourism market and what implications these may have on the industry's future. This report can help to understand the relevant market and consumer trends that are driving the Ecotourism market.
This section of the report provides key insights regarding various regions and the key players operating in each region. Economic, social, environmental, technological, and political factors have been taken into consideration while assessing the growth of the particular region/country. The readers will also get their hands on the revenue of each region and country for the period 2017-2028.
The market has been segmented into various major geographies, including North America, Europe, Asia-Pacific, South America, Middle East & Africa. Detailed analysis of major countries such as the USA, Germany, the U.K., Italy, France, China, Japan, South Korea, Southeast Asia, and India will be covered within the regional segment. For market estimates, data are going to be provided for 2021 because of the base year, with estimates for 2022 and forecast revenue for 2028.
|
Report Metric |
Details |
|
Base Year: |
2021 |
|
Market Size in 2022: |
USD 461160 Million |
|
Forecast Period: |
2022 to 2028 |
|
Forecast Period 2023 to 2028 CAGR: |
14.0% |
|
2028 Value Projection: |
USD 461160 Million |
|
No. of Pages: |
113 |
|
Tables & Figures |
152 |
|
Segments covered: |
Type, Application, Region |
Reasons to Buy This Report
Ans. The forecast period in the Ecotourism Market report is from 2022 to 2028.
Ans. The Chapter-wise Ecotourism market report can be obtained on from the Valuates Reports website. Also, 24*7 chat support and direct call services are provided to procure the chapter-wise report.
Ans. Alternative Tourism, Responsible Tourism, Sustainable Tourism, and Community Tourism are the segments by type in Ecotourism Market.
Ans. Considering the economic change due to COVID-19 and Russia-Ukraine War Influence, the global Ecotourism market is projected to reach US$ 1012240 million by 2028 from an estimated US$ 461160 million in 2022, at a CAGR of 14.0% during 2023 and 2028.
$5900
$8850
$11800
HAVE A QUERY?
OUR CUSTOMER
