List of Tables
Table 1. Global Automotive Wiring Harness Components Market Size Growth Rate by Type (US$ Million): 2021 vs 2025 vs 2032
Table 2. Key Players of Body Wiring Harness
Table 3. Key Players of Chassis Wiring Harness
Table 4. Key Players of Engine Wiring Harness
Table 5. Key Players of HVAC Wiring Harness
Table 6. Key Players of Other
Table 7. Global Automotive Wiring Harness Components Market Size Growth Rate by Voltage (US$ Million): 2021 vs 2025 vs 2032
Table 8. Key Players of Low-voltage Wiring Harness
Table 9. Key Players of High-voltage Wiring Harness
Table 10. Global Automotive Wiring Harness Components Market Size Growth Rate by Car Type (US$ Million): 2021 vs 2025 vs 2032
Table 11. Key Players of For Gasoline Vehicles
Table 12. Key Players of For New Energy Vehicles
Table 13. Global Automotive Wiring Harness Components Market Size Growth by Application (US$ Million): 2021 vs 2025 vs 2032
Table 14. Global Automotive Wiring Harness Components Market Size by Region (US$ Million): 2021 vs 2025 vs 2032
Table 15. Global Automotive Wiring Harness Components Market Size by Region (US$ Million), 2021–2026
Table 16. Global Automotive Wiring Harness Components Market Share by Region (2021–2026)
Table 17. Global Automotive Wiring Harness Components Forecasted Market Size by Region (US$ Million), 2027–2032
Table 18. Global Automotive Wiring Harness Components Market Share by Region (2027–2032)
Table 19. Automotive Wiring Harness Components Market Trends
Table 20. Automotive Wiring Harness Components Market Drivers
Table 21. Automotive Wiring Harness Components Market Challenges
Table 22. Automotive Wiring Harness Components Market Restraints
Table 23. Global Automotive Wiring Harness Components Revenue by Players (US$ Million), 2021–2026
Table 24. Global Automotive Wiring Harness Components Market Share by Players (2021–2026)
Table 25. Global Top Automotive Wiring Harness Components Players by Tier (Tier 1, Tier 2, and Tier 3), based on Automotive Wiring Harness Components Revenue, 2025
Table 26. Ranking of Global Top Automotive Wiring Harness Components Companies by Revenue (US$ Million) in 2025
Table 27. Global 5 Largest Players Market Share by Automotive Wiring Harness Components Revenue (CR5 and HHI), 2021–2026
Table 28. Global Key Players of Automotive Wiring Harness Components, Headquarters and Area Served
Table 29. Global Key Players of Automotive Wiring Harness Components, Products and Applications
Table 30. Global Key Players of Automotive Wiring Harness Components, Date of General Availability (GA)
Table 31. Mergers and Acquisitions, Expansion Plans
Table 32. Global Automotive Wiring Harness Components Market Size by Type (US$ Million), 2021–2026
Table 33. Global Automotive Wiring Harness Components Revenue Market Share by Type (2021–2026)
Table 34. Global Automotive Wiring Harness Components Forecasted Market Size by Type (US$ Million), 2027–2032
Table 35. Global Automotive Wiring Harness Components Revenue Market Share by Type (2027–2032)
Table 36. Global Automotive Wiring Harness Components Market Size by Application (US$ Million), 2021–2026
Table 37. Global Automotive Wiring Harness Components Revenue Market Share by Application (2021–2026)
Table 38. Global Automotive Wiring Harness Components Forecasted Market Size by Application (US$ Million), 2027–2032
Table 39. Global Automotive Wiring Harness Components Revenue Market Share by Application (2027–2032)
Table 40. North America Automotive Wiring Harness Components Market Size Growth Rate by Country (US$ Million): 2021 vs 2025 vs 2032
Table 41. North America Automotive Wiring Harness Components Market Size by Country (US$ Million), 2021–2026
Table 42. North America Automotive Wiring Harness Components Market Size by Country (US$ Million), 2027–2032
Table 43. Europe Automotive Wiring Harness Components Market Size Growth Rate by Country (US$ Million): 2021 vs 2025 vs 2032
Table 44. Europe Automotive Wiring Harness Components Market Size by Country (US$ Million), 2021–2026
Table 45. Europe Automotive Wiring Harness Components Market Size by Country (US$ Million), 2027–2032
Table 46. Asia-Pacific Automotive Wiring Harness Components Market Size Growth Rate by Region (US$ Million): 2021 vs 2025 vs 2032
Table 47. Asia-Pacific Automotive Wiring Harness Components Market Size by Region (US$ Million), 2021–2026
Table 48. Asia-Pacific Automotive Wiring Harness Components Market Size by Region (US$ Million), 2027–2032
Table 49. Latin America Automotive Wiring Harness Components Market Size Growth Rate by Country (US$ Million): 2021 vs 2025 vs 2032
Table 50. Latin America Automotive Wiring Harness Components Market Size by Country (US$ Million), 2021–2026
Table 51. Latin America Automotive Wiring Harness Components Market Size by Country (US$ Million), 2027–2032
Table 52. Middle East & Africa Automotive Wiring Harness Components Market Size Growth Rate by Country (US$ Million): 2021 vs 2025 vs 2032
Table 53. Middle East & Africa Automotive Wiring Harness Components Market Size by Country (US$ Million), 2021–2026
Table 54. Middle East & Africa Automotive Wiring Harness Components Market Size by Country (US$ Million), 2027–2032
Table 55. Yazaki Company Details
Table 56. Yazaki Business Overview
Table 57. Yazaki Automotive Wiring Harness Components Product
Table 58. Yazaki Revenue in Automotive Wiring Harness Components Business (US$ Million), 2021–2026
Table 59. Yazaki Recent Development
Table 60. Sumitomo Electric Company Details
Table 61. Sumitomo Electric Business Overview
Table 62. Sumitomo Electric Automotive Wiring Harness Components Product
Table 63. Sumitomo Electric Revenue in Automotive Wiring Harness Components Business (US$ Million), 2021–2026
Table 64. Sumitomo Electric Recent Development
Table 65. Aptiv Company Details
Table 66. Aptiv Business Overview
Table 67. Aptiv Automotive Wiring Harness Components Product
Table 68. Aptiv Revenue in Automotive Wiring Harness Components Business (US$ Million), 2021–2026
Table 69. Aptiv Recent Development
Table 70. Leoni Company Details
Table 71. Leoni Business Overview
Table 72. Leoni Automotive Wiring Harness Components Product
Table 73. Leoni Revenue in Automotive Wiring Harness Components Business (US$ Million), 2021–2026
Table 74. Leoni Recent Development
Table 75. Lear Company Details
Table 76. Lear Business Overview
Table 77. Lear Automotive Wiring Harness Components Product
Table 78. Lear Revenue in Automotive Wiring Harness Components Business (US$ Million), 2021–2026
Table 79. Lear Recent Development
Table 80. Furukawa Electric Company Details
Table 81. Furukawa Electric Business Overview
Table 82. Furukawa Electric Automotive Wiring Harness Components Product
Table 83. Furukawa Electric Revenue in Automotive Wiring Harness Components Business (US$ Million), 2021–2026
Table 84. Furukawa Electric Recent Development
Table 85. FinDreams Company Details
Table 86. FinDreams Business Overview
Table 87. FinDreams Automotive Wiring Harness Components Product
Table 88. FinDreams Revenue in Automotive Wiring Harness Components Business (US$ Million), 2021–2026
Table 89. FinDreams Recent Development
Table 90. Motherson Company Details
Table 91. Motherson Business Overview
Table 92. Motherson Automotive Wiring Harness Components Product
Table 93. Motherson Revenue in Automotive Wiring Harness Components Business (US$ Million), 2021–2026
Table 94. Motherson Recent Development
Table 95. Fujikura Company Details
Table 96. Fujikura Business Overview
Table 97. Fujikura Automotive Wiring Harness Components Product
Table 98. Fujikura Revenue in Automotive Wiring Harness Components Business (US$ Million), 2021–2026
Table 99. Fujikura Recent Development
Table 100. THB Electronics Company Details
Table 101. THB Electronics Business Overview
Table 102. THB Electronics Automotive Wiring Harness Components Product
Table 103. THB Electronics Revenue in Automotive Wiring Harness Components Business (US$ Million), 2021–2026
Table 104. THB Electronics Recent Development
Table 105. Kromberg & Schubert Company Details
Table 106. Kromberg & Schubert Business Overview
Table 107. Kromberg & Schubert Automotive Wiring Harness Components Product
Table 108. Kromberg & Schubert Revenue in Automotive Wiring Harness Components Business (US$ Million), 2021–2026
Table 109. Kromberg & Schubert Recent Development
Table 110. DRAXLMAIER Company Details
Table 111. DRAXLMAIER Business Overview
Table 112. DRAXLMAIER Automotive Wiring Harness Components Product
Table 113. DRAXLMAIER Revenue in Automotive Wiring Harness Components Business (US$ Million), 2021–2026
Table 114. DRAXLMAIER Recent Development
Table 115. Nexans Autoelectric Company Details
Table 116. Nexans Autoelectric Business Overview
Table 117. Nexans Autoelectric Automotive Wiring Harness Components Product
Table 118. Nexans Autoelectric Revenue in Automotive Wiring Harness Components Business (US$ Million), 2021–2026
Table 119. Nexans Autoelectric Recent Development
Table 120. Kunshan Huguang Auto Electric Limited Company Details
Table 121. Kunshan Huguang Auto Electric Limited Business Overview
Table 122. Kunshan Huguang Auto Electric Limited Automotive Wiring Harness Components Product
Table 123. Kunshan Huguang Auto Electric Limited Revenue in Automotive Wiring Harness Components Business (US$ Million), 2021–2026
Table 124. Kunshan Huguang Auto Electric Limited Recent Development
Table 125. Uniconn Company Details
Table 126. Uniconn Business Overview
Table 127. Uniconn Automotive Wiring Harness Components Product
Table 128. Uniconn Revenue in Automotive Wiring Harness Components Business (US$ Million), 2021–2026
Table 129. Uniconn Recent Development
Table 130. Coroplast Company Details
Table 131. Coroplast Business Overview
Table 132. Coroplast Automotive Wiring Harness Components Product
Table 133. Coroplast Revenue in Automotive Wiring Harness Components Business (US$ Million), 2021–2026
Table 134. Coroplast Recent Development
Table 135. Liuzhou Shuangfei Company Details
Table 136. Liuzhou Shuangfei Business Overview
Table 137. Liuzhou Shuangfei Automotive Wiring Harness Components Product
Table 138. Liuzhou Shuangfei Revenue in Automotive Wiring Harness Components Business (US$ Million), 2021–2026
Table 139. Liuzhou Shuangfei Recent Development
Table 140. Shanghai Jinting Automobile Harness Limited Company Details
Table 141. Shanghai Jinting Automobile Harness Limited Business Overview
Table 142. Shanghai Jinting Automobile Harness Limited Automotive Wiring Harness Components Product
Table 143. Shanghai Jinting Automobile Harness Limited Revenue in Automotive Wiring Harness Components Business (US$ Million), 2021–2026
Table 144. Shanghai Jinting Automobile Harness Limited Recent Development
Table 145. Changchun Jetty Automotive Technology Co., Ltd Company Details
Table 146. Changchun Jetty Automotive Technology Co., Ltd Business Overview
Table 147. Changchun Jetty Automotive Technology Co., Ltd Automotive Wiring Harness Components Product
Table 148. Changchun Jetty Automotive Technology Co., Ltd Revenue in Automotive Wiring Harness Components Business (US$ Million), 2021–2026
Table 149. Changchun Jetty Automotive Technology Co., Ltd Recent Development
Table 150. DEREN Electronics Company Details
Table 151. DEREN Electronics Business Overview
Table 152. DEREN Electronics Automotive Wiring Harness Components Product
Table 153. DEREN Electronics Revenue in Automotive Wiring Harness Components Business (US$ Million), 2021–2026
Table 154. DEREN Electronics Recent Development
Table 155. Luxshare Precision Industry Co., Ltd Company Details
Table 156. Luxshare Precision Industry Co., Ltd Business Overview
Table 157. Luxshare Precision Industry Co., Ltd Automotive Wiring Harness Components Product
Table 158. Luxshare Precision Industry Co., Ltd Revenue in Automotive Wiring Harness Components Business (US$ Million), 2021–2026
Table 159. Luxshare Precision Industry Co., Ltd Recent Development
Table 160. NTGEC Company Details
Table 161. NTGEC Business Overview
Table 162. NTGEC Automotive Wiring Harness Components Product
Table 163. NTGEC Revenue in Automotive Wiring Harness Components Business (US$ Million), 2021–2026
Table 164. NTGEC Recent Development
Table 165. MIND Electronics Appliance Co., Ltd Company Details
Table 166. MIND Electronics Appliance Co., Ltd Business Overview
Table 167. MIND Electronics Appliance Co., Ltd Automotive Wiring Harness Components Product
Table 168. MIND Electronics Appliance Co., Ltd Revenue in Automotive Wiring Harness Components Business (US$ Million), 2021–2026
Table 169. MIND Electronics Appliance Co., Ltd Recent Development
Table 170. Research Programs/Design for This Report
Table 171. Key Data Information from Secondary Sources
Table 172. Key Data Information from Primary Sources
Table 173. Authors List of This Report
List of Figures
Figure 1. Automotive Wiring Harness Components Picture
Figure 2. Global Automotive Wiring Harness Components Market Size Comparison by Type (US$ Million), 2021–2032
Figure 3. Global Automotive Wiring Harness Components Market Share by Type: 2025 vs 2032
Figure 4. Body Wiring Harness Features
Figure 5. Chassis Wiring Harness Features
Figure 6. Engine Wiring Harness Features
Figure 7. HVAC Wiring Harness Features
Figure 8. Other Features
Figure 9. Global Automotive Wiring Harness Components Market Size Comparison by Voltage (US$ Million), 2021–2032
Figure 10. Low-voltage Wiring Harness Features
Figure 11. High-voltage Wiring Harness Features
Figure 12. Global Automotive Wiring Harness Components Market Size Comparison by Car Type (US$ Million), 2021–2032
Figure 13. For Gasoline Vehicles Features
Figure 14. For New Energy Vehicles Features
Figure 15. Global Automotive Wiring Harness Components Market Size by Application (US$ Million), 2021–2032
Figure 16. Global Automotive Wiring Harness Components Market Share by Application: 2025 vs 2032
Figure 17. Passenger Vehicle Case Studies
Figure 18. Commercial Vehicle Case Studies
Figure 19. Automotive Wiring Harness Components Report Years Considered
Figure 20. Global Automotive Wiring Harness Components Market Size (US$ Million), Year-over-Year: 2021–2032
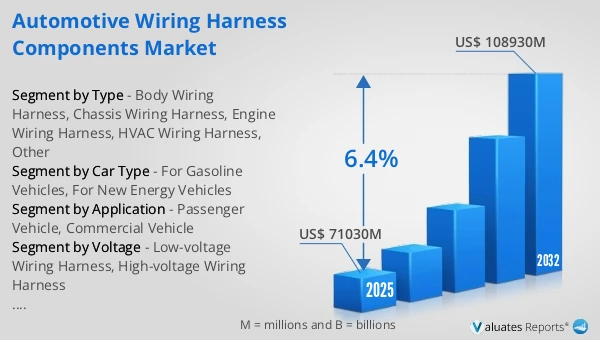
Figure 21. Global Automotive Wiring Harness Components Market Size, (US$ Million), 2021 vs 2025 vs 2032
Figure 22. Global Automotive Wiring Harness Components Market Share by Region: 2025 vs 2032
Figure 23. Global Automotive Wiring Harness Components Market Share by Players in 2025
Figure 24. Global Automotive Wiring Harness Components Market Share by Company Type (Tier 1, Tier 2, and Tier 3)
Figure 25. The Top 10 and 5 Players Market Share by Automotive Wiring Harness Components Revenue in 2025
Figure 26. North America Automotive Wiring Harness Components Market Size YoY Growth (US$ Million), 2021–2032
Figure 27. North America Automotive Wiring Harness Components Market Share by Country (2021–2032)
Figure 28. United States Automotive Wiring Harness Components Market Size YoY Growth (US$ Million), 2021–2032
Figure 29. Canada Automotive Wiring Harness Components Market Size YoY Growth (US$ Million), 2021–2032
Figure 30. Europe Automotive Wiring Harness Components Market Size YoY Growth (US$ Million), 2021–2032
Figure 31. Europe Automotive Wiring Harness Components Market Share by Country (2021–2032)
Figure 32. Germany Automotive Wiring Harness Components Market Size YoY Growth (US$ Million), 2021–2032
Figure 33. France Automotive Wiring Harness Components Market Size YoY Growth (US$ Million), 2021–2032
Figure 34. U.K. Automotive Wiring Harness Components Market Size YoY Growth (US$ Million), 2021–2032
Figure 35. Italy Automotive Wiring Harness Components Market Size YoY Growth (US$ Million), 2021–2032
Figure 36. Russia Automotive Wiring Harness Components Market Size YoY Growth (US$ Million), 2021–2032
Figure 37. Ireland Automotive Wiring Harness Components Market Size YoY Growth (US$ Million), 2021–2032
Figure 38. Asia-Pacific Automotive Wiring Harness Components Market Size YoY Growth (US$ Million), 2021–2032
Figure 39. Asia-Pacific Automotive Wiring Harness Components Market Share by Region (2021–2032)
Figure 40. China Automotive Wiring Harness Components Market Size YoY Growth (US$ Million), 2021–2032
Figure 41. Japan Automotive Wiring Harness Components Market Size YoY Growth (US$ Million), 2021–2032
Figure 42. South Korea Automotive Wiring Harness Components Market Size YoY Growth (US$ Million), 2021–2032
Figure 43. Southeast Asia Automotive Wiring Harness Components Market Size YoY Growth (US$ Million), 2021–2032
Figure 44. India Automotive Wiring Harness Components Market Size YoY Growth (US$ Million), 2021–2032
Figure 45. Australia & New Zealand Automotive Wiring Harness Components Market Size YoY Growth (US$ Million), 2021–2032
Figure 46. Latin America Automotive Wiring Harness Components Market Size YoY Growth (US$ Million), 2021–2032
Figure 47. Latin America Automotive Wiring Harness Components Market Share by Country (2021–2032)
Figure 48. Mexico Automotive Wiring Harness Components Market Size YoY Growth (US$ Million), 2021–2032
Figure 49. Brazil Automotive Wiring Harness Components Market Size YoY Growth (US$ Million), 2021–2032
Figure 50. Middle East & Africa Automotive Wiring Harness Components Market Size YoY Growth (US$ Million), 2021–2032
Figure 51. Middle East & Africa Automotive Wiring Harness Components Market Share by Country (2021–2032)
Figure 52. Israel Automotive Wiring Harness Components Market Size YoY Growth (US$ Million), 2021–2032
Figure 53. Saudi Arabia Automotive Wiring Harness Components Market Size YoY Growth (US$ Million), 2021–2032
Figure 54. UAE Automotive Wiring Harness Components Market Size YoY Growth (US$ Million), 2021–2032
Figure 55. Yazaki Revenue Growth Rate in Automotive Wiring Harness Components Business (2021–2026)
Figure 56. Sumitomo Electric Revenue Growth Rate in Automotive Wiring Harness Components Business (2021–2026)
Figure 57. Aptiv Revenue Growth Rate in Automotive Wiring Harness Components Business (2021–2026)
Figure 58. Leoni Revenue Growth Rate in Automotive Wiring Harness Components Business (2021–2026)
Figure 59. Lear Revenue Growth Rate in Automotive Wiring Harness Components Business (2021–2026)
Figure 60. Furukawa Electric Revenue Growth Rate in Automotive Wiring Harness Components Business (2021–2026)
Figure 61. FinDreams Revenue Growth Rate in Automotive Wiring Harness Components Business (2021–2026)
Figure 62. Motherson Revenue Growth Rate in Automotive Wiring Harness Components Business (2021–2026)
Figure 63. Fujikura Revenue Growth Rate in Automotive Wiring Harness Components Business (2021–2026)
Figure 64. THB Electronics Revenue Growth Rate in Automotive Wiring Harness Components Business (2021–2026)
Figure 65. Kromberg & Schubert Revenue Growth Rate in Automotive Wiring Harness Components Business (2021–2026)
Figure 66. DRAXLMAIER Revenue Growth Rate in Automotive Wiring Harness Components Business (2021–2026)
Figure 67. Nexans Autoelectric Revenue Growth Rate in Automotive Wiring Harness Components Business (2021–2026)
Figure 68. Kunshan Huguang Auto Electric Limited Revenue Growth Rate in Automotive Wiring Harness Components Business (2021–2026)
Figure 69. Uniconn Revenue Growth Rate in Automotive Wiring Harness Components Business (2021–2026)
Figure 70. Coroplast Revenue Growth Rate in Automotive Wiring Harness Components Business (2021–2026)
Figure 71. Liuzhou Shuangfei Revenue Growth Rate in Automotive Wiring Harness Components Business (2021–2026)
Figure 72. Shanghai Jinting Automobile Harness Limited Revenue Growth Rate in Automotive Wiring Harness Components Business (2021–2026)
Figure 73. Changchun Jetty Automotive Technology Co., Ltd Revenue Growth Rate in Automotive Wiring Harness Components Business (2021–2026)
Figure 74. DEREN Electronics Revenue Growth Rate in Automotive Wiring Harness Components Business (2021–2026)
Figure 75. Luxshare Precision Industry Co., Ltd Revenue Growth Rate in Automotive Wiring Harness Components Business (2021–2026)
Figure 76. NTGEC Revenue Growth Rate in Automotive Wiring Harness Components Business (2021–2026)
Figure 77. MIND Electronics Appliance Co., Ltd Revenue Growth Rate in Automotive Wiring Harness Components Business (2021–2026)
Figure 78. Bottom-up and Top-down Approaches for This Report
Figure 79. Data Triangulation
Figure 80. Key Executives Interviewed