
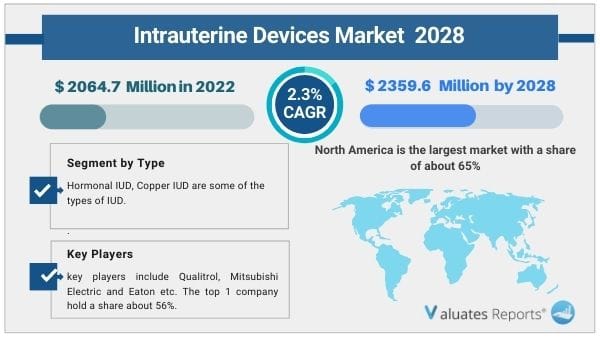
Due to the COVID-19 pandemic, the global Intrauterine Devices market size is estimated to be worth US$ 2064.7 million in 2022 and is forecast to a readjusted size of US$ 2359.6 million by 2028 with a CAGR of 2.3% during the review period. Key drivers of the intrauterine devices market include the growing prevalence of unwanted pregnancies.
The rising awareness campaigns by governments and non-profit organizations along with the high-level effectiveness will fuel the growth of the intrauterine devices market during the forecast period. The increasing shift toward planned parenthood and family planning with safe contraceptive choices will spur market expansion in the coming years. The lack of sex education and unreliable information regarding health on the internet will inhibit use thereby hampering the market.
Half of all pregnancies worldwide either end in abortion or lead to serious health problems for women or girls. The reasons can be varied from gender inequality, harmful cultural norms, stigmas regarding women’s bodies and fertility, sexual violence, and lack of credible information. Poverty and lack of economic development further contribute to the growing problem. Hence there is an urgent need for healthy contraceptive options for promoting healthy sexual health for women across the globe. This presents an incredible opportunity for the rapid penetration of the intrauterine devices market in the coming years.
Intrauterine devices are highly effective and last for longer periods of time approximately 5 to 10 years. They are safe to use and can be inserted easily at any time inside the womb of a woman to prevent pregnancy. These devices have little to no side effects with no extra medications needed to consume. Moreover, governments and other organizations around the world are creating family planning programs and initiatives to boost knowledge. The aim is to give efficient contraceptive access to a major portion of the population. These factors will increase adoption thereby surging the growth of the intrauterine devices market during the upcoming years.
Sexual relations and the very definition of parenthood have changed dramatically owing to advanced contraceptive options available on the market. People have become aware of legal abortion and safe sex. Moreover, newer intrauterine devices fit the bodily requirements of all age groups including teenagers. They are genuinely meant to fit and forget which increases their popularity. This in turn will spur the growth of the intrauterine devices market during the review period.
However, the lack of proper sex education coupled with no efforts on practicing safe sex will inhibit the use. People are ashamed and embarrassed to talk about their sexual problems due to cultural dogmas and other prevalent myths. The information available on the internet is not always correct which creates confusion and prevents the usage of contraceptives. These factors will hamper the expansion of the intrauterine devices market during the forecast period.
Based on type, the copper IUD segment is expected to grow the highest in the intrauterine devices market share as they can be used immediately during emergencies and are cheaper. It starts to function immediately right after insertion.
Based on region, North America is expected to dominate in the intrauterine devices market share with 65% followed by Europe and Asia-Pacific at 24% and 8%.
|
Report Metric |
Details |
|
Report Name |
Intrauterine Devices Market |
|
The market size in 2022 |
USD 2064.7 Million |
|
The revenue forecast in 2028 |
USD 2359.6 Million |
|
Growth Rate |
Compound Annual Growth Rate (CAGR) of 2.3% from 2022 to 2028 |
|
Market size available for years |
2022-2028 |
|
Forecast units |
Value (USD) |
|
Segments covered |
By Type, Application, and Region |
|
Report coverage |
Revenue & volume forecast, company share, competitive landscape, growth factors, and trends |
|
Geographic regions covered |
North America, Europe, Asia Pacific, Latin America, Middle East & Africa |
Ans. The global Intrauterine Devices market size is estimated to be worth US$ 2064.7 million in 2022 and is forecast to a readjusted size of US$ 2359.6 million by 2028.
Ans. The global Intrauterine Devices market is expected to grow at a compound annual growth rate of 2.3% from 2022 to 2028.
Ans. Some of the major companies are Bayer, Merck, Teva Pharmaceutical, Pregna International, Allergan, HRA Pharma, Eurogine, Yantai JiShengYaoXie, TianYi, SMB Corporation, Shenyang Liren, H & J Medical.
Table of Contents
1 Study Coverage
1.1 Intrauterine Devices Product Introduction
1.2 Market by Type
1.2.1 Global Intrauterine Devices Market Size Growth Rate by Type, 2017 VS 2021 VS 2028
1.2.2 Hormonal IUD
1.2.3 Copper IUD
1.3 Market by End User
1.3.1 Global Intrauterine Devices Market Size Growth Rate by End User, 2017 VS 2021 VS 2028
1.3.2 Age 20-24
1.3.3 Age 25-34
1.3.4 Age 35-44
1.3.5 Others
1.4 Study Objectives
1.5 Years Considered
2 Executive Summary
2.1 Global Intrauterine Devices Sales Estimates and Forecasts 2017-2028
2.2 Global Intrauterine Devices Revenue Estimates and Forecasts 2017-2028
2.3 Global Intrauterine Devices Revenue by Region: 2017 VS 2021 VS 2028
2.4 Global Intrauterine Devices Sales by Region
2.4.1 Global Intrauterine Devices Sales by Region (2017-2022)
2.4.2 Global Sales Intrauterine Devices by Region (2023-2028)
2.5 Global Intrauterine Devices Revenue by Region
2.5.1 Global Intrauterine Devices Revenue by Region (2017-2022)
2.5.2 Global Intrauterine Devices Revenue by Region (2023-2028)
2.6 North America
2.7 Europe
2.8 Asia-Pacific
2.9 Latin America
2.10 Middle East & Africa
3 Competition by Manufacturers
3.1 Global Intrauterine Devices Sales by Manufacturers
3.1.1 Global Top Intrauterine Devices Manufacturers by Sales (2017-2022)
3.1.2 Global Intrauterine Devices Sales Market Share by Manufacturers (2017-2022)
3.1.3 Global Top 10 and Top 5 Largest Manufacturers of Intrauterine Devices in 2021
3.2 Global Intrauterine Devices Revenue by Manufacturers
3.2.1 Global Intrauterine Devices Revenue by Manufacturers (2017-2022)
3.2.2 Global Intrauterine Devices Revenue Market Share by Manufacturers (2017-2022)
3.2.3 Global Top 10 and Top 5 Companies by Intrauterine Devices Revenue in 2021
3.3 Global Intrauterine Devices Sales Price by Manufacturers (2017-2022)
3.4 Analysis of Competitive Landscape
3.4.1 Manufacturers Market Concentration Ratio (CR5 and HHI)
3.4.2 Global Intrauterine Devices Market Share by Company Type (Tier 1, Tier 2, and Tier 3)
3.4.3 Global Intrauterine Devices Manufacturers Geographical Distribution
3.5 Mergers & Acquisitions, Expansion Plans
4 Market Size by Type
4.1 Global Intrauterine Devices Sales by Type
4.1.1 Global Intrauterine Devices Historical Sales by Type (2017-2022)
4.1.2 Global Intrauterine Devices Forecasted Sales by Type (2023-2028)
4.1.3 Global Intrauterine Devices Sales Market Share by Type (2017-2028)
4.2 Global Intrauterine Devices Revenue by Type
4.2.1 Global Intrauterine Devices Historical Revenue by Type (2017-2022)
4.2.2 Global Intrauterine Devices Forecasted Revenue by Type (2023-2028)
4.2.3 Global Intrauterine Devices Revenue Market Share by Type (2017-2028)
4.3 Global Intrauterine Devices Price by Type
4.3.1 Global Intrauterine Devices Price by Type (2017-2022)
4.3.2 Global Intrauterine Devices Price Forecast by Type (2023-2028)
5 Market Size by End User
5.1 Global Intrauterine Devices Sales by End User
5.1.1 Global Intrauterine Devices Historical Sales by End User (2017-2022)
5.1.2 Global Intrauterine Devices Forecasted Sales by End User (2023-2028)
5.1.3 Global Intrauterine Devices Sales Market Share by End User (2017-2028)
5.2 Global Intrauterine Devices Revenue by End User
5.2.1 Global Intrauterine Devices Historical Revenue by End User (2017-2022)
5.2.2 Global Intrauterine Devices Forecasted Revenue by End User (2023-2028)
5.2.3 Global Intrauterine Devices Revenue Market Share by End User (2017-2028)
5.3 Global Intrauterine Devices Price by End User
5.3.1 Global Intrauterine Devices Price by End User (2017-2022)
5.3.2 Global Intrauterine Devices Price Forecast by End User (2023-2028)
6 North America
6.1 North America Intrauterine Devices Market Size by Type
6.1.1 North America Intrauterine Devices Sales by Type (2017-2028)
6.1.2 North America Intrauterine Devices Revenue by Type (2017-2028)
6.2 North America Intrauterine Devices Market Size by End User
6.2.1 North America Intrauterine Devices Sales by End User (2017-2028)
6.2.2 North America Intrauterine Devices Revenue by End User (2017-2028)
6.3 North America Intrauterine Devices Market Size by Country
6.3.1 North America Intrauterine Devices Sales by Country (2017-2028)
6.3.2 North America Intrauterine Devices Revenue by Country (2017-2028)
6.3.3 U.S.
6.3.4 Canada
7 Europe
7.1 Europe Intrauterine Devices Market Size by Type
7.1.1 Europe Intrauterine Devices Sales by Type (2017-2028)
7.1.2 Europe Intrauterine Devices Revenue by Type (2017-2028)
7.2 Europe Intrauterine Devices Market Size by End User
7.2.1 Europe Intrauterine Devices Sales by End User (2017-2028)
7.2.2 Europe Intrauterine Devices Revenue by End User (2017-2028)
7.3 Europe Intrauterine Devices Market Size by Country
7.3.1 Europe Intrauterine Devices Sales by Country (2017-2028)
7.3.2 Europe Intrauterine Devices Revenue by Country (2017-2028)
7.3.3 Germany
7.3.4 France
7.3.5 U.K.
7.3.6 Italy
7.3.7 Russia
8 Asia Pacific
8.1 Asia Pacific Intrauterine Devices Market Size by Type
8.1.1 Asia Pacific Intrauterine Devices Sales by Type (2017-2028)
8.1.2 Asia Pacific Intrauterine Devices Revenue by Type (2017-2028)
8.2 Asia Pacific Intrauterine Devices Market Size by End User
8.2.1 Asia Pacific Intrauterine Devices Sales by End User (2017-2028)
8.2.2 Asia Pacific Intrauterine Devices Revenue by End User (2017-2028)
8.3 Asia Pacific Intrauterine Devices Market Size by Region
8.3.1 Asia Pacific Intrauterine Devices Sales by Region (2017-2028)
8.3.2 Asia Pacific Intrauterine Devices Revenue by Region (2017-2028)
8.3.3 China
8.3.4 Japan
8.3.5 South Korea
8.3.6 India
8.3.7 Australia
8.3.8 Taiwan
8.3.9 Indonesia
8.3.10 Thailand
8.3.11 Malaysia
8.3.12 Philippines
9 Latin America
9.1 Latin America Intrauterine Devices Market Size by Type
9.1.1 Latin America Intrauterine Devices Sales by Type (2017-2028)
9.1.2 Latin America Intrauterine Devices Revenue by Type (2017-2028)
9.2 Latin America Intrauterine Devices Market Size by End User
9.2.1 Latin America Intrauterine Devices Sales by End User (2017-2028)
9.2.2 Latin America Intrauterine Devices Revenue by End User (2017-2028)
9.3 Latin America Intrauterine Devices Market Size by Country
9.3.1 Latin America Intrauterine Devices Sales by Country (2017-2028)
9.3.2 Latin America Intrauterine Devices Revenue by Country (2017-2028)
9.3.3 Mexico
9.3.4 Brazil
9.3.5 Argentina
10 Middle East and Africa
10.1 Middle East and Africa Intrauterine Devices Market Size by Type
10.1.1 Middle East and Africa Intrauterine Devices Sales by Type (2017-2028)
10.1.2 Middle East and Africa Intrauterine Devices Revenue by Type (2017-2028)
10.2 Middle East and Africa Intrauterine Devices Market Size by End User
10.2.1 Middle East and Africa Intrauterine Devices Sales by End User (2017-2028)
10.2.2 Middle East and Africa Intrauterine Devices Revenue by End User (2017-2028)
10.3 Middle East and Africa Intrauterine Devices Market Size by Country
10.3.1 Middle East and Africa Intrauterine Devices Sales by Country (2017-2028)
10.3.2 Middle East and Africa Intrauterine Devices Revenue by Country (2017-2028)
10.3.3 Turkey
10.3.4 Saudi Arabia
11 Company Profiles
11.1 Bayer
11.1.1 Bayer Corporation Information
11.1.2 Bayer Overview
11.1.3 Bayer Intrauterine Devices Sales, Price, Revenue and Gross Margin (2017-2022)
11.1.4 Bayer Intrauterine Devices Product Model Numbers, Pictures, Descriptions and Specifications
11.1.5 Bayer Recent Developments
11.2 Merck
11.2.1 Merck Corporation Information
11.2.2 Merck Overview
11.2.3 Merck Intrauterine Devices Sales, Price, Revenue and Gross Margin (2017-2022)
11.2.4 Merck Intrauterine Devices Product Model Numbers, Pictures, Descriptions and Specifications
11.2.5 Merck Recent Developments
11.3 Teva Pharmaceutical
11.3.1 Teva Pharmaceutical Corporation Information
11.3.2 Teva Pharmaceutical Overview
11.3.3 Teva Pharmaceutical Intrauterine Devices Sales, Price, Revenue and Gross Margin (2017-2022)
11.3.4 Teva Pharmaceutical Intrauterine Devices Product Model Numbers, Pictures, Descriptions and Specifications
11.3.5 Teva Pharmaceutical Recent Developments
11.4 Pregna International
11.4.1 Pregna International Corporation Information
11.4.2 Pregna International Overview
11.4.3 Pregna International Intrauterine Devices Sales, Price, Revenue and Gross Margin (2017-2022)
11.4.4 Pregna International Intrauterine Devices Product Model Numbers, Pictures, Descriptions and Specifications
11.4.5 Pregna International Recent Developments
11.5 Allergan
11.5.1 Allergan Corporation Information
11.5.2 Allergan Overview
11.5.3 Allergan Intrauterine Devices Sales, Price, Revenue and Gross Margin (2017-2022)
11.5.4 Allergan Intrauterine Devices Product Model Numbers, Pictures, Descriptions and Specifications
11.5.5 Allergan Recent Developments
11.6 HRA Pharma
11.6.1 HRA Pharma Corporation Information
11.6.2 HRA Pharma Overview
11.6.3 HRA Pharma Intrauterine Devices Sales, Price, Revenue and Gross Margin (2017-2022)
11.6.4 HRA Pharma Intrauterine Devices Product Model Numbers, Pictures, Descriptions and Specifications
11.6.5 HRA Pharma Recent Developments
11.7 Eurogine
11.7.1 Eurogine Corporation Information
11.7.2 Eurogine Overview
11.7.3 Eurogine Intrauterine Devices Sales, Price, Revenue and Gross Margin (2017-2022)
11.7.4 Eurogine Intrauterine Devices Product Model Numbers, Pictures, Descriptions and Specifications
11.7.5 Eurogine Recent Developments
11.8 Yantai JiShengYaoXie
11.8.1 Yantai JiShengYaoXie Corporation Information
11.8.2 Yantai JiShengYaoXie Overview
11.8.3 Yantai JiShengYaoXie Intrauterine Devices Sales, Price, Revenue and Gross Margin (2017-2022)
11.8.4 Yantai JiShengYaoXie Intrauterine Devices Product Model Numbers, Pictures, Descriptions and Specifications
11.8.5 Yantai JiShengYaoXie Recent Developments
11.9 TianYi
11.9.1 TianYi Corporation Information
11.9.2 TianYi Overview
11.9.3 TianYi Intrauterine Devices Sales, Price, Revenue and Gross Margin (2017-2022)
11.9.4 TianYi Intrauterine Devices Product Model Numbers, Pictures, Descriptions and Specifications
11.9.5 TianYi Recent Developments
11.10 SMB Corporation
11.10.1 SMB Corporation Corporation Information
11.10.2 SMB Corporation Overview
11.10.3 SMB Corporation Intrauterine Devices Sales, Price, Revenue and Gross Margin (2017-2022)
11.10.4 SMB Corporation Intrauterine Devices Product Model Numbers, Pictures, Descriptions and Specifications
11.10.5 SMB Corporation Recent Developments
11.11 Shenyang Liren
11.11.1 Shenyang Liren Corporation Information
11.11.2 Shenyang Liren Overview
11.11.3 Shenyang Liren Intrauterine Devices Sales, Price, Revenue and Gross Margin (2017-2022)
11.11.4 Shenyang Liren Intrauterine Devices Product Model Numbers, Pictures, Descriptions and Specifications
11.11.5 Shenyang Liren Recent Developments
11.12 H & J Medical
11.12.1 H & J Medical Corporation Information
11.12.2 H & J Medical Overview
11.12.3 H & J Medical Intrauterine Devices Sales, Price, Revenue and Gross Margin (2017-2022)
11.12.4 H & J Medical Intrauterine Devices Product Model Numbers, Pictures, Descriptions and Specifications
11.12.5 H & J Medical Recent Developments
12 Industry Chain and Sales Channels Analysis
12.1 Intrauterine Devices Industry Chain Analysis
12.2 Intrauterine Devices Key Raw Materials
12.2.1 Key Raw Materials
12.2.2 Raw Materials Key Suppliers
12.3 Intrauterine Devices Production Mode & Process
12.4 Intrauterine Devices Sales and Marketing
12.4.1 Intrauterine Devices Sales Channels
12.4.2 Intrauterine Devices Distributors
12.5 Intrauterine Devices Customers
13 Market Drivers, Opportunities, Challenges, and Risks Factors Analysis
13.1 Intrauterine Devices Industry Trends
13.2 Intrauterine Devices Market Drivers
13.3 Intrauterine Devices Market Challenges
13.4 Intrauterine Devices Market Restraints
14 Key Findings in The Global Intrauterine Devices Study
15 Appendix
15.1 Research Methodology
15.1.1 Methodology/Research Approach
15.1.2 Data Source
15.2 Author Details
15.3 Disclaimer
List of Tables
Table 1. Global Intrauterine Devices Market Size Growth Rate by Type, 2017 VS 2021 VS 2028 (US$ Million)
Table 2. Major Manufacturers of Hormonal IUD
Table 3. Major Manufacturers of Copper IUD
Table 4. Global Intrauterine Devices Market Size Growth Rate by End User, 2017 VS 2021 VS 2028 (US$ Million)
Table 5. Global Intrauterine Devices Revenue by Region: 2017 VS 2021 VS 2028 (US$ Million)
Table 6. Global Intrauterine Devices Sales by Region (2017-2022) & (K Units)
Table 7. Global Intrauterine Devices Sales Market Share by Region (2017-2022)
Table 8. Global Intrauterine Devices Sales by Region (2023-2028) & (K Units)
Table 9. Global Intrauterine Devices Sales Market Share by Region (2023-2028)
Table 10. Global Intrauterine Devices Revenue by Region (2017-2022) & (US$ Million)
Table 11. Global Intrauterine Devices Revenue Market Share by Region (2017-2022)
Table 12. Global Intrauterine Devices Revenue by Region (2023-2028) & (US$ Million)
Table 13. Global Intrauterine Devices Revenue Market Share by Region (2023-2028)
Table 14. Global Intrauterine Devices Sales by Manufacturers (2017-2022) & (K Units)
Table 15. Global Intrauterine Devices Sales Share by Manufacturers (2017-2022)
Table 16. Global Intrauterine Devices Revenue by Manufacturers (2017-2022) & (US$ Million)
Table 17. Global Intrauterine Devices Revenue Share by Manufacturers (2017-2022)
Table 18. Intrauterine Devices Price by Manufacturers (2017-2022) &(USD/Unit)
Table 19. Global Intrauterine Devices Manufacturers Market Concentration Ratio (CR5 and HHI)
Table 20. Global Intrauterine Devices by Company Type (Tier 1, Tier 2, and Tier 3) & (based on the Revenue in Intrauterine Devices as of 2021)
Table 21. Intrauterine Devices Manufacturing Base Distribution and Headquarters
Table 22. Manufacturers Intrauterine Devices Product Offered
Table 23. Date of Manufacturers Enter into Intrauterine Devices Market
Table 24. Mergers & Acquisitions, Expansion Plans
Table 25. Global Intrauterine Devices Sales by Type (2017-2022) & (K Units)
Table 26. Global Intrauterine Devices Sales by Type (2023-2028) & (K Units)
Table 27. Global Intrauterine Devices Sales Share by Type (2017-2022)
Table 28. Global Intrauterine Devices Sales Share by Type (2023-2028)
Table 29. Global Intrauterine Devices Revenue by Type (2017-2022) & (US$ Million)
Table 30. Global Intrauterine Devices Revenue by Type (2023-2028) & (US$ Million)
Table 31. Global Intrauterine Devices Revenue Share by Type (2017-2022)
Table 32. Global Intrauterine Devices Revenue Share by Type (2023-2028)
Table 33. Intrauterine Devices Price by Type (2017-2022) & (USD/Unit)
Table 34. Global Intrauterine Devices Price Forecast by Type (2023-2028) & (USD/Unit)
Table 35. Global Intrauterine Devices Sales by End User (2017-2022) & (K Units)
Table 36. Global Intrauterine Devices Sales by End User (2023-2028) & (K Units)
Table 37. Global Intrauterine Devices Sales Share by End User (2017-2022)
Table 38. Global Intrauterine Devices Sales Share by End User (2023-2028)
Table 39. Global Intrauterine Devices Revenue by End User (2017-2022) & (US$ Million)
Table 40. Global Intrauterine Devices Revenue by End User (2023-2028) & (US$ Million)
Table 41. Global Intrauterine Devices Revenue Share by End User (2017-2022)
Table 42. Global Intrauterine Devices Revenue Share by End User (2023-2028)
Table 43. Intrauterine Devices Price by End User (2017-2022) & (USD/Unit)
Table 44. Global Intrauterine Devices Price Forecast by End User (2023-2028) & (USD/Unit)
Table 45. North America Intrauterine Devices Sales by Type (2017-2022) & (K Units)
Table 46. North America Intrauterine Devices Sales by Type (2023-2028) & (K Units)
Table 47. North America Intrauterine Devices Revenue by Type (2017-2022) & (US$ Million)
Table 48. North America Intrauterine Devices Revenue by Type (2023-2028) & (US$ Million)
Table 49. North America Intrauterine Devices Sales by End User (2017-2022) & (K Units)
Table 50. North America Intrauterine Devices Sales by End User (2023-2028) & (K Units)
Table 51. North America Intrauterine Devices Revenue by End User (2017-2022) & (US$ Million)
Table 52. North America Intrauterine Devices Revenue by End User (2023-2028) & (US$ Million)
Table 53. North America Intrauterine Devices Sales by Country (2017-2022) & (K Units)
Table 54. North America Intrauterine Devices Sales by Country (2023-2028) & (K Units)
Table 55. North America Intrauterine Devices Revenue by Country (2017-2022) & (US$ Million)
Table 56. North America Intrauterine Devices Revenue by Country (2023-2028) & (US$ Million)
Table 57. Europe Intrauterine Devices Sales by Type (2017-2022) & (K Units)
Table 58. Europe Intrauterine Devices Sales by Type (2023-2028) & (K Units)
Table 59. Europe Intrauterine Devices Revenue by Type (2017-2022) & (US$ Million)
Table 60. Europe Intrauterine Devices Revenue by Type (2023-2028) & (US$ Million)
Table 61. Europe Intrauterine Devices Sales by End User (2017-2022) & (K Units)
Table 62. Europe Intrauterine Devices Sales by End User (2023-2028) & (K Units)
Table 63. Europe Intrauterine Devices Revenue by End User (2017-2022) & (US$ Million)
Table 64. Europe Intrauterine Devices Revenue by End User (2023-2028) & (US$ Million)
Table 65. Europe Intrauterine Devices Sales by Country (2017-2022) & (K Units)
Table 66. Europe Intrauterine Devices Sales by Country (2023-2028) & (K Units)
Table 67. Europe Intrauterine Devices Revenue by Country (2017-2022) & (US$ Million)
Table 68. Europe Intrauterine Devices Revenue by Country (2023-2028) & (US$ Million)
Table 69. Asia Pacific Intrauterine Devices Sales by Type (2017-2022) & (K Units)
Table 70. Asia Pacific Intrauterine Devices Sales by Type (2023-2028) & (K Units)
Table 71. Asia Pacific Intrauterine Devices Revenue by Type (2017-2022) & (US$ Million)
Table 72. Asia Pacific Intrauterine Devices Revenue by Type (2023-2028) & (US$ Million)
Table 73. Asia Pacific Intrauterine Devices Sales by End User (2017-2022) & (K Units)
Table 74. Asia Pacific Intrauterine Devices Sales by End User (2023-2028) & (K Units)
Table 75. Asia Pacific Intrauterine Devices Revenue by End User (2017-2022) & (US$ Million)
Table 76. Asia Pacific Intrauterine Devices Revenue by End User (2023-2028) & (US$ Million)
Table 77. Asia Pacific Intrauterine Devices Sales by Region (2017-2022) & (K Units)
Table 78. Asia Pacific Intrauterine Devices Sales by Region (2023-2028) & (K Units)
Table 79. Asia Pacific Intrauterine Devices Revenue by Region (2017-2022) & (US$ Million)
Table 80. Asia Pacific Intrauterine Devices Revenue by Region (2023-2028) & (US$ Million)
Table 81. Latin America Intrauterine Devices Sales by Type (2017-2022) & (K Units)
Table 82. Latin America Intrauterine Devices Sales by Type (2023-2028) & (K Units)
Table 83. Latin America Intrauterine Devices Revenue by Type (2017-2022) & (US$ Million)
Table 84. Latin America Intrauterine Devices Revenue by Type (2023-2028) & (US$ Million)
Table 85. Latin America Intrauterine Devices Sales by End User (2017-2022) & (K Units)
Table 86. Latin America Intrauterine Devices Sales by End User (2023-2028) & (K Units)
Table 87. Latin America Intrauterine Devices Revenue by End User (2017-2022) & (US$ Million)
Table 88. Latin America Intrauterine Devices Revenue by End User (2023-2028) & (US$ Million)
Table 89. Latin America Intrauterine Devices Sales by Country (2017-2022) & (K Units)
Table 90. Latin America Intrauterine Devices Sales by Country (2023-2028) & (K Units)
Table 91. Latin America Intrauterine Devices Revenue by Country (2017-2022) & (US$ Million)
Table 92. Latin America Intrauterine Devices Revenue by Country (2023-2028) & (US$ Million)
Table 93. Middle East and Africa Intrauterine Devices Sales by Type (2017-2022) & (K Units)
Table 94. Middle East and Africa Intrauterine Devices Sales by Type (2023-2028) & (K Units)
Table 95. Middle East and Africa Intrauterine Devices Revenue by Type (2017-2022) & (US$ Million)
Table 96. Middle East and Africa Intrauterine Devices Revenue by Type (2023-2028) & (US$ Million)
Table 97. Middle East and Africa Intrauterine Devices Sales by End User (2017-2022) & (K Units)
Table 98. Middle East and Africa Intrauterine Devices Sales by End User (2023-2028) & (K Units)
Table 99. Middle East and Africa Intrauterine Devices Revenue by End User (2017-2022) & (US$ Million)
Table 100. Middle East and Africa Intrauterine Devices Revenue by End User (2023-2028) & (US$ Million)
Table 101. Middle East and Africa Intrauterine Devices Sales by Country (2017-2022) & (K Units)
Table 102. Middle East and Africa Intrauterine Devices Sales by Country (2023-2028) & (K Units)
Table 103. Middle East and Africa Intrauterine Devices Revenue by Country (2017-2022) & (US$ Million)
Table 104. Middle East and Africa Intrauterine Devices Revenue by Country (2023-2028) & (US$ Million)
Table 105. Bayer Corporation Information
Table 106. Bayer Description and Major Businesses
Table 107. Bayer Intrauterine Devices Sales (K Units), Revenue (US$ Million), Price (USD/Unit) and Gross Margin (2017-2022)
Table 108. Bayer Intrauterine Devices Product Model Numbers, Pictures, Descriptions and Specifications
Table 109. Bayer Recent Developments
Table 110. Merck Corporation Information
Table 111. Merck Description and Major Businesses
Table 112. Merck Intrauterine Devices Sales (K Units), Revenue (US$ Million), Price (USD/Unit) and Gross Margin (2017-2022)
Table 113. Merck Intrauterine Devices Product Model Numbers, Pictures, Descriptions and Specifications
Table 114. Merck Recent Developments
Table 115. Teva Pharmaceutical Corporation Information
Table 116. Teva Pharmaceutical Description and Major Businesses
Table 117. Teva Pharmaceutical Intrauterine Devices Sales (K Units), Revenue (US$ Million), Price (USD/Unit) and Gross Margin (2017-2022)
Table 118. Teva Pharmaceutical Intrauterine Devices Product Model Numbers, Pictures, Descriptions and Specifications
Table 119. Teva Pharmaceutical Recent Developments
Table 120. Pregna International Corporation Information
Table 121. Pregna International Description and Major Businesses
Table 122. Pregna International Intrauterine Devices Sales (K Units), Revenue (US$ Million), Price (USD/Unit) and Gross Margin (2017-2022)
Table 123. Pregna International Intrauterine Devices Product Model Numbers, Pictures, Descriptions and Specifications
Table 124. Pregna International Recent Developments
Table 125. Allergan Corporation Information
Table 126. Allergan Description and Major Businesses
Table 127. Allergan Intrauterine Devices Sales (K Units), Revenue (US$ Million), Price (USD/Unit) and Gross Margin (2017-2022)
Table 128. Allergan Intrauterine Devices Product Model Numbers, Pictures, Descriptions and Specifications
Table 129. Allergan Recent Developments
Table 130. HRA Pharma Corporation Information
Table 131. HRA Pharma Description and Major Businesses
Table 132. HRA Pharma Intrauterine Devices Sales (K Units), Revenue (US$ Million), Price (USD/Unit) and Gross Margin (2017-2022)
Table 133. HRA Pharma Intrauterine Devices Product Model Numbers, Pictures, Descriptions and Specifications
Table 134. HRA Pharma Recent Developments
Table 135. Eurogine Corporation Information
Table 136. Eurogine Description and Major Businesses
Table 137. Eurogine Intrauterine Devices Sales (K Units), Revenue (US$ Million), Price (USD/Unit) and Gross Margin (2017-2022)
Table 138. Eurogine Intrauterine Devices Product Model Numbers, Pictures, Descriptions and Specifications
Table 139. Eurogine Recent Developments
Table 140. Yantai JiShengYaoXie Corporation Information
Table 141. Yantai JiShengYaoXie Description and Major Businesses
Table 142. Yantai JiShengYaoXie Intrauterine Devices Sales (K Units), Revenue (US$ Million), Price (USD/Unit) and Gross Margin (2017-2022)
Table 143. Yantai JiShengYaoXie Intrauterine Devices Product Model Numbers, Pictures, Descriptions and Specifications
Table 144. Yantai JiShengYaoXie Recent Developments
Table 145. TianYi Corporation Information
Table 146. TianYi Description and Major Businesses
Table 147. TianYi Intrauterine Devices Sales (K Units), Revenue (US$ Million), Price (USD/Unit) and Gross Margin (2017-2022)
Table 148. TianYi Intrauterine Devices Product Model Numbers, Pictures, Descriptions and Specifications
Table 149. TianYi Recent Developments
Table 150. SMB Corporation Corporation Information
Table 151. SMB Corporation Description and Major Businesses
Table 152. SMB Corporation Intrauterine Devices Sales (K Units), Revenue (US$ Million), Price (USD/Unit) and Gross Margin (2017-2022)
Table 153. SMB Corporation Intrauterine Devices Product Model Numbers, Pictures, Descriptions and Specifications
Table 154. SMB Corporation Recent Developments
Table 155. Shenyang Liren Corporation Information
Table 156. Shenyang Liren Description and Major Businesses
Table 157. Shenyang Liren Intrauterine Devices Sales (K Units), Revenue (US$ Million), Price (USD/Unit) and Gross Margin (2017-2022)
Table 158. Shenyang Liren Intrauterine Devices Product Model Numbers, Pictures, Descriptions and Specifications
Table 159. Shenyang Liren Recent Developments
Table 160. H & J Medical Corporation Information
Table 161. H & J Medical Description and Major Businesses
Table 162. H & J Medical Intrauterine Devices Sales (K Units), Revenue (US$ Million), Price (USD/Unit) and Gross Margin (2017-2022)
Table 163. H & J Medical Intrauterine Devices Product Model Numbers, Pictures, Descriptions and Specifications
Table 164. H & J Medical Recent Developments
Table 165. Key Raw Materials Lists
Table 166. Raw Materials Key Suppliers Lists
Table 167. Intrauterine Devices Distributors List
Table 168. Intrauterine Devices Customers List
Table 169. Intrauterine Devices Market Trends
Table 170. Intrauterine Devices Market Drivers
Table 171. Intrauterine Devices Market Challenges
Table 172. Intrauterine Devices Market Restraints
Table 173. Research Programs/Design for This Report
Table 174. Key Data Information from Secondary Sources
Table 175. Key Data Information from Primary Sources
List of Figures
Figure 1. Intrauterine Devices Product Picture
Figure 3. Global Intrauterine Devices Market Share by Type in 2021 & 2028
Figure 3. Hormonal IUD Product Picture
Figure 4. Copper IUD Product Picture
Figure 5. Global Intrauterine Devices Market Share by End User in 2021 & 2028
Figure 6. Age 20-24
Figure 7. Age 25-34
Figure 8. Age 35-44
Figure 9. Others
Figure 10. Intrauterine Devices Report Years Considered
Figure 11. Global Intrauterine Devices Sales 2017-2028 (K Units)
Figure 12. Global Intrauterine Devices Revenue, (US$ Million), 2017 VS 2021 VS 2028
Figure 13. Global Intrauterine Devices Revenue 2017-2028 (US$ Million)
Figure 14. Global Intrauterine Devices Revenue Market Share by Region in Percentage: 2021 Versus 2028
Figure 15. Global Intrauterine Devices Sales Market Share by Region (2017-2022)
Figure 16. Global Intrauterine Devices Sales Market Share by Region (2023-2028)
Figure 17. North America Intrauterine Devices Sales YoY (2017-2028) & (K Units)
Figure 18. North America Intrauterine Devices Revenue YoY (2017-2028) & (US$ Million)
Figure 19. Europe Intrauterine Devices Sales YoY (2017-2028) & (K Units)
Figure 20. Europe Intrauterine Devices Revenue YoY (2017-2028) & (US$ Million)
Figure 21. Asia-Pacific Intrauterine Devices Sales YoY (2017-2028) & (K Units)
Figure 22. Asia-Pacific Intrauterine Devices Revenue YoY (2017-2028) & (US$ Million)
Figure 23. Latin America Intrauterine Devices Sales YoY (2017-2028) & (K Units)
Figure 24. Latin America Intrauterine Devices Revenue YoY (2017-2028) & (US$ Million)
Figure 25. Middle East & Africa Intrauterine Devices Sales YoY (2017-2028) & (K Units)
Figure 26. Middle East & Africa Intrauterine Devices Revenue YoY (2017-2028) & (US$ Million)
Figure 27. The Intrauterine Devices Market Share of Top 10 and Top 5 Largest Manufacturers Around the World in 2021
Figure 28. The Top 5 and 10 Largest Manufacturers of Intrauterine Devices in the World: Market Share by Intrauterine Devices Revenue in 2021
Figure 29. Global Intrauterine Devices Market Share by Company Type (Tier 1, Tier 2, and Tier 3): 2017 VS 2021
Figure 30. Global Intrauterine Devices Sales Market Share by Type (2017-2028)
Figure 31. Global Intrauterine Devices Revenue Market Share by Type (2017-2028)
Figure 32. Global Intrauterine Devices Sales Market Share by End User (2017-2028)
Figure 33. Global Intrauterine Devices Revenue Market Share by End User (2017-2028)
Figure 34. North America Intrauterine Devices Sales Market Share by Type (2017-2028)
Figure 35. North America Intrauterine Devices Revenue Market Share by Type (2017-2028)
Figure 36. North America Intrauterine Devices Sales Market Share by End User (2017-2028)
Figure 37. North America Intrauterine Devices Revenue Market Share by End User (2017-2028)
Figure 38. North America Intrauterine Devices Sales Share by Country (2017-2028)
Figure 39. North America Intrauterine Devices Revenue Share by Country (2017-2028)
Figure 40. U.S. Intrauterine Devices Revenue (2017-2028) & (US$ Million)
Figure 41. Canada Intrauterine Devices Revenue (2017-2028) & (US$ Million)
Figure 42. Europe Intrauterine Devices Sales Market Share by Type (2017-2028)
Figure 43. Europe Intrauterine Devices Revenue Market Share by Type (2017-2028)
Figure 44. Europe Intrauterine Devices Sales Market Share by End User (2017-2028)
Figure 45. Europe Intrauterine Devices Revenue Market Share by End User (2017-2028)
Figure 46. Europe Intrauterine Devices Sales Share by Country (2017-2028)
Figure 47. Europe Intrauterine Devices Revenue Share by Country (2017-2028)
Figure 48. Germany Intrauterine Devices Revenue (2017-2028) & (US$ Million)
Figure 49. France Intrauterine Devices Revenue (2017-2028) & (US$ Million)
Figure 50. U.K. Intrauterine Devices Revenue (2017-2028) & (US$ Million)
Figure 51. Italy Intrauterine Devices Revenue (2017-2028) & (US$ Million)
Figure 52. Russia Intrauterine Devices Revenue (2017-2028) & (US$ Million)
Figure 53. Asia Pacific Intrauterine Devices Sales Market Share by Type (2017-2028)
Figure 54. Asia Pacific Intrauterine Devices Revenue Market Share by Type (2017-2028)
Figure 55. Asia Pacific Intrauterine Devices Sales Market Share by End User (2017-2028)
Figure 56. Asia Pacific Intrauterine Devices Revenue Market Share by End User (2017-2028)
Figure 57. Asia Pacific Intrauterine Devices Sales Share by Region (2017-2028)
Figure 58. Asia Pacific Intrauterine Devices Revenue Share by Region (2017-2028)
Figure 59. China Intrauterine Devices Revenue (2017-2028) & (US$ Million)
Figure 60. Japan Intrauterine Devices Revenue (2017-2028) & (US$ Million)
Figure 61. South Korea Intrauterine Devices Revenue (2017-2028) & (US$ Million)
Figure 62. India Intrauterine Devices Revenue (2017-2028) & (US$ Million)
Figure 63. Australia Intrauterine Devices Revenue (2017-2028) & (US$ Million)
Figure 64. Taiwan Intrauterine Devices Revenue (2017-2028) & (US$ Million)
Figure 65. Indonesia Intrauterine Devices Revenue (2017-2028) & (US$ Million)
Figure 66. Thailand Intrauterine Devices Revenue (2017-2028) & (US$ Million)
Figure 67. Malaysia Intrauterine Devices Revenue (2017-2028) & (US$ Million)
Figure 68. Philippines Intrauterine Devices Revenue (2017-2028) & (US$ Million)
Figure 69. Latin America Intrauterine Devices Sales Market Share by Type (2017-2028)
Figure 70. Latin America Intrauterine Devices Revenue Market Share by Type (2017-2028)
Figure 71. Latin America Intrauterine Devices Sales Market Share by End User (2017-2028)
Figure 72. Latin America Intrauterine Devices Revenue Market Share by End User (2017-2028)
Figure 73. Latin America Intrauterine Devices Sales Share by Country (2017-2028)
Figure 74. Latin America Intrauterine Devices Revenue Share by Country (2017-2028)
Figure 75. Mexico Intrauterine Devices Revenue (2017-2028) & (US$ Million)
Figure 76. Brazil Intrauterine Devices Revenue (2017-2028) & (US$ Million)
Figure 77. Argentina Intrauterine Devices Revenue (2017-2028) & (US$ Million)
Figure 78. Middle East and Africa Intrauterine Devices Sales Market Share by Type (2017-2028)
Figure 79. Middle East and Africa Intrauterine Devices Revenue Market Share by Type (2017-2028)
Figure 80. Middle East and Africa Intrauterine Devices Sales Market Share by End User (2017-2028)
Figure 81. Middle East and Africa Intrauterine Devices Revenue Market Share by End User (2017-2028)
Figure 82. Middle East and Africa Intrauterine Devices Sales Share by Country (2017-2028)
Figure 83. Middle East and Africa Intrauterine Devices Revenue Share by Country (2017-2028)
Figure 84. Turkey Intrauterine Devices Revenue (2017-2028) & (US$ Million)
Figure 85. Saudi Arabia Intrauterine Devices Revenue (2017-2028) & (US$ Million)
Figure 86. U.A.E Intrauterine Devices Revenue (2017-2028) & (US$ Million)
Figure 87. Intrauterine Devices Value Chain
Figure 88. Intrauterine Devices Production Process
Figure 89. Channels of Distribution
Figure 90. Distributors Profiles
Figure 91. Bottom-up and Top-down Approaches for This Report
Figure 92. Data Triangulation
Figure 93. Key Executives Interviewed
$4900
$9800
HAVE A QUERY?
OUR CUSTOMER
