0
U.S. (TOLL FREE)
+1 (315) 215-3225
Automative

0
U.S. (TOLL FREE)
+1 (315) 215-3225
Global and India Controlled Atmosphere Furnaces Market Report & Forecast 2023-2029
Published Date: November 2023
|
Report Code: QYRE-Auto-17E16192
Home | Market Reports | Business & Industrial| Industrial Materials & Equipment| Heavy Machinery
Global and India Controlled Atmosphere Furnaces Market Report Forecast 2023 2029
BUY CHAPTERS

Global and India Controlled Atmosphere Furnaces Market Report & Forecast 2023-2029

Code: QYRE-Auto-17E16192
Report
November 2023
Pages:117
QYResearch
Buy Now with 15% Discount
DESCRIPTION
TABLE OF CONTENT
TABLES & FIGURES

and India Controlled Atmosphere Furnaces Market Size

The global Controlled Atmosphere Furnaces revenue was US$ 411.7 million in 2022 and is forecast to a readjusted size of US$ 532.5 million by 2029 with a CAGR of 3.8% during the forecast period (2023-2029).

and India Controlled Atmosphere Furnaces Market

and India Controlled Atmosphere Furnaces Market

Controlled Atmosphere Furnaces have a high percentage of nitrogen, argon, hydrogen, & helium (flushing) and almost no oxygen (inert), or a gas mixture or vacuum to achieve the desired product finish. The oxygen will need to be accurately measured, whilst the nitrogen is controlled and regulated to ensure the correct atmosphere is maintained and running costs are kept to a minimum. Controlled Atmosphere Furnaces are used in applications such as the manufacturing of metal products, where a specialised environment is required within the ovens and furnaces to achieve the desired product finish.
In India, the Controlled Atmosphere Furnaces revenue is expected to grow from US$ million in 2022 to US$ million by 2029, at a CAGR of % during the forecast period (2023-2029).
Global key players of controlled atmosphere furnaces include Ipsen, DOWA Thermotech, IVA Schmetz, SCHMID, KANTO YAKIN KOGYO, etc. The top five players hold a share about 45%. China is the largest producer, has a share about 29%, followed by Europe and North America, both have a share about 24 percent. The largest market is Asia-Pacific, with a share about 51%, followed by Europe and North America, with share 22% and 20%, separately.
This report focuses on global and India Controlled Atmosphere Furnaces market, also covers the segmentation data of other regions in regional level and county level.
India is now the world’s most populous country. According to IMF (its July update to its World Economic Outlook), India’s GDP growth is projected at 6.1% in 2023, powered by domestic investment. First and foremost, the key factor in India's rapid economic growth is the huge supply and demand from a large population base. Demand and supply sides working in both directions to support India's economic stability.
India is a market full of opportunities, and the demand for Controlled Atmosphere Furnaces will continue to grow rapidly in the future.
Global Controlled Atmosphere Furnaces Scope and Market Size
Controlled Atmosphere Furnaces market is segmented in regional and country, by players, by type and by application. Companies, stakeholders, and other participants in the global Controlled Atmosphere Furnaces market will be able to gain the upper hand as they use the report as a powerful resource. The segmental analysis focuses on revenue and forecast by type and by application for the period 2018-2029.
For India market, this report focuses on the Controlled Atmosphere Furnaces market size by players, by Type and by Application, for the period 2018-2029. The key players include the global and local players, which play important roles in India.

Scope of and India Controlled Atmosphere Furnaces Market Report

Report Metric Details
Report Name and India Controlled Atmosphere Furnaces Market
Forecasted market size in 2029 US$ 532.5 million
CAGR 3.8%
Forecasted years 2023 - 2029
Segment by Type
  • Horizontal
  • Vertical
Segment by Application
  • Laboratory
  • Metallurgical Industry
  • Automotive Industry
  • General Manufacturing
  • Others
By Region
  • North America (United States, Canada)
  • Europe (Germany, France, UK, Italy, Russia) Rest of Europe
  • Nordic Countries
  • Asia-Pacific (China, Japan, South Korea)
  • Southeast Asia (India, Australia)
  • Rest of Asia
  • Latin America (Mexico, Brazil)
  • Rest of Latin America
  • Middle East & Africa (Turkey, Saudi Arabia, UAE, Rest of MEA)
By Company Ipsen, DOWA Thermotech, SCHMID, KANTO YAKIN KOGYO, Aichelin Heat Treatment System, IVA Schmetz, Fengdong, TLON Technical Furnaces, Shichuang, BTU, Abbott Furnace, CARBOLITE GERO, Centorr Vacuum, MRF, Jiangsu KingkindIndustrial Furnace, Zhengzhou Brother Furnace
Forecast units USD million in value
Report coverage Revenue and volume forecast, company share, competitive landscape, growth factors and trends

FAQ for this report

What is the and India Controlled Atmosphere Furnaces Market size in 2029?

Ans: The and India Controlled Atmosphere Furnaces Market size in 2029 will be US$ 532.5 million.

What is the market share of major companies in and India Controlled Atmosphere Furnaces Market?

Ans: The top five players hold a share about 45%.

What is the and India Controlled Atmosphere Furnaces Market share by region?

Ans: According to IMF (its July update to its World Economic Outlook), India’s GDP growth is projected at 6.1% in 2023, powered by domestic investment.

Who are the main players in the and India Controlled Atmosphere Furnaces Market report?

Ans: The main players in the and India Controlled Atmosphere Furnaces Market are Ipsen, DOWA Thermotech, SCHMID, KANTO YAKIN KOGYO, Aichelin Heat Treatment System, IVA Schmetz, Fengdong, TLON Technical Furnaces, Shichuang, BTU, Abbott Furnace, CARBOLITE GERO, Centorr Vacuum, MRF, Jiangsu KingkindIndustrial Furnace, Zhengzhou Brother Furnace

What are the Application segmentation covered in the and India Controlled Atmosphere Furnaces Market report?

Ans: The Applications covered in the and India Controlled Atmosphere Furnaces Market report are Laboratory, Metallurgical Industry, Automotive Industry, General Manufacturing, Others

What are the Type segmentation covered in the and India Controlled Atmosphere Furnaces Market report?

Ans: The Types covered in the and India Controlled Atmosphere Furnaces Market report are Horizontal, Vertical

1 Study Coverage
1.1 Controlled Atmosphere Furnaces Product Introduction
1.2 Global Controlled Atmosphere Furnaces Outlook 2018 VS 2022 VS 2029
1.2.1 Global Controlled Atmosphere Furnaces Sales in US$ Million for the Year 2018-2029
1.2.2 Global Controlled Atmosphere Furnaces Sales in Volume for the Year 2018-2029
1.3 India Controlled Atmosphere Furnaces Outlook 2018 VS 2022 VS 2029
1.3.1 India Controlled Atmosphere Furnaces Sales in US$ Million for the Year 2018-2029
1.3.2 India Controlled Atmosphere Furnaces Sales in Volume for the Year 2018-2029
1.4 Controlled Atmosphere Furnaces Market Size, India VS Global, 2018 VS 2022 VS 2029
1.4.1 The Market Share of India Controlled Atmosphere Furnaces in Global, 2018 VS 2022 VS 2029
1.4.2 The Growth Rate of Controlled Atmosphere Furnaces Market Size, India VS Global, 2018 VS 2022 VS 2029
1.5 Controlled Atmosphere Furnaces Market Dynamics
1.5.1 Controlled Atmosphere Furnaces Industry Trends
1.5.2 Controlled Atmosphere Furnaces Market Drivers
1.5.3 Controlled Atmosphere Furnaces Market Challenges
1.5.4 Controlled Atmosphere Furnaces Market Restraints
1.6 Study Objectives
1.7 Years Considered
1.8 Years Considered
2 Controlled Atmosphere Furnaces by Type
2.1 Controlled Atmosphere Furnaces Market Segment by Type
2.1.1 Horizontal
2.1.2 Vertical
2.2 Global Controlled Atmosphere Furnaces Market Size by Type
2.2.1 Global Controlled Atmosphere Furnaces Sales in Value, by Type (2018, 2022 & 2029)
2.2.2 Global Controlled Atmosphere Furnaces Sales in Volume, by Type (2018, 2022 & 2029)
2.2.3 Global Controlled Atmosphere Furnaces Average Selling Price (ASP) by Type (2018, 2022 & 2029)
2.3 India Controlled Atmosphere Furnaces Market Size by Type
2.3.1 India Controlled Atmosphere Furnaces Sales in Value, by Type (2018, 2022 & 2029)
2.3.2 India Controlled Atmosphere Furnaces Sales in Volume, by Type (2018, 2022 & 2029)
2.3.3 India Controlled Atmosphere Furnaces Average Selling Price (ASP) by Type (2018, 2022 & 2029)
3 Controlled Atmosphere Furnaces by Application
3.1 Controlled Atmosphere Furnaces Market Segment by Application
3.1.1 Laboratory
3.1.2 Metallurgical Industry
3.1.3 Automotive Industry
3.1.4 General Manufacturing
3.1.5 Others
3.2 Global Controlled Atmosphere Furnaces Market Size by Application
3.2.1 Global Controlled Atmosphere Furnaces Sales in Value, by Application (2018, 2022 & 2029)
3.2.2 Global Controlled Atmosphere Furnaces Sales in Volume, by Application (2018, 2022 & 2029)
3.3.3 Global Controlled Atmosphere Furnaces Average Selling Price (ASP) by Application (2018, 2022 & 2029)
3.3 India Controlled Atmosphere Furnaces Market Size by Application
3.3.1 India Controlled Atmosphere Furnaces Sales in Value, by Application (2018, 2022 & 2029)
3.3.2 India Controlled Atmosphere Furnaces Sales in Volume, by Application (2018, 2022 & 2029)
3.3.3 India Controlled Atmosphere Furnaces Average Selling Price (ASP) by Application (2018, 2022 & 2029)
4 Global Controlled Atmosphere Furnaces Competitor Landscape by Company
4.1 Global Controlled Atmosphere Furnaces Market Size by Company
4.1.1 Global Key Manufacturers of Controlled Atmosphere Furnaces, Ranked by Revenue (2022)
4.1.2 Global Controlled Atmosphere Furnaces Revenue by Manufacturer (2018-2023)
4.1.3 Global Controlled Atmosphere Furnaces Sales by Manufacturer (2018-2023)
4.1.4 Global Controlled Atmosphere Furnaces Price by Manufacturer (2018-2023)
4.2 Global Controlled Atmosphere Furnaces Concentration Ratio (CR)
4.2.1 Controlled Atmosphere Furnaces Market Concentration Ratio (CR)
4.2.2 Global Top 5 and Top 10 Largest Manufacturers of Controlled Atmosphere Furnaces in 2022
4.2.3 Global Controlled Atmosphere Furnaces Market Share by Company Type (Tier 1, Tier 2, and Tier 3)
4.3 Global Key Manufacturers of Controlled Atmosphere Furnaces, Manufacturing Base Distribution and Headquarters
4.4 Global Key Manufacturers of Controlled Atmosphere Furnaces, Product Offered and Application
4.5 Global Key Manufacturers of Controlled Atmosphere Furnaces, Date of Enter into This Industry
4.6 Manufacturers Mergers & Acquisitions, Expansion Plans
4.7 India Controlled Atmosphere Furnaces Market Size by Company
4.7.1 Key Players of Controlled Atmosphere Furnaces in India, Ranked by Revenue (2022)
4.7.2 India Controlled Atmosphere Furnaces Revenue by Players (2018-2023)
4.7.3 India Controlled Atmosphere Furnaces Sales by Players (2018-2023)
5 Global Controlled Atmosphere Furnaces Market Size by Region
5.1 Global Controlled Atmosphere Furnaces Market Size by Region: 2018 VS 2022 VS 2029
5.2 Global Controlled Atmosphere Furnaces Market Size in Volume by Region (2018-2029)
5.2.1 Global Controlled Atmosphere Furnaces Sales in Volume by Region: 2018-2023
5.2.2 Global Controlled Atmosphere Furnaces Sales in Volume Forecast by Region (2024-2029)
5.3 Global Controlled Atmosphere Furnaces Market Size in Value by Region (2018-2029)
5.3.1 Global Controlled Atmosphere Furnaces Sales in Value by Region: 2018-2023
5.3.2 Global Controlled Atmosphere Furnaces Sales in Value by Region: 2024-2029
6 Americas
6.1 Americas Controlled Atmosphere Furnaces Market Size YoY Growth 2018-2029
6.2 Americas Controlled Atmosphere Furnaces Sales in Volume, by Type (2018, 2022 & 2029)
6.3 Americas Controlled Atmosphere Furnaces Sales in Volume, by Application (2018, 2022 & 2029)
6.4 Americas Controlled Atmosphere Furnaces Market Facts & Figures by Country (2018, 2022 & 2029)
6.4.1 Americas Controlled Atmosphere Furnaces Sales in Value by Country (2018, 2022 & 2029)
6.4.2 Americas Controlled Atmosphere Furnaces Sales in Volume by Country (2018, 2022 & 2029)
6.4.3 United States
6.4.4 Canada
6.4.5 Mexico
6.4.6 Brazil
7 EMEA
7.1 EMEA Controlled Atmosphere Furnaces Market Size YoY Growth 2018-2029
7.2 EMEA Controlled Atmosphere Furnaces Sales in Volume, by Type (2018, 2022 & 2029)
7.3 EMEA Controlled Atmosphere Furnaces Sales in Volume, by Application (2018, 2022 & 2029)
7.4 EMEA Controlled Atmosphere Furnaces Market Facts & Figures by Country (2018, 2022 & 2029)
7.4.1 EMEA Controlled Atmosphere Furnaces Sales in Value by Country (2018, 2022 & 2029)
7.4.2 EMEA Controlled Atmosphere Furnaces Sales in Volume by Country (2018, 2022 & 2029)
7.4.3 Europe
7.4.4 Middle East
7.4.5 Africa
8 China
8.1 China Controlled Atmosphere Furnaces Market Size YoY Growth 2018-2029
8.2 China Controlled Atmosphere Furnaces Sales in Volume, by Type (2018, 2022 & 2029)
8.3 China Controlled Atmosphere Furnaces Sales in Volume, by Application (2018, 2022 & 2029)
9 APAC
9.1 APAC Controlled Atmosphere Furnaces Market Size YoY Growth 2018-2029
9.2 APAC Controlled Atmosphere Furnaces Sales in Volume, by Type (2018, 2022 & 2029)
9.3 APAC Controlled Atmosphere Furnaces Sales in Volume, by Application (2018, 2022 & 2029)
9.4 APAC Controlled Atmosphere Furnaces Market Facts & Figures by Region (2018, 2022 & 2029)
9.4.1 APAC Controlled Atmosphere Furnaces Sales in Value by Region (2018, 2022 & 2029)
9.4.2 APAC Controlled Atmosphere Furnaces Sales in Volume by Region (2018, 2022 & 2029)
9.4.3 Japan
9.4.4 South Korea
9.4.5 China Taiwan
9.4.6 Southeast Asia
9.4.7 India
10 Company Profiles
10.1 Ipsen
10.1.1 Ipsen Company Information
10.1.2 Ipsen Description and Business Overview
10.1.3 Ipsen Controlled Atmosphere Furnaces Sales, Revenue and Gross Margin (2018-2023)
10.1.4 Ipsen Controlled Atmosphere Furnaces Products Offered
10.1.5 Ipsen Recent Development
10.2 DOWA Thermotech
10.2.1 DOWA Thermotech Company Information
10.2.2 DOWA Thermotech Description and Business Overview
10.2.3 DOWA Thermotech Controlled Atmosphere Furnaces Sales, Revenue and Gross Margin (2018-2023)
10.2.4 DOWA Thermotech Controlled Atmosphere Furnaces Products Offered
10.2.5 DOWA Thermotech Recent Development
10.3 SCHMID
10.3.1 SCHMID Company Information
10.3.2 SCHMID Description and Business Overview
10.3.3 SCHMID Controlled Atmosphere Furnaces Sales, Revenue and Gross Margin (2018-2023)
10.3.4 SCHMID Controlled Atmosphere Furnaces Products Offered
10.3.5 SCHMID Recent Development
10.4 KANTO YAKIN KOGYO
10.4.1 KANTO YAKIN KOGYO Company Information
10.4.2 KANTO YAKIN KOGYO Description and Business Overview
10.4.3 KANTO YAKIN KOGYO Controlled Atmosphere Furnaces Sales, Revenue and Gross Margin (2018-2023)
10.4.4 KANTO YAKIN KOGYO Controlled Atmosphere Furnaces Products Offered
10.4.5 KANTO YAKIN KOGYO Recent Development
10.5 Aichelin Heat Treatment System
10.5.1 Aichelin Heat Treatment System Company Information
10.5.2 Aichelin Heat Treatment System Description and Business Overview
10.5.3 Aichelin Heat Treatment System Controlled Atmosphere Furnaces Sales, Revenue and Gross Margin (2018-2023)
10.5.4 Aichelin Heat Treatment System Controlled Atmosphere Furnaces Products Offered
10.5.5 Aichelin Heat Treatment System Recent Development
10.6 IVA Schmetz
10.6.1 IVA Schmetz Company Information
10.6.2 IVA Schmetz Description and Business Overview
10.6.3 IVA Schmetz Controlled Atmosphere Furnaces Sales, Revenue and Gross Margin (2018-2023)
10.6.4 IVA Schmetz Controlled Atmosphere Furnaces Products Offered
10.6.5 IVA Schmetz Recent Development
10.7 Fengdong
10.7.1 Fengdong Company Information
10.7.2 Fengdong Description and Business Overview
10.7.3 Fengdong Controlled Atmosphere Furnaces Sales, Revenue and Gross Margin (2018-2023)
10.7.4 Fengdong Controlled Atmosphere Furnaces Products Offered
10.7.5 Fengdong Recent Development
10.8 TLON Technical Furnaces
10.8.1 TLON Technical Furnaces Company Information
10.8.2 TLON Technical Furnaces Description and Business Overview
10.8.3 TLON Technical Furnaces Controlled Atmosphere Furnaces Sales, Revenue and Gross Margin (2018-2023)
10.8.4 TLON Technical Furnaces Controlled Atmosphere Furnaces Products Offered
10.8.5 TLON Technical Furnaces Recent Development
10.9 Shichuang
10.9.1 Shichuang Company Information
10.9.2 Shichuang Description and Business Overview
10.9.3 Shichuang Controlled Atmosphere Furnaces Sales, Revenue and Gross Margin (2018-2023)
10.9.4 Shichuang Controlled Atmosphere Furnaces Products Offered
10.9.5 Shichuang Recent Development
10.10 BTU
10.10.1 BTU Company Information
10.10.2 BTU Description and Business Overview
10.10.3 BTU Controlled Atmosphere Furnaces Sales, Revenue and Gross Margin (2018-2023)
10.10.4 BTU Controlled Atmosphere Furnaces Products Offered
10.10.5 BTU Recent Development
10.11 Abbott Furnace
10.11.1 Abbott Furnace Company Information
10.11.2 Abbott Furnace Description and Business Overview
10.11.3 Abbott Furnace Controlled Atmosphere Furnaces Sales, Revenue and Gross Margin (2018-2023)
10.11.4 Abbott Furnace Controlled Atmosphere Furnaces Products Offered
10.11.5 Abbott Furnace Recent Development
10.12 CARBOLITE GERO
10.12.1 CARBOLITE GERO Company Information
10.12.2 CARBOLITE GERO Description and Business Overview
10.12.3 CARBOLITE GERO Controlled Atmosphere Furnaces Sales, Revenue and Gross Margin (2018-2023)
10.12.4 CARBOLITE GERO Controlled Atmosphere Furnaces Products Offered
10.12.5 CARBOLITE GERO Recent Development
10.13 Centorr Vacuum
10.13.1 Centorr Vacuum Company Information
10.13.2 Centorr Vacuum Description and Business Overview
10.13.3 Centorr Vacuum Controlled Atmosphere Furnaces Sales, Revenue and Gross Margin (2018-2023)
10.13.4 Centorr Vacuum Controlled Atmosphere Furnaces Products Offered
10.13.5 Centorr Vacuum Recent Development
10.14 MRF
10.14.1 MRF Company Information
10.14.2 MRF Description and Business Overview
10.14.3 MRF Controlled Atmosphere Furnaces Sales, Revenue and Gross Margin (2018-2023)
10.14.4 MRF Controlled Atmosphere Furnaces Products Offered
10.14.5 MRF Recent Development
10.15 Jiangsu KingkindIndustrial Furnace
10.15.1 Jiangsu KingkindIndustrial Furnace Company Information
10.15.2 Jiangsu KingkindIndustrial Furnace Description and Business Overview
10.15.3 Jiangsu KingkindIndustrial Furnace Controlled Atmosphere Furnaces Sales, Revenue and Gross Margin (2018-2023)
10.15.4 Jiangsu KingkindIndustrial Furnace Controlled Atmosphere Furnaces Products Offered
10.15.5 Jiangsu KingkindIndustrial Furnace Recent Development
10.16 Zhengzhou Brother Furnace
10.16.1 Zhengzhou Brother Furnace Company Information
10.16.2 Zhengzhou Brother Furnace Description and Business Overview
10.16.3 Zhengzhou Brother Furnace Controlled Atmosphere Furnaces Sales, Revenue and Gross Margin (2018-2023)
10.16.4 Zhengzhou Brother Furnace Controlled Atmosphere Furnaces Products Offered
10.16.5 Zhengzhou Brother Furnace Recent Development
11 Industry Chain and Sales Channels Analysis
11.1 Controlled Atmosphere Furnaces Industry Chain Analysis
11.2 Controlled Atmosphere Furnaces Key Raw Materials
11.2.1 Key Raw Materials
11.2.2 Raw Materials Key Suppliers
11.3 Controlled Atmosphere Furnaces Production Mode & Process
11.4 Controlled Atmosphere Furnaces Sales and Marketing
11.4.1 Controlled Atmosphere Furnaces Sales Channels
11.4.2 Controlled Atmosphere Furnaces Distributors
11.5 Controlled Atmosphere Furnaces Customers
12 Research Findings and Conclusion
13 Appendix
13.1 Research Methodology
13.1.1 Methodology/Research Approach
13.1.2 Data Source
13.2 Author Details
13.3 Disclaimer
List of Tables
    Table 1. Controlled Atmosphere Furnaces CAGR in Value, India VS Global, 2018 VS 2022 VS 2029
    Table 2. Controlled Atmosphere Furnaces Market Trends
    Table 3. Controlled Atmosphere Furnaces Market Drivers
    Table 4. Controlled Atmosphere Furnaces Market Challenges
    Table 5. Controlled Atmosphere Furnaces Market Restraints
    Table 6. Global Controlled Atmosphere Furnaces Sales Growth Rate (CAGR) by Type: 2018 VS 2022 VS 2029 (US$ Million)
    Table 7. India Controlled Atmosphere Furnaces Sales Growth Rate (CAGR) by Type: 2018 VS 2022 VS 2029 (US$ Million)
    Table 8. Global Controlled Atmosphere Furnaces Sales Growth Rate (CAGR) by Application: 2018 VS 2022 VS 2029 (US$ Million)
    Table 9. India Controlled Atmosphere Furnaces Sales Growth Rate (CAGR) by Application: 2018 VS 2022 VS 2029 (US$ Million)
    Table 10. Global Key Manufacturers of Controlled Atmosphere Furnaces, Ranked by Revenue (2022) & (US$ Million)
    Table 11. Global Controlled Atmosphere Furnaces Revenue by Manufacturer, (US$ Million), 2018-2023
    Table 12. Global Controlled Atmosphere Furnaces Revenue Share by Manufacturer, 2018-2023
    Table 13. Global Controlled Atmosphere Furnaces Sales by Manufacturer, (Units), 2018-2023
    Table 14. Global Controlled Atmosphere Furnaces Sales Share by Manufacturer, 2018-2023
    Table 15. Global Controlled Atmosphere Furnaces Price by Manufacturer (2018-2023) & (K USD/Unit)
    Table 16. Global Controlled Atmosphere Furnaces Manufacturers Market Concentration Ratio (CR5 and HHI)
    Table 17. Global Controlled Atmosphere Furnaces by Company Type (Tier 1, Tier 2, and Tier 3) & (based on the Revenue in Controlled Atmosphere Furnaces as of 2022)
    Table 18. Global Key Manufacturers of Controlled Atmosphere Furnaces, Manufacturing Base Distribution and Headquarters
    Table 19. Global Key Manufacturers of Controlled Atmosphere Furnaces, Product Offered and Application
    Table 20. Global Key Manufacturers of Controlled Atmosphere Furnaces, Date of Enter into This Industry
    Table 21. Manufacturers Mergers & Acquisitions, Expansion Plans
    Table 22. Key Players of Controlled Atmosphere Furnaces in India, Ranked by Revenue (2022) & (US$ million)
    Table 23. India Controlled Atmosphere Furnaces Revenue by Players, (US$ Million), (2018-2023)
    Table 24. India Controlled Atmosphere Furnaces Revenue Share by Players, (2018-2023)
    Table 25. India Controlled Atmosphere Furnaces Sales by Players, (Units), (2018-2023)
    Table 26. India Controlled Atmosphere Furnaces Sales Share by Players, (2018-2023)
    Table 27. Global Controlled Atmosphere Furnaces Market Size Growth Rate (CAGR) by Region (US$ Million): 2018 VS 2022 VS 2029
    Table 28. Global Controlled Atmosphere Furnaces Sales in Volume by Region (2018-2023) & (Units)
    Table 29. Global Controlled Atmosphere Furnaces Sales in Volume Forecast by Region (2024-2029) & (Units)
    Table 30. Global Controlled Atmosphere Furnaces Sales in Value by Region (2018-2023) & (US$ Million)
    Table 31. Global Controlled Atmosphere Furnaces Sales in Value Forecast by Region (2024-2029) & (US$ Million)
    Table 32. Americas Controlled Atmosphere Furnaces Market Size Growth Rate (CAGR) by Country (US$ Million): 2018 VS 2022 VS 2029
    Table 33. Americas Controlled Atmosphere Furnaces Sales in Value by Country (2018-2023) & (US$ Million)
    Table 34. Americas Controlled Atmosphere Furnaces Sales in Value by Country (2024-2029) & (US$ Million)
    Table 35. Americas Controlled Atmosphere Furnaces Sales in Volume by Country (2018-2023) & (Units)
    Table 36. Americas Controlled Atmosphere Furnaces Sales in Volume by Country (2024-2029) & (Units)
    Table 37. EMEA Controlled Atmosphere Furnaces Market Size Growth Rate (CAGR) by Country (US$ Million): 2018 VS 2022 VS 2029
    Table 38. EMEA Controlled Atmosphere Furnaces Sales in Value by Country (2018-2023) & (US$ Million)
    Table 39. EMEA Controlled Atmosphere Furnaces Sales in Value by Country (2024-2029) & (US$ Million)
    Table 40. EMEA Controlled Atmosphere Furnaces Sales in Volume by Country (2018-2023) & (Units)
    Table 41. EMEA Controlled Atmosphere Furnaces Sales in Volume by Country (2024-2029) & (Units)
    Table 42. APAC Controlled Atmosphere Furnaces Market Size Growth Rate (CAGR) by Country (US$ Million): 2018 VS 2022 VS 2029
    Table 43. APAC Controlled Atmosphere Furnaces Sales in Value by Country (2018-2023) & (US$ Million)
    Table 44. APAC Controlled Atmosphere Furnaces Sales in Value by Country (2024-2029) & (US$ Million)
    Table 45. APAC Controlled Atmosphere Furnaces Sales in Volume by Country (2018-2023) & (Units)
    Table 46. APAC Controlled Atmosphere Furnaces Sales in Volume by Country (2024-2029) & (Units)
    Table 47. Ipsen Company Information
    Table 48. Ipsen Description and Business Overview
    Table 49. Ipsen Controlled Atmosphere Furnaces Sales (Units), Revenue (US$ Million), Price (K USD/Unit) and Gross Margin (2018-2023)
    Table 50. Ipsen Controlled Atmosphere Furnaces Product
    Table 51. Ipsen Recent Development
    Table 52. DOWA Thermotech Company Information
    Table 53. DOWA Thermotech Description and Business Overview
    Table 54. DOWA Thermotech Controlled Atmosphere Furnaces Sales (Units), Revenue (US$ Million), Price (K USD/Unit) and Gross Margin (2018-2023)
    Table 55. DOWA Thermotech Controlled Atmosphere Furnaces Product
    Table 56. DOWA Thermotech Recent Development
    Table 57. SCHMID Company Information
    Table 58. SCHMID Description and Business Overview
    Table 59. SCHMID Controlled Atmosphere Furnaces Sales (Units), Revenue (US$ Million), Price (K USD/Unit) and Gross Margin (2018-2023)
    Table 60. SCHMID Controlled Atmosphere Furnaces Product
    Table 61. SCHMID Recent Development
    Table 62. KANTO YAKIN KOGYO Company Information
    Table 63. KANTO YAKIN KOGYO Description and Business Overview
    Table 64. KANTO YAKIN KOGYO Controlled Atmosphere Furnaces Sales (Units), Revenue (US$ Million), Price (K USD/Unit) and Gross Margin (2018-2023)
    Table 65. KANTO YAKIN KOGYO Controlled Atmosphere Furnaces Product
    Table 66. KANTO YAKIN KOGYO Recent Development
    Table 67. Aichelin Heat Treatment System Company Information
    Table 68. Aichelin Heat Treatment System Description and Business Overview
    Table 69. Aichelin Heat Treatment System Controlled Atmosphere Furnaces Sales (Units), Revenue (US$ Million), Price (K USD/Unit) and Gross Margin (2018-2023)
    Table 70. Aichelin Heat Treatment System Controlled Atmosphere Furnaces Product
    Table 71. Aichelin Heat Treatment System Recent Development
    Table 72. IVA Schmetz Company Information
    Table 73. IVA Schmetz Description and Business Overview
    Table 74. IVA Schmetz Controlled Atmosphere Furnaces Sales (Units), Revenue (US$ Million), Price (K USD/Unit) and Gross Margin (2018-2023)
    Table 75. IVA Schmetz Controlled Atmosphere Furnaces Product
    Table 76. IVA Schmetz Recent Development
    Table 77. Fengdong Company Information
    Table 78. Fengdong Description and Business Overview
    Table 79. Fengdong Controlled Atmosphere Furnaces Sales (Units), Revenue (US$ Million), Price (K USD/Unit) and Gross Margin (2018-2023)
    Table 80. Fengdong Controlled Atmosphere Furnaces Product
    Table 81. Fengdong Recent Development
    Table 82. TLON Technical Furnaces Company Information
    Table 83. TLON Technical Furnaces Description and Business Overview
    Table 84. TLON Technical Furnaces Controlled Atmosphere Furnaces Sales (Units), Revenue (US$ Million), Price (K USD/Unit) and Gross Margin (2018-2023)
    Table 85. TLON Technical Furnaces Controlled Atmosphere Furnaces Product
    Table 86. TLON Technical Furnaces Recent Development
    Table 87. Shichuang Company Information
    Table 88. Shichuang Description and Business Overview
    Table 89. Shichuang Controlled Atmosphere Furnaces Sales (Units), Revenue (US$ Million), Price (K USD/Unit) and Gross Margin (2018-2023)
    Table 90. Shichuang Controlled Atmosphere Furnaces Product
    Table 91. Shichuang Recent Development
    Table 92. BTU Company Information
    Table 93. BTU Description and Business Overview
    Table 94. BTU Controlled Atmosphere Furnaces Sales (Units), Revenue (US$ Million), Price (K USD/Unit) and Gross Margin (2018-2023)
    Table 95. BTU Controlled Atmosphere Furnaces Product
    Table 96. BTU Recent Development
    Table 97. Abbott Furnace Company Information
    Table 98. Abbott Furnace Description and Business Overview
    Table 99. Abbott Furnace Controlled Atmosphere Furnaces Sales (Units), Revenue (US$ Million), Price (K USD/Unit) and Gross Margin (2018-2023)
    Table 100. Abbott Furnace Controlled Atmosphere Furnaces Product
    Table 101. Abbott Furnace Recent Development
    Table 102. CARBOLITE GERO Company Information
    Table 103. CARBOLITE GERO Description and Business Overview
    Table 104. CARBOLITE GERO Controlled Atmosphere Furnaces Sales (Units), Revenue (US$ Million), Price (K USD/Unit) and Gross Margin (2018-2023)
    Table 105. CARBOLITE GERO Controlled Atmosphere Furnaces Product
    Table 106. CARBOLITE GERO Recent Development
    Table 107. Centorr Vacuum Company Information
    Table 108. Centorr Vacuum Description and Business Overview
    Table 109. Centorr Vacuum Controlled Atmosphere Furnaces Sales (Units), Revenue (US$ Million), Price (K USD/Unit) and Gross Margin (2018-2023)
    Table 110. Centorr Vacuum Controlled Atmosphere Furnaces Product
    Table 111. Centorr Vacuum Recent Development
    Table 112. MRF Company Information
    Table 113. MRF Description and Business Overview
    Table 114. MRF Controlled Atmosphere Furnaces Sales (Units), Revenue (US$ Million), Price (K USD/Unit) and Gross Margin (2018-2023)
    Table 115. MRF Controlled Atmosphere Furnaces Product
    Table 116. MRF Recent Development
    Table 117. Jiangsu KingkindIndustrial Furnace Company Information
    Table 118. Jiangsu KingkindIndustrial Furnace Description and Business Overview
    Table 119. Jiangsu KingkindIndustrial Furnace Controlled Atmosphere Furnaces Sales (Units), Revenue (US$ Million), Price (K USD/Unit) and Gross Margin (2018-2023)
    Table 120. Jiangsu KingkindIndustrial Furnace Controlled Atmosphere Furnaces Product
    Table 121. Jiangsu KingkindIndustrial Furnace Recent Development
    Table 122. Zhengzhou Brother Furnace Company Information
    Table 123. Zhengzhou Brother Furnace Description and Business Overview
    Table 124. Zhengzhou Brother Furnace Controlled Atmosphere Furnaces Sales (Units), Revenue (US$ Million), Price (K USD/Unit) and Gross Margin (2018-2023)
    Table 125. Zhengzhou Brother Furnace Controlled Atmosphere Furnaces Product
    Table 126. Zhengzhou Brother Furnace Recent Development
    Table 127. Key Raw Materials Lists
    Table 128. Raw Materials Key Suppliers Lists
    Table 129. Controlled Atmosphere Furnaces Customers List
    Table 130. Controlled Atmosphere Furnaces Distributors List
    Table 131. Research Programs/Design for This Report
    Table 132. Key Data Information from Secondary Sources
    Table 133. Key Data Information from Primary Sources
List of Figures
    Figure 1. Controlled Atmosphere Furnaces Product Picture
    Figure 2. Global Controlled Atmosphere Furnaces Revenue, (US$ Million), 2018 VS 2022 VS 2029
    Figure 3. Global Controlled Atmosphere Furnaces Market Size 2018-2029 (US$ Million)
    Figure 4. Global Controlled Atmosphere Furnaces Sales 2018-2029 (Units)
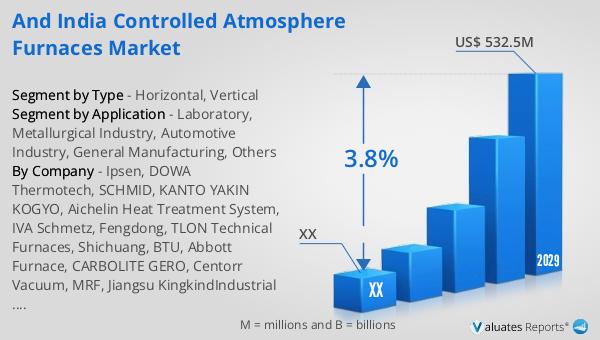
    Figure 5. India Controlled Atmosphere Furnaces Revenue, (US$ Million), 2018 VS 2022 VS 2029
    Figure 6. India Controlled Atmosphere Furnaces Market Size 2018-2029 (US$ Million)
    Figure 7. India Controlled Atmosphere Furnaces Sales 2018-2029 (Units)
    Figure 8. India Controlled Atmosphere Furnaces Market Share in Global, in Value (US$ Million) 2018-2029
    Figure 9. India Controlled Atmosphere Furnaces Market Share in Global, in Volume (Units) 2018-2029
    Figure 10. Controlled Atmosphere Furnaces Report Years Considered
    Figure 11. Product Picture of Horizontal
    Figure 12. Product Picture of Vertical
    Figure 13. Global Controlled Atmosphere Furnaces Market Share by Type in 2022 & 2029
    Figure 14. Global Controlled Atmosphere Furnaces Sales in Value by Type (2018-2029) & (US$ Million)
    Figure 15. Global Controlled Atmosphere Furnaces Sales Market Share in Value by Type (2018-2029)
    Figure 16. Global Controlled Atmosphere Furnaces Sales by Type (2018-2029) & (Units)
    Figure 17. Global Controlled Atmosphere Furnaces Sales Market Share in Volume by Type (2018-2029)
    Figure 18. Global Controlled Atmosphere Furnaces Price by Type (2018-2029) & (K USD/Unit)
    Figure 19. India Controlled Atmosphere Furnaces Market Share by Type in 2022 & 2029
    Figure 20. India Controlled Atmosphere Furnaces Sales in Value by Type (2018-2029) & (US$ Million)
    Figure 21. India Controlled Atmosphere Furnaces Sales Market Share in Value by Type (2018-2029)
    Figure 22. India Controlled Atmosphere Furnaces Sales by Type (2018-2029) & (Units)
    Figure 23. India Controlled Atmosphere Furnaces Sales Market Share in Volume by Type (2018-2029)
    Figure 24. India Controlled Atmosphere Furnaces Price by Type (2018-2029) & (K USD/Unit)
    Figure 25. Product Picture of Laboratory
    Figure 26. Product Picture of Metallurgical Industry
    Figure 27. Product Picture of Automotive Industry
    Figure 28. Product Picture of General Manufacturing
    Figure 29. Product Picture of Others
    Figure 30. Global Controlled Atmosphere Furnaces Market Share by Application in 2022 & 2029
    Figure 31. Global Controlled Atmosphere Furnaces Sales in Value by Application (2018-2029) & (US$ Million)
    Figure 32. Global Controlled Atmosphere Furnaces Sales Market Share in Value by Application (2018-2029)
    Figure 33. Global Controlled Atmosphere Furnaces Sales by Application (2018-2029) & (Units)
    Figure 34. Global Controlled Atmosphere Furnaces Sales Market Share in Volume by Application (2018-2029)
    Figure 35. Global Controlled Atmosphere Furnaces Price by Application (2018-2029) & (K USD/Unit)
    Figure 36. India Controlled Atmosphere Furnaces Market Share by Application in 2022 & 2029
    Figure 37. India Controlled Atmosphere Furnaces Sales in Value by Application (2018-2029) & (US$ Million)
    Figure 38. India Controlled Atmosphere Furnaces Sales Market Share in Value by Application (2018-2029)
    Figure 39. India Controlled Atmosphere Furnaces Sales by Application (2018-2029) & (Units)
    Figure 40. India Controlled Atmosphere Furnaces Sales Market Share in Volume by Application (2018-2029)
    Figure 41. India Controlled Atmosphere Furnaces Price by Application (2018-2029) & (K USD/Unit)
    Figure 42. Americas Controlled Atmosphere Furnaces Sales in Volume Growth Rate 2018-2029 (Units)
    Figure 43. Americas Controlled Atmosphere Furnaces Sales in Value Growth Rate 2018-2029 (US$ Million)
    Figure 44. Americas Controlled Atmosphere Furnaces Sales by Type (2018-2029) & (Units)
    Figure 45. Americas Controlled Atmosphere Furnaces Sales Market Share in Volume by Type (2018-2029)
    Figure 46. Americas Controlled Atmosphere Furnaces Sales by Application (2018-2029) & (Units)
    Figure 47. Americas Controlled Atmosphere Furnaces Sales Market Share in Volume by Application (2018-2029)
    Figure 48. United States Controlled Atmosphere Furnaces Sales in Value Growth Rate (2018-2029) & (US$ Million)
    Figure 49. Canada Controlled Atmosphere Furnaces Sales in Value Growth Rate (2018-2029) & (US$ Million)
    Figure 50. Mexico Controlled Atmosphere Furnaces Sales in Value Growth Rate (2018-2029) & (US$ Million)
    Figure 51. Brazil Controlled Atmosphere Furnaces Sales in Value Growth Rate (2018-2029) & (US$ Million)
    Figure 52. EMEA Controlled Atmosphere Furnaces Sales in Volume Growth Rate 2018-2029 (Units)
    Figure 53. EMEA Controlled Atmosphere Furnaces Sales in Value Growth Rate 2018-2029 (US$ Million)
    Figure 54. EMEA Controlled Atmosphere Furnaces Sales by Type (2018-2029) & (Units)
    Figure 55. EMEA Controlled Atmosphere Furnaces Sales Market Share in Volume by Type (2018-2029)
    Figure 56. EMEA Controlled Atmosphere Furnaces Sales by Application (2018-2029) & (Units)
    Figure 57. EMEA Controlled Atmosphere Furnaces Sales Market Share in Volume by Application (2018-2029)
    Figure 58. Europe Controlled Atmosphere Furnaces Sales in Value Growth Rate (2018-2029) & (US$ Million)
    Figure 59. Middle East Controlled Atmosphere Furnaces Sales in Value Growth Rate (2018-2029) & (US$ Million)
    Figure 60. Africa Controlled Atmosphere Furnaces Sales in Value Growth Rate (2018-2029) & (US$ Million)
    Figure 61. China Controlled Atmosphere Furnaces Sales in Volume Growth Rate 2018-2029 (Units)
    Figure 62. China Controlled Atmosphere Furnaces Sales in Value Growth Rate 2018-2029 (US$ Million)
    Figure 63. China Controlled Atmosphere Furnaces Sales by Type (2018-2029) & (Units)
    Figure 64. China Controlled Atmosphere Furnaces Sales Market Share in Volume by Type (2018-2029)
    Figure 65. China Controlled Atmosphere Furnaces Sales by Application (2018-2029) & (Units)
    Figure 66. China Controlled Atmosphere Furnaces Sales Market Share in Volume by Application (2018-2029)
    Figure 67. APAC Controlled Atmosphere Furnaces Sales in Volume Growth Rate 2018-2029 (Units)
    Figure 68. APAC Controlled Atmosphere Furnaces Sales in Value Growth Rate 2018-2029 (US$ Million)
    Figure 69. APAC Controlled Atmosphere Furnaces Sales by Type (2018-2029) & (Units)
    Figure 70. APAC Controlled Atmosphere Furnaces Sales Market Share in Volume by Type (2018-2029)
    Figure 71. APAC Controlled Atmosphere Furnaces Sales by Application (2018-2029) & (Units)
    Figure 72. APAC Controlled Atmosphere Furnaces Sales Market Share in Volume by Application (2018-2029)
    Figure 73. Japan Controlled Atmosphere Furnaces Sales in Value Growth Rate (2018-2029) & (US$ Million)
    Figure 74. South Korea Controlled Atmosphere Furnaces Sales in Value Growth Rate (2018-2029) & (US$ Million)
    Figure 75. China Taiwan Controlled Atmosphere Furnaces Sales in Value Growth Rate (2018-2029) & (US$ Million)
    Figure 76. Southeast Asia Controlled Atmosphere Furnaces Sales in Value Growth Rate (2018-2029) & (US$ Million)
    Figure 77. India Controlled Atmosphere Furnaces Sales in Value Growth Rate (2018-2029) & (US$ Million)
    Figure 78. Controlled Atmosphere Furnaces Value Chain
    Figure 79. Controlled Atmosphere Furnaces Production Process
    Figure 80. Channels of Distribution
    Figure 81. Distributors Profiles
    Figure 82. Bottom-up and Top-down Approaches for This Report
    Figure 83. Data Triangulation
    Figure 84. Key Executives Interviewed
SELECT A FORMAT
Added to Cart
Electronic (PDF)

$4350

This license allows only one user to access the PDF.
Electronic (PDF)

$6525

This license allows 1 - 5 user to access the PDF, license is suitable for small groups of 5 users working together
Electronic (PDF)

$8700

This license allows users/teams in a same Enterprise to use this report, various departments within an enterpise can use this report
Add to Cart
Buy Now (15% Discount)

OUR CUSTOMER

SIS Group of Schools

SIMILAR REPORTS


RELATED REPORTS

Global Reducer Elbows Market Research Report 2025

120 Pages
Type: Report
Code: QYRE-Auto-35L19946
Wed Dec 03 00:00:00 UTC 2025

Add to Cart

Global High-Pressure Breathing Air Compressor for Diving and Firefighting Applications Market Research Report 2025

120 Pages
Type: Report
Code: QYRE-Auto-2K20269
Wed Dec 03 00:00:00 UTC 2025

Add to Cart

Global Steam Trap Valve Market Research Report 2025

120 Pages
Type: Report
Code: QYRE-Auto-37H9442
Wed Dec 03 00:00:00 UTC 2025

Add to Cart

Global Consumer-grade IP Robots Market Research Report 2025

120 Pages
Type: Report
Code: QYRE-Auto-21L19992
Wed Dec 03 00:00:00 UTC 2025

Add to Cart