List of Tables
Table 1. Global Mine Restoration Market Size Growth Rate by Type (US$ Million): 2021 vs 2025 vs 2032
Table 2. Key Players of Soil Base Improvement
Table 3. Key Players of Slope Treatment
Table 4. Key Players of Vegetation Restoration
Table 5. Key Players of Tailings Treatment
Table 6. Key Players of Water Restoration
Table 7. Key Players of Microbial Remediation
Table 8. Key Players of Others
Table 9. Global Mine Restoration Market Size Growth by Application (US$ Million): 2021 vs 2025 vs 2032
Table 10. Global Mine Restoration Market Size by Region (US$ Million): 2021 vs 2025 vs 2032
Table 11. Global Mine Restoration Market Size by Region (US$ Million), 2021–2026
Table 12. Global Mine Restoration Market Share by Region (2021–2026)
Table 13. Global Mine Restoration Forecasted Market Size by Region (US$ Million), 2027–2032
Table 14. Global Mine Restoration Market Share by Region (2027–2032)
Table 15. Mine Restoration Market Trends
Table 16. Mine Restoration Market Drivers
Table 17. Mine Restoration Market Challenges
Table 18. Mine Restoration Market Restraints
Table 19. Global Mine Restoration Revenue by Players (US$ Million), 2021–2026
Table 20. Global Mine Restoration Market Share by Players (2021–2026)
Table 21. Global Top Mine Restoration Players by Tier (Tier 1, Tier 2, and Tier 3), based on Mine Restoration Revenue, 2025
Table 22. Ranking of Global Top Mine Restoration Companies by Revenue (US$ Million) in 2025
Table 23. Global 5 Largest Players Market Share by Mine Restoration Revenue (CR5 and HHI), 2021–2026
Table 24. Global Key Players of Mine Restoration, Headquarters and Area Served
Table 25. Global Key Players of Mine Restoration, Products and Applications
Table 26. Global Key Players of Mine Restoration, Date of General Availability (GA)
Table 27. Mergers and Acquisitions, Expansion Plans
Table 28. Global Mine Restoration Market Size by Type (US$ Million), 2021–2026
Table 29. Global Mine Restoration Revenue Market Share by Type (2021–2026)
Table 30. Global Mine Restoration Forecasted Market Size by Type (US$ Million), 2027–2032
Table 31. Global Mine Restoration Revenue Market Share by Type (2027–2032)
Table 32. Global Mine Restoration Market Size by Application (US$ Million), 2021–2026
Table 33. Global Mine Restoration Revenue Market Share by Application (2021–2026)
Table 34. Global Mine Restoration Forecasted Market Size by Application (US$ Million), 2027–2032
Table 35. Global Mine Restoration Revenue Market Share by Application (2027–2032)
Table 36. North America Mine Restoration Market Size Growth Rate by Country (US$ Million): 2021 vs 2025 vs 2032
Table 37. North America Mine Restoration Market Size by Country (US$ Million), 2021–2026
Table 38. North America Mine Restoration Market Size by Country (US$ Million), 2027–2032
Table 39. Europe Mine Restoration Market Size Growth Rate by Country (US$ Million): 2021 vs 2025 vs 2032
Table 40. Europe Mine Restoration Market Size by Country (US$ Million), 2021–2026
Table 41. Europe Mine Restoration Market Size by Country (US$ Million), 2027–2032
Table 42. Asia-Pacific Mine Restoration Market Size Growth Rate by Region (US$ Million): 2021 vs 2025 vs 2032
Table 43. Asia-Pacific Mine Restoration Market Size by Region (US$ Million), 2021–2026
Table 44. Asia-Pacific Mine Restoration Market Size by Region (US$ Million), 2027–2032
Table 45. Latin America Mine Restoration Market Size Growth Rate by Country (US$ Million): 2021 vs 2025 vs 2032
Table 46. Latin America Mine Restoration Market Size by Country (US$ Million), 2021–2026
Table 47. Latin America Mine Restoration Market Size by Country (US$ Million), 2027–2032
Table 48. Middle East & Africa Mine Restoration Market Size Growth Rate by Country (US$ Million): 2021 vs 2025 vs 2032
Table 49. Middle East & Africa Mine Restoration Market Size by Country (US$ Million), 2021–2026
Table 50. Middle East & Africa Mine Restoration Market Size by Country (US$ Million), 2027–2032
Table 51. Ledcor Company Details
Table 52. Ledcor Business Overview
Table 53. Ledcor Mine Restoration Product
Table 54. Ledcor Revenue in Mine Restoration Business (US$ Million), 2021–2026
Table 55. Ledcor Recent Development
Table 56. Stantec Company Details
Table 57. Stantec Business Overview
Table 58. Stantec Mine Restoration Product
Table 59. Stantec Revenue in Mine Restoration Business (US$ Million), 2021–2026
Table 60. Stantec Recent Development
Table 61. Tetra Tech Company Details
Table 62. Tetra Tech Business Overview
Table 63. Tetra Tech Mine Restoration Product
Table 64. Tetra Tech Revenue in Mine Restoration Business (US$ Million), 2021–2026
Table 65. Tetra Tech Recent Development
Table 66. Zhongmei Dongfang Company Details
Table 67. Zhongmei Dongfang Business Overview
Table 68. Zhongmei Dongfang Mine Restoration Product
Table 69. Zhongmei Dongfang Revenue in Mine Restoration Business (US$ Million), 2021–2026
Table 70. Zhongmei Dongfang Recent Development
Table 71. BGE Company Details
Table 72. BGE Business Overview
Table 73. BGE Mine Restoration Product
Table 74. BGE Revenue in Mine Restoration Business (US$ Million), 2021–2026
Table 75. BGE Recent Development
Table 76. H2 Enterprises Company Details
Table 77. H2 Enterprises Business Overview
Table 78. H2 Enterprises Mine Restoration Product
Table 79. H2 Enterprises Revenue in Mine Restoration Business (US$ Million), 2021–2026
Table 80. H2 Enterprises Recent Development
Table 81. RECON (Keller Group) Company Details
Table 82. RECON (Keller Group) Business Overview
Table 83. RECON (Keller Group) Mine Restoration Product
Table 84. RECON (Keller Group) Revenue in Mine Restoration Business (US$ Million), 2021–2026
Table 85. RECON (Keller Group) Recent Development
Table 86. Shanxi Dadi Holding Company Details
Table 87. Shanxi Dadi Holding Business Overview
Table 88. Shanxi Dadi Holding Mine Restoration Product
Table 89. Shanxi Dadi Holding Revenue in Mine Restoration Business (US$ Million), 2021–2026
Table 90. Shanxi Dadi Holding Recent Development
Table 91. Spray Grass Australia Company Details
Table 92. Spray Grass Australia Business Overview
Table 93. Spray Grass Australia Mine Restoration Product
Table 94. Spray Grass Australia Revenue in Mine Restoration Business (US$ Million), 2021–2026
Table 95. Spray Grass Australia Recent Development
Table 96. ICL Company Details
Table 97. ICL Business Overview
Table 98. ICL Mine Restoration Product
Table 99. ICL Revenue in Mine Restoration Business (US$ Million), 2021–2026
Table 100. ICL Recent Development
Table 101. Aerospace Kaitian Company Details
Table 102. Aerospace Kaitian Business Overview
Table 103. Aerospace Kaitian Mine Restoration Product
Table 104. Aerospace Kaitian Revenue in Mine Restoration Business (US$ Million), 2021–2026
Table 105. Aerospace Kaitian Recent Development
Table 106. Zhongjieneng Company Details
Table 107. Zhongjieneng Business Overview
Table 108. Zhongjieneng Mine Restoration Product
Table 109. Zhongjieneng Revenue in Mine Restoration Business (US$ Million), 2021–2026
Table 110. Zhongjieneng Recent Development
Table 111. Dendra Systems Company Details
Table 112. Dendra Systems Business Overview
Table 113. Dendra Systems Mine Restoration Product
Table 114. Dendra Systems Revenue in Mine Restoration Business (US$ Million), 2021–2026
Table 115. Dendra Systems Recent Development
Table 116. Viridis Terra Innovations Company Details
Table 117. Viridis Terra Innovations Business Overview
Table 118. Viridis Terra Innovations Mine Restoration Product
Table 119. Viridis Terra Innovations Revenue in Mine Restoration Business (US$ Million), 2021–2026
Table 120. Viridis Terra Innovations Recent Development
Table 121. RPM Solutions Company Details
Table 122. RPM Solutions Business Overview
Table 123. RPM Solutions Mine Restoration Product
Table 124. RPM Solutions Revenue in Mine Restoration Business (US$ Million), 2021–2026
Table 125. RPM Solutions Recent Development
Table 126. Profile Company Details
Table 127. Profile Business Overview
Table 128. Profile Mine Restoration Product
Table 129. Profile Revenue in Mine Restoration Business (US$ Million), 2021–2026
Table 130. Profile Recent Development
Table 131. HydroGeoLogic (HGL) Company Details
Table 132. HydroGeoLogic (HGL) Business Overview
Table 133. HydroGeoLogic (HGL) Mine Restoration Product
Table 134. HydroGeoLogic (HGL) Revenue in Mine Restoration Business (US$ Million), 2021–2026
Table 135. HydroGeoLogic (HGL) Recent Development
Table 136. American Mine Services Company Details
Table 137. American Mine Services Business Overview
Table 138. American Mine Services Mine Restoration Product
Table 139. American Mine Services Revenue in Mine Restoration Business (US$ Million), 2021–2026
Table 140. American Mine Services Recent Development
Table 141. Alan Stone Company Company Details
Table 142. Alan Stone Company Business Overview
Table 143. Alan Stone Company Mine Restoration Product
Table 144. Alan Stone Company Revenue in Mine Restoration Business (US$ Million), 2021–2026
Table 145. Alan Stone Company Recent Development
Table 146. Misho Ecology & Landscape Company Details
Table 147. Misho Ecology & Landscape Business Overview
Table 148. Misho Ecology & Landscape Mine Restoration Product
Table 149. Misho Ecology & Landscape Revenue in Mine Restoration Business (US$ Million), 2021–2026
Table 150. Misho Ecology & Landscape Recent Development
Table 151. HeBei Huaqing Environment Technology Group Company Details
Table 152. HeBei Huaqing Environment Technology Group Business Overview
Table 153. HeBei Huaqing Environment Technology Group Mine Restoration Product
Table 154. HeBei Huaqing Environment Technology Group Revenue in Mine Restoration Business (US$ Million), 2021–2026
Table 155. HeBei Huaqing Environment Technology Group Recent Development
Table 156. Guojin Jianxin Company Details
Table 157. Guojin Jianxin Business Overview
Table 158. Guojin Jianxin Mine Restoration Product
Table 159. Guojin Jianxin Revenue in Mine Restoration Business (US$ Million), 2021–2026
Table 160. Guojin Jianxin Recent Development
Table 161. Research Programs/Design for This Report
Table 162. Key Data Information from Secondary Sources
Table 163. Key Data Information from Primary Sources
Table 164. Authors List of This Report
List of Figures
Figure 1. Mine Restoration Picture
Figure 2. Global Mine Restoration Market Size Comparison by Type (US$ Million), 2021–2032
Figure 3. Global Mine Restoration Market Share by Type: 2025 vs 2032
Figure 4. Soil Base Improvement Features
Figure 5. Slope Treatment Features
Figure 6. Vegetation Restoration Features
Figure 7. Tailings Treatment Features
Figure 8. Water Restoration Features
Figure 9. Microbial Remediation Features
Figure 10. Others Features
Figure 11. Global Mine Restoration Market Size by Application (US$ Million), 2021–2032
Figure 12. Global Mine Restoration Market Share by Application: 2025 vs 2032
Figure 13. Abandoned Mine Case Studies
Figure 14. Active Mine Case Studies
Figure 15. New Mine Case Studies
Figure 16. Mine Restoration Report Years Considered
Figure 17. Global Mine Restoration Market Size (US$ Million), Year-over-Year: 2021–2032
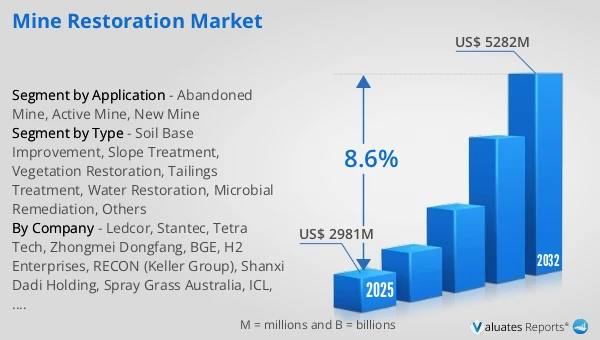
Figure 18. Global Mine Restoration Market Size, (US$ Million), 2021 vs 2025 vs 2032
Figure 19. Global Mine Restoration Market Share by Region: 2025 vs 2032
Figure 20. Global Mine Restoration Market Share by Players in 2025
Figure 21. Global Mine Restoration Market Share by Company Type (Tier 1, Tier 2, and Tier 3)
Figure 22. The Top 10 and 5 Players Market Share by Mine Restoration Revenue in 2025
Figure 23. North America Mine Restoration Market Size YoY Growth (US$ Million), 2021–2032
Figure 24. North America Mine Restoration Market Share by Country (2021–2032)
Figure 25. United States Mine Restoration Market Size YoY Growth (US$ Million), 2021–2032
Figure 26. Canada Mine Restoration Market Size YoY Growth (US$ Million), 2021–2032
Figure 27. Europe Mine Restoration Market Size YoY Growth (US$ Million), 2021–2032
Figure 28. Europe Mine Restoration Market Share by Country (2021–2032)
Figure 29. Germany Mine Restoration Market Size YoY Growth (US$ Million), 2021–2032
Figure 30. France Mine Restoration Market Size YoY Growth (US$ Million), 2021–2032
Figure 31. U.K. Mine Restoration Market Size YoY Growth (US$ Million), 2021–2032
Figure 32. Italy Mine Restoration Market Size YoY Growth (US$ Million), 2021–2032
Figure 33. Russia Mine Restoration Market Size YoY Growth (US$ Million), 2021–2032
Figure 34. Ireland Mine Restoration Market Size YoY Growth (US$ Million), 2021–2032
Figure 35. Asia-Pacific Mine Restoration Market Size YoY Growth (US$ Million), 2021–2032
Figure 36. Asia-Pacific Mine Restoration Market Share by Region (2021–2032)
Figure 37. China Mine Restoration Market Size YoY Growth (US$ Million), 2021–2032
Figure 38. Japan Mine Restoration Market Size YoY Growth (US$ Million), 2021–2032
Figure 39. South Korea Mine Restoration Market Size YoY Growth (US$ Million), 2021–2032
Figure 40. Southeast Asia Mine Restoration Market Size YoY Growth (US$ Million), 2021–2032
Figure 41. India Mine Restoration Market Size YoY Growth (US$ Million), 2021–2032
Figure 42. Australia & New Zealand Mine Restoration Market Size YoY Growth (US$ Million), 2021–2032
Figure 43. Latin America Mine Restoration Market Size YoY Growth (US$ Million), 2021–2032
Figure 44. Latin America Mine Restoration Market Share by Country (2021–2032)
Figure 45. Mexico Mine Restoration Market Size YoY Growth (US$ Million), 2021–2032
Figure 46. Brazil Mine Restoration Market Size YoY Growth (US$ Million), 2021–2032
Figure 47. Middle East & Africa Mine Restoration Market Size YoY Growth (US$ Million), 2021–2032
Figure 48. Middle East & Africa Mine Restoration Market Share by Country (2021–2032)
Figure 49. Israel Mine Restoration Market Size YoY Growth (US$ Million), 2021–2032
Figure 50. Saudi Arabia Mine Restoration Market Size YoY Growth (US$ Million), 2021–2032
Figure 51. UAE Mine Restoration Market Size YoY Growth (US$ Million), 2021–2032
Figure 52. Ledcor Revenue Growth Rate in Mine Restoration Business (2021–2026)
Figure 53. Stantec Revenue Growth Rate in Mine Restoration Business (2021–2026)
Figure 54. Tetra Tech Revenue Growth Rate in Mine Restoration Business (2021–2026)
Figure 55. Zhongmei Dongfang Revenue Growth Rate in Mine Restoration Business (2021–2026)
Figure 56. BGE Revenue Growth Rate in Mine Restoration Business (2021–2026)
Figure 57. H2 Enterprises Revenue Growth Rate in Mine Restoration Business (2021–2026)
Figure 58. RECON (Keller Group) Revenue Growth Rate in Mine Restoration Business (2021–2026)
Figure 59. Shanxi Dadi Holding Revenue Growth Rate in Mine Restoration Business (2021–2026)
Figure 60. Spray Grass Australia Revenue Growth Rate in Mine Restoration Business (2021–2026)
Figure 61. ICL Revenue Growth Rate in Mine Restoration Business (2021–2026)
Figure 62. Aerospace Kaitian Revenue Growth Rate in Mine Restoration Business (2021–2026)
Figure 63. Zhongjieneng Revenue Growth Rate in Mine Restoration Business (2021–2026)
Figure 64. Dendra Systems Revenue Growth Rate in Mine Restoration Business (2021–2026)
Figure 65. Viridis Terra Innovations Revenue Growth Rate in Mine Restoration Business (2021–2026)
Figure 66. RPM Solutions Revenue Growth Rate in Mine Restoration Business (2021–2026)
Figure 67. Profile Revenue Growth Rate in Mine Restoration Business (2021–2026)
Figure 68. HydroGeoLogic (HGL) Revenue Growth Rate in Mine Restoration Business (2021–2026)
Figure 69. American Mine Services Revenue Growth Rate in Mine Restoration Business (2021–2026)
Figure 70. Alan Stone Company Revenue Growth Rate in Mine Restoration Business (2021–2026)
Figure 71. Misho Ecology & Landscape Revenue Growth Rate in Mine Restoration Business (2021–2026)
Figure 72. HeBei Huaqing Environment Technology Group Revenue Growth Rate in Mine Restoration Business (2021–2026)
Figure 73. Guojin Jianxin Revenue Growth Rate in Mine Restoration Business (2021–2026)
Figure 74. Bottom-up and Top-down Approaches for This Report
Figure 75. Data Triangulation
Figure 76. Key Executives Interviewed