List of Tables
Table 1. Global Pond Liner Market Size Growth Rate by Type (US$ Million): 2020 VS 2024 VS 2031
Table 2. Global Pond Liner Market Size Growth by Application (US$ Million): 2020 VS 2024 VS 2031
Table 3. Global Pond Liner Market Size by Region (US$ Million): 2024 VS 2031
Table 4. Global Pond Liner Sales by Region (2020-2025) & (K sqm)
Table 5. Global Pond Liner Sales Forecast by Region (2026-2031) & (K sqm)
Table 6. Global Pond Liner Revenue by Region (2020-2025) & (US$ Million)
Table 7. Global Pond Liner Revenue Forecast by Region (2026-2031) & (US$ Million)
Table 8. Global Pond Liner Sales Volume by Type (2020-2025) & (K sqm)
Table 9. Global Pond Liner Sales Volume by Type (2026-2031) & (K sqm)
Table 10. Global Pond Liner Revenue by Type (2020-2025) & (US$ Million)
Table 11. Global Pond Liner Revenue Forecast by Type (2026-2031) & (US$ Million)
Table 12. Global Pond Liner Sales Volume by Application (2020-2025) & (K sqm)
Table 13. Global Pond Liner Sales Volume by Application (2026-2031) & (K sqm)
Table 14. Global Pond Liner Revenue by Application (2020-2025) & (US$ Million)
Table 15. Global Pond Liner Revenue by Application (2026-2031) & (US$ Million)
Table 16. Global Pond Liner Sales by Manufacturer (2020-2025) & (K sqm)
Table 17. Global Pond Liner Sales Share by Manufacturer (2020-2025)
Table 18. Pond Liner Revenue by Manufacturer (2020-2025) & (US$ Million)
Table 19. Pond Liner Revenue Share by Manufacturer (2020-2025)
Table 20. Key Manufacturers Pond Liner Price (2020-2025) & (USD/sqm)
Table 21. Ranking of Global Top Pond Liner Manufacturers by Revenue (US$ Million) in 2024
Table 22. Global Pond Liner Manufacturers Market Concentration Ratio (CR5 and HHI) & (2020-2025)
Table 23. Global Pond Liner by Company Type (Tier 1, Tier 2, and Tier 3) & (based on the Revenue in Pond Liner as of 2024)
Table 24. Pond Liner Manufacturers Manufacturing Base Distribution and Headquarters
Table 25. Date of International Manufacturers Enter into Pond Liner Market
Table 26. Manufacturers Pond Liner Product Type and Application
Table 27. Manufacturers Mergers & Acquisitions, Expansion Plans
Table 28. GSE Holding Company Information
Table 29. GSE Holding Description and Business Overview
Table 30. GSE Holding Pond Liner Product
Table 31. GSE Holding Pond Liner Sales (K sqm), Revenue (US$ Million), Price (USD/sqm) and Gross Margin (2020-2025)
Table 32. GSE Holding Sales Proportion of Pond Liner by Product in 2024
Table 33. GSE Holding Sales Proportion of Pond Liner by Application in 2024
Table 34. GSE Holding Sales Proportion of Pond Liner by Geographic Area in 2024
Table 35. GSE Holding Recent Developments
Table 36. AGRU Company Information
Table 37. AGRU Description and Business Overview
Table 38. AGRU Pond Liner Product
Table 39. AGRU Pond Liner Sales (K sqm), Revenue (US$ Million), Price (USD/sqm) and Gross Margin (2020-2025)
Table 40. AGRU Sales Proportion of Pond Liner by Product in 2024
Table 41. AGRU Sales Proportion of Pond Liner by Application in 2024
Table 42. AGRU Sales Proportion of Pond Liner by Geographic Area in 2024
Table 43. AGRU Recent Developments
Table 44. Solmax Company Information
Table 45. Solmax Description and Business Overview
Table 46. Solmax Pond Liner Product
Table 47. Solmax Pond Liner Sales (K sqm), Revenue (US$ Million), Price (USD/sqm) and Gross Margin (2020-2025)
Table 48. Solmax Sales Proportion of Pond Liner by Product in 2024
Table 49. Solmax Sales Proportion of Pond Liner by Application in 2024
Table 50. Solmax Sales Proportion of Pond Liner by Geographic Area in 2024
Table 51. Solmax Recent Developments
Table 52. Juta Company Information
Table 53. Juta Description and Business Overview
Table 54. Juta Pond Liner Product
Table 55. Juta Pond Liner Sales (K sqm), Revenue (US$ Million), Price (USD/sqm) and Gross Margin (2020-2025)
Table 56. Juta Sales Proportion of Pond Liner by Product in 2024
Table 57. Juta Sales Proportion of Pond Liner by Application in 2024
Table 58. Juta Sales Proportion of Pond Liner by Geographic Area in 2024
Table 59. Juta Recent Developments
Table 60. Firestone Company Information
Table 61. Firestone Description and Business Overview
Table 62. Firestone Pond Liner Product
Table 63. Firestone Pond Liner Sales (K sqm), Revenue (US$ Million), Price (USD/sqm) and Gross Margin (2020-2025)
Table 64. Firestone Sales Proportion of Pond Liner by Product in 2024
Table 65. Firestone Sales Proportion of Pond Liner by Application in 2024
Table 66. Firestone Sales Proportion of Pond Liner by Geographic Area in 2024
Table 67. Firestone Recent Developments
Table 68. Carlisle Company Information
Table 69. Carlisle Description and Business Overview
Table 70. Carlisle Pond Liner Product
Table 71. Carlisle Pond Liner Sales (K sqm), Revenue (US$ Million), Price (USD/sqm) and Gross Margin (2020-2025)
Table 72. Carlisle Sales Proportion of Pond Liner by Product in 2024
Table 73. Carlisle Sales Proportion of Pond Liner by Application in 2024
Table 74. Carlisle Sales Proportion of Pond Liner by Geographic Area in 2024
Table 75. Carlisle Recent Developments
Table 76. Sotrafa Company Information
Table 77. Sotrafa Description and Business Overview
Table 78. Sotrafa Pond Liner Product
Table 79. Sotrafa Pond Liner Sales (K sqm), Revenue (US$ Million), Price (USD/sqm) and Gross Margin (2020-2025)
Table 80. Sotrafa Sales Proportion of Pond Liner by Product in 2024
Table 81. Sotrafa Sales Proportion of Pond Liner by Application in 2024
Table 82. Sotrafa Sales Proportion of Pond Liner by Geographic Area in 2024
Table 83. Sotrafa Recent Developments
Table 84. Yaohua Geotextile Company Information
Table 85. Yaohua Geotextile Description and Business Overview
Table 86. Yaohua Geotextile Pond Liner Product
Table 87. Yaohua Geotextile Pond Liner Sales (K sqm), Revenue (US$ Million), Price (USD/sqm) and Gross Margin (2020-2025)
Table 88. Yaohua Geotextile Sales Proportion of Pond Liner by Product in 2024
Table 89. Yaohua Geotextile Sales Proportion of Pond Liner by Application in 2024
Table 90. Yaohua Geotextile Sales Proportion of Pond Liner by Geographic Area in 2024
Table 91. Yaohua Geotextile Recent Developments
Table 92. Officine Maccaferri Company Information
Table 93. Officine Maccaferri Description and Business Overview
Table 94. Officine Maccaferri Pond Liner Product
Table 95. Officine Maccaferri Pond Liner Sales (K sqm), Revenue (US$ Million), Price (USD/sqm) and Gross Margin (2020-2025)
Table 96. Officine Maccaferri Sales Proportion of Pond Liner by Product in 2024
Table 97. Officine Maccaferri Sales Proportion of Pond Liner by Application in 2024
Table 98. Officine Maccaferri Sales Proportion of Pond Liner by Geographic Area in 2024
Table 99. Officine Maccaferri Recent Developments
Table 100. HongXiang New Geo-Material Company Information
Table 101. HongXiang New Geo-Material Description and Business Overview
Table 102. HongXiang New Geo-Material Pond Liner Product
Table 103. HongXiang New Geo-Material Pond Liner Sales (K sqm), Revenue (US$ Million), Price (USD/sqm) and Gross Margin (2020-2025)
Table 104. HongXiang New Geo-Material Sales Proportion of Pond Liner by Product in 2024
Table 105. HongXiang New Geo-Material Sales Proportion of Pond Liner by Application in 2024
Table 106. HongXiang New Geo-Material Sales Proportion of Pond Liner by Geographic Area in 2024
Table 107. HongXiang New Geo-Material Recent Developments
Table 108. Laiwu Zhongxing Geotextile Company Information
Table 109. Laiwu Zhongxing Geotextile Description and Business Overview
Table 110. Laiwu Zhongxing Geotextile Pond Liner Product
Table 111. Laiwu Zhongxing Geotextile Pond Liner Sales (K sqm), Revenue (US$ Million), Price (USD/sqm) and Gross Margin (2020-2025)
Table 112. Laiwu Zhongxing Geotextile Sales Proportion of Pond Liner by Product in 2024
Table 113. Laiwu Zhongxing Geotextile Sales Proportion of Pond Liner by Application in 2024
Table 114. Laiwu Zhongxing Geotextile Sales Proportion of Pond Liner by Geographic Area in 2024
Table 115. Laiwu Zhongxing Geotextile Recent Developments
Table 116. Jinba Company Information
Table 117. Jinba Description and Business Overview
Table 118. Jinba Pond Liner Product
Table 119. Jinba Pond Liner Sales (K sqm), Revenue (US$ Million), Price (USD/sqm) and Gross Margin (2020-2025)
Table 120. Jinba Sales Proportion of Pond Liner by Product in 2024
Table 121. Jinba Sales Proportion of Pond Liner by Application in 2024
Table 122. Jinba Sales Proportion of Pond Liner by Geographic Area in 2024
Table 123. Jinba Recent Developments
Table 124. Huikwang Company Information
Table 125. Huikwang Description and Business Overview
Table 126. Huikwang Pond Liner Product
Table 127. Huikwang Pond Liner Sales (K sqm), Revenue (US$ Million), Price (USD/sqm) and Gross Margin (2020-2025)
Table 128. Huikwang Sales Proportion of Pond Liner by Product in 2024
Table 129. Huikwang Sales Proportion of Pond Liner by Application in 2024
Table 130. Huikwang Sales Proportion of Pond Liner by Geographic Area in 2024
Table 131. Huikwang Recent Developments
Table 132. PLASTIKA KRITIS Company Information
Table 133. PLASTIKA KRITIS Description and Business Overview
Table 134. PLASTIKA KRITIS Pond Liner Product
Table 135. PLASTIKA KRITIS Pond Liner Sales (K sqm), Revenue (US$ Million), Price (USD/sqm) and Gross Margin (2020-2025)
Table 136. PLASTIKA KRITIS Sales Proportion of Pond Liner by Product in 2024
Table 137. PLASTIKA KRITIS Sales Proportion of Pond Liner by Application in 2024
Table 138. PLASTIKA KRITIS Sales Proportion of Pond Liner by Geographic Area in 2024
Table 139. PLASTIKA KRITIS Recent Developments
Table 140. Seaman Company Information
Table 141. Seaman Description and Business Overview
Table 142. Seaman Pond Liner Product
Table 143. Seaman Pond Liner Sales (K sqm), Revenue (US$ Million), Price (USD/sqm) and Gross Margin (2020-2025)
Table 144. Seaman Sales Proportion of Pond Liner by Product in 2024
Table 145. Seaman Sales Proportion of Pond Liner by Application in 2024
Table 146. Seaman Sales Proportion of Pond Liner by Geographic Area in 2024
Table 147. Seaman Recent Developments
Table 148. Naue Company Information
Table 149. Naue Description and Business Overview
Table 150. Naue Pond Liner Product
Table 151. Naue Pond Liner Sales (K sqm), Revenue (US$ Million), Price (USD/sqm) and Gross Margin (2020-2025)
Table 152. Naue Sales Proportion of Pond Liner by Product in 2024
Table 153. Naue Sales Proportion of Pond Liner by Application in 2024
Table 154. Naue Sales Proportion of Pond Liner by Geographic Area in 2024
Table 155. Naue Recent Developments
Table 156. Yizheng Shengli Company Information
Table 157. Yizheng Shengli Description and Business Overview
Table 158. Yizheng Shengli Pond Liner Product
Table 159. Yizheng Shengli Pond Liner Sales (K sqm), Revenue (US$ Million), Price (USD/sqm) and Gross Margin (2020-2025)
Table 160. Yizheng Shengli Sales Proportion of Pond Liner by Product in 2024
Table 161. Yizheng Shengli Sales Proportion of Pond Liner by Application in 2024
Table 162. Yizheng Shengli Sales Proportion of Pond Liner by Geographic Area in 2024
Table 163. Yizheng Shengli Recent Developments
Table 164. Huadun Snowflake Company Information
Table 165. Huadun Snowflake Description and Business Overview
Table 166. Huadun Snowflake Pond Liner Product
Table 167. Huadun Snowflake Pond Liner Sales (K sqm), Revenue (US$ Million), Price (USD/sqm) and Gross Margin (2020-2025)
Table 168. Huadun Snowflake Sales Proportion of Pond Liner by Product in 2024
Table 169. Huadun Snowflake Sales Proportion of Pond Liner by Application in 2024
Table 170. Huadun Snowflake Sales Proportion of Pond Liner by Geographic Area in 2024
Table 171. Huadun Snowflake Recent Developments
Table 172. DuPont Company Information
Table 173. DuPont Description and Business Overview
Table 174. DuPont Pond Liner Product
Table 175. DuPont Pond Liner Sales (K sqm), Revenue (US$ Million), Price (USD/sqm) and Gross Margin (2020-2025)
Table 176. DuPont Sales Proportion of Pond Liner by Product in 2024
Table 177. DuPont Sales Proportion of Pond Liner by Application in 2024
Table 178. DuPont Sales Proportion of Pond Liner by Geographic Area in 2024
Table 179. DuPont Recent Developments
Table 180. RKW Group Company Information
Table 181. RKW Group Description and Business Overview
Table 182. RKW Group Pond Liner Product
Table 183. RKW Group Pond Liner Sales (K sqm), Revenue (US$ Million), Price (USD/sqm) and Gross Margin (2020-2025)
Table 184. RKW Group Sales Proportion of Pond Liner by Product in 2024
Table 185. RKW Group Sales Proportion of Pond Liner by Application in 2024
Table 186. RKW Group Sales Proportion of Pond Liner by Geographic Area in 2024
Table 187. RKW Group Recent Developments
Table 188. Reef Industries Company Information
Table 189. Reef Industries Description and Business Overview
Table 190. Reef Industries Pond Liner Product
Table 191. Reef Industries Pond Liner Sales (K sqm), Revenue (US$ Million), Price (USD/sqm) and Gross Margin (2020-2025)
Table 192. Reef Industries Sales Proportion of Pond Liner by Product in 2024
Table 193. Reef Industries Sales Proportion of Pond Liner by Application in 2024
Table 194. Reef Industries Sales Proportion of Pond Liner by Geographic Area in 2024
Table 195. Reef Industries Recent Developments
Table 196. Taian Road Engineering Materials Co., Ltd Company Information
Table 197. Taian Road Engineering Materials Co., Ltd Description and Business Overview
Table 198. Taian Road Engineering Materials Co., Ltd Pond Liner Product
Table 199. Taian Road Engineering Materials Co., Ltd Pond Liner Sales (K sqm), Revenue (US$ Million), Price (USD/sqm) and Gross Margin (2020-2025)
Table 200. Taian Road Engineering Materials Co., Ltd Sales Proportion of Pond Liner by Product in 2024
Table 201. Taian Road Engineering Materials Co., Ltd Sales Proportion of Pond Liner by Application in 2024
Table 202. Taian Road Engineering Materials Co., Ltd Sales Proportion of Pond Liner by Geographic Area in 2024
Table 203. Taian Road Engineering Materials Co., Ltd Recent Developments
Table 204. Western Environmental Liner Company Information
Table 205. Western Environmental Liner Description and Business Overview
Table 206. Western Environmental Liner Pond Liner Product
Table 207. Western Environmental Liner Pond Liner Sales (K sqm), Revenue (US$ Million), Price (USD/sqm) and Gross Margin (2020-2025)
Table 208. Western Environmental Liner Sales Proportion of Pond Liner by Product in 2024
Table 209. Western Environmental Liner Sales Proportion of Pond Liner by Application in 2024
Table 210. Western Environmental Liner Sales Proportion of Pond Liner by Geographic Area in 2024
Table 211. Western Environmental Liner Recent Developments
Table 212. North America Pond Liner Sales by Country (2020-2025) & (K sqm)
Table 213. North America Pond Liner Sales by Country (2026-2031) & (K sqm)
Table 214. North America Pond Liner Revenue by Country (2020-2025) & (US$ Million)
Table 215. North America Pond Liner Revenue by Country (2026-2031) & (US$ Million)
Table 216. North America Pond Liner Sales by Type (2020-2025) & (K sqm)
Table 217. North America Pond Liner Sales by Application (2020-2025) & (K sqm)
Table 218. Asia-Pacific Pond Liner Sales by Region (2020-2025) & (K sqm)
Table 219. Asia-Pacific Pond Liner Sales by Region (2026-2031) & (K sqm)
Table 220. Asia-Pacific Pond Liner Revenue by Region (2020-2025) & (US$ Million)
Table 221. Asia-Pacific Pond Liner Revenue by Region (2026-2031) & (US$ Million)
Table 222. Asia-Pacific Pond Liner Sales by Type (2020-2025) & (K sqm)
Table 223. Asia-Pacific Pond Liner Sales by Application (2020-2025) & (K sqm)
Table 224. Europe Pond Liner Sales by Country (2020-2025) & (K sqm)
Table 225. Europe Pond Liner Sales by Country (2026-2031) & (K sqm)
Table 226. Europe Pond Liner Revenue by Country (2020-2025) & (US$ Million)
Table 227. Europe Pond Liner Revenue by Country (2026-2031) & (US$ Million)
Table 228. Europe Pond Liner Sales by Type (2020-2025) & (K sqm)
Table 229. Europe Pond Liner Sales by Application (2020-2025) & (K sqm)
Table 230. Latin America Pond Liner Sales by Country (2020-2025) & (K sqm)
Table 231. Latin America Pond Liner Sales by Country (2026-2031) & (K sqm)
Table 232. Latin America Pond Liner Revenue by Country (2020-2025) & (US$ Million)
Table 233. Latin America Pond Liner Revenue by Country (2026-2031) & (US$ Million)
Table 234. Latin America Pond Liner Sales by Type (2020-2025) & (K sqm)
Table 235. Latin America Pond Liner Sales by Application (2020-2025) & (K sqm)
Table 236. Middle East and Africa Pond Liner Sales by Country (2020-2025) & (K sqm)
Table 237. Middle East and Africa Pond Liner Sales by Country (2026-2031) & (K sqm)
Table 238. Middle East and Africa Pond Liner Revenue by Country (2020-2025) & (US$ Million)
Table 239. Middle East and Africa Pond Liner Revenue by Country (2026-2031) & (US$ Million)
Table 240. Middle East and Africa Pond Liner Sales by Type (2020-2025) & (K sqm)
Table 241. Middle East and Africa Pond Liner Sales by Application (2020-2025) & (K sqm)
Table 242. Pond Liner Key Raw Materials, Industry Status and Trend
Table 243. Pond Liner Key Raw Materials and Upstream Suppliers
Table 244. Pond Liner Clients Status and Trend
Table 245. Pond Liner Typical Clients
Table 246. Pond Liner Distributors
Table 247. Pond Liner Market Trends
Table 248. Pond Liner Market Drivers
Table 249. Pond Liner Market Challenges
Table 250. Pond Liner Market Restraints
Table 251. Research Programs/Design for This Report
Table 252. Key Data Information from Secondary Sources
Table 253. Key Data Information from Primary Sources
Table 254. QYR Business Unit and Senior & Team Lead Analysts
List of Figures
Figure 1. Pond Liner Product Picture
Figure 2. Global Pond Liner Market Size by Type (US$ Million): 2020 VS 2024 VS 2031
Figure 3. Global Pond Liner Sales Market Share by Type in 2024 & 2031
Figure 4. Polyvinyl Chloride (PVC) Product Picture
Figure 5. Ethylene Propylene Diene Monomer (EPDM) Product Picture
Figure 6. Butyl Rubber Product Picture
Figure 7. Polyurea Product Picture
Figure 8. Polyester Product Picture
Figure 9. Polyethylene Product Picture
Figure 10. Global Pond Liner Market Size by Application (US$ Million): 2020 VS 2024 VS 2031
Figure 11. Global Pond Liner Sales Market Share by Application in 2024 & 2031
Figure 12. Potable Water
Figure 13. Floating Baffles
Figure 14. Oil Spill Containment
Figure 15. Others
Figure 16. Pond Liner Report Years Considered
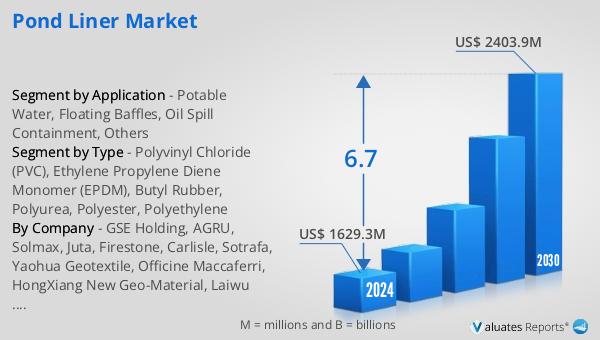
Figure 17. Global Pond Liner Revenue, (US$ Million), 2020 VS 2024 VS 2031
Figure 18. Global Pond Liner Market Size 2020-2031 (US$ Million)
Figure 19. Global Pond Liner Sales 2020-2031 (K sqm)
Figure 20. Global Pond Liner Sales Market Share Forecast by Region (2020-2031)
Figure 21. Global Pond Liner Revenue Market Share by Region (2020-2031)
Figure 22. Global Pond Liner Sales Market Share Forecast by Type (2020-2031)
Figure 23. Global Pond Liner Revenue Market Share Forecast by Type (2020-2031)
Figure 24. Pond Liner Average Selling Price (ASP) by Type (2020-2025) & (USD/sqm)
Figure 25. Global Pond Liner Sales Market Share Forecast by Application (2020-2031)
Figure 26. Global Pond Liner Revenue Market Share Forecast by Application (2020-2031)
Figure 27. Pond Liner Average Selling Price (ASP) by Application (2020-2025) & (USD/sqm)
Figure 28. Polyvinyl Chloride (PVC) of Pond Liner Revenue Market Share by Application, 2024 VS 2031
Figure 29. Ethylene Propylene Diene Monomer (EPDM) of Pond Liner Revenue Market Share by Application, 2024 VS 2031
Figure 30. Butyl Rubber of Pond Liner Revenue Market Share by Application, 2024 VS 2031
Figure 31. Polyurea of Pond Liner Revenue Market Share by Application, 2024 VS 2031
Figure 32. Polyester of Pond Liner Revenue Market Share by Application, 2024 VS 2031
Figure 33. Polyethylene of Pond Liner Revenue Market Share by Application, 2024 VS 2031
Figure 34. Global Pond Liner Sales Share by Manufacturer in 2024
Figure 35. Pond Liner Market Share by Company Type (Tier 1, Tier 2, and Tier 3): 2020 VS 2024
Figure 36. Polyvinyl Chloride (PVC) Market Sales Proportion by Manufacturer in 2024
Figure 37. Ethylene Propylene Diene Monomer (EPDM) Market Sales Proportion by Manufacturer in 2024
Figure 38. Butyl Rubber Market Sales Proportion by Manufacturer in 2024
Figure 39. Polyurea Market Sales Proportion by Manufacturer in 2024
Figure 40. Polyester Market Sales Proportion by Manufacturer in 2024
Figure 41. Polyethylene Market Sales Proportion by Manufacturer in 2024
Figure 42. North America Pond Liner Revenue 2020-2031 (US$ Million)
Figure 43. North America Pond Liner Sales Market Share by Type (2020-2025)
Figure 44. North America Pond Liner Sales Market Share by Application (2020-2025)
Figure 45. Asia-Pacific Pond Liner Revenue 2020-2031 (US$ Million)
Figure 46. Asia-Pacific Pond Liner Sales Market Share by Region (2020-2031)
Figure 47. Asia-Pacific Pond Liner Revenue Market Share by Region (2020-2031)
Figure 48. Asia-Pacific Pond Liner Sales Market Share by Type (2020-2025)
Figure 49. Asia-Pacific Pond Liner Sales Market Share by Application (2020-2025)
Figure 50. Europe Pond Liner Revenue Growth Rate 2020-2031 (US$ Million)
Figure 51. Europe Pond Liner Sales Market Share by Country (2020-2031)
Figure 52. Europe Pond Liner Revenue Market Share by Country (2020-2031)
Figure 53. Europe Pond Liner Sales Market Share by Type (2020-2025)
Figure 54. Europe Pond Liner Sales Market Share by Application (2020-2025)
Figure 55. Latin America Pond Liner Revenue Growth Rate 2020-2031 (US$ Million)
Figure 56. Latin America Pond Liner Sales Market Share by Country (2020-2031)
Figure 57. Latin America Pond Liner Revenue Market Share by Country (2020-2025)
Figure 58. Latin America Pond Liner Sales Market Share by Type (2020-2025)
Figure 59. Latin America Pond Liner Sales Market Share by Application (2020-2025)
Figure 60. Middle East and Africa Pond Liner Revenue Growth Rate 2020-2031 (US$ Million)
Figure 61. Middle East and Africa Pond Liner Sales Market Share by Country (2020-2031)
Figure 62. Middle East and Africa Pond Liner Revenue Market Share by Country (2020-2031)
Figure 63. Middle East and Africa Pond Liner Sales Market Share by Type (2020-2025)
Figure 64. Middle East and Africa Pond Liner Sales Market Share by Application (2020-2025)
Figure 65. Pond Liner Supply Chain (Upstream and Downstream Market)
Figure 66. Global Production Market Share of Pond Liner Raw Materials by Region in 2024
Figure 67. Pond Liner Distribution Channels
Figure 68. Global Pond Liner Percentage 2020-2031: Indirect Sales VS Direct Sales
Figure 69. Global Pond Liner Percentage 2020-2031: Online Sales VS Offline Sales
Figure 70. Bottom-up and Top-down Approaches for This Report
Figure 71. Data Triangulation
Figure 72. Key Executives Interviewed