0
U.S. (TOLL FREE)
+1 (315) 215-3225
Automative

0
U.S. (TOLL FREE)
+1 (315) 215-3225
Global Business Energy Solution Market Research Report 2025
Published Date: 2025-12-05
|
Report Code: QYRE-Auto-17N14236
Home | Market Reports
Global Business Energy Solution Market Research Report 2023
BUY CHAPTERS

Global Business Energy Solution Market Research Report 2025

Code: QYRE-Auto-17N14236
Report
2025-12-05
Pages:102
QYResearch
Buy Now with 15% Discount
DESCRIPTION
TABLE OF CONTENT
TABLES & FIGURES

Business Energy Solution Market Size

The global market for Business Energy Solution was valued at US$ 7176 million in the year 2024 and is projected to reach a revised size of US$ 14568 million by 2031, growing at a CAGR of 10.8% during the forecast period.

Business Energy Solution Market

Business Energy Solution Market

To address the challenges of high energy costs, low energy efficiency, and difficulties in achieving sustainable development goals for commercial organizations, commercial energy solutions have emerged. Since the rise of energy management and green building concepts in the late 20th century, these solutions have become a core component of enterprise operations and facilities management. Currently, commercial energy solutions have evolved into a comprehensive system encompassing energy efficiency audits, smart energy storage, renewable energy integration, and carbon footprint management. They are widely used in industrial parks, commercial buildings, data centers, and retail chains, effectively optimizing energy structures, reducing operating costs, and helping companies achieve their environmental goals.
As a core vehicle for energy transition, commercial energy solutions are driving global progress towards cleaner, more efficient, and sustainable energy through technological and business model innovation. In the future, with technological breakthroughs and improved policies, the industry will enjoy even greater development opportunities, creating greater value for businesses and users.
This report aims to provide a comprehensive presentation of the global market for Business Energy Solution, with both quantitative and qualitative analysis, to help readers develop business/growth strategies, assess the market competitive situation, analyze their position in the current marketplace, and make informed business decisions regarding Business Energy Solution.
The Business Energy Solution market size, estimations, and forecasts are provided in terms of and revenue ($ millions), considering 2024 as the base year, with history and forecast data for the period from 2020 to 2031. This report segments the global Business Energy Solution market comprehensively. Regional market sizes, concerning products by Type, by Application, by Technical Architecture and by players, are also provided.
For a more in-depth understanding of the market, the report provides profiles of the competitive landscape, key competitors, and their respective market ranks. The report also discusses technological trends and new product developments.
The report will help the Business Energy Solution companies, new entrants, and industry chain related companies in this market with information on the revenues for the overall market and the sub-segments across the different segments, by company, by Type, by Application, and by regions.
Market Segmentation

Scope of Business Energy Solution Market Report

Report Metric Details
Report Name Business Energy Solution Market
Accounted market size in year US$ 7176 million
Forecasted market size in 2031 US$ 14568 million
CAGR 10.8%
Base Year year
Forecasted years 2026 - 2031
Segment by Type
  • Solar Energy
  • Wind Energy
  • Energy Storage
  • Hydrogen Energy
Segment by Technical Architecture
  • Internet of Things (IoT) Intelligent System
  • AI-Driven Decision Platform
  • Convergence of Cloud Computing and Edge Computing
Segment by Service Models
  • Energy Management Contract (EMC)
  • Equipment Leasing
  • BOT Model
Segment by Application
  • Commercial and Industrial Energy Storage
  • Distributed Energy
  • Electric Vehicle Charging
  • Other
By Region
  • North America (United States, Canada)
  • Europe (Germany, France, UK, Italy, Russia) Rest of Europe
  • Nordic Countries
  • Asia-Pacific (China, Japan, South Korea)
  • Southeast Asia (India, Australia)
  • Rest of Asia
  • Latin America (Mexico, Brazil)
  • Rest of Latin America
  • Middle East & Africa (Turkey, Saudi Arabia, UAE, Rest of MEA)
By Company SSE Energy Solutions, BES Utilities, SDG&E, Direct Energy, NRG Energy, Ofgem, Energy Solutions, TEP, Alliant Energy, Nectr, AGL, Eon, Xcel Energy, Efficiency, Shell Energy, Guernsey Energy, Constellation, ActewAGL, TXU Energy, Drax, Centrica, Ignite Energy, Energy Harbor, Opus Energy
Forecast units USD million in value
Report coverage Revenue and volume forecast, company share, competitive landscape, growth factors and trends

Chapter Outline

  • Chapter 1: Introduces the report scope of the report, executive summary of different market segments (by Type, by Application, by Technical Architecture etc), including the market size of each market segment, future development potential, and so on. It offers a high-level view of the current state of the market and its likely evolution in the short to mid-term, and long term.
  • Chapter 2: Introduces executive summary of global market size, regional market size, this section also introduces the market dynamics, latest developments of the market, the driving factors and restrictive factors of the market, the challenges and risks faced by companies in the industry, and the analysis of relevant policies in the industry.
  • Chapter 3: Detailed analysis of Business Energy Solution company competitive landscape, revenue market share, latest development plan, merger, and acquisition information, etc.
  • Chapter 4: Provides the analysis of various market segments by Type, covering the market size and development potential of each market segment, to help readers find the blue ocean market in different market segments.
  • Chapter 5: Provides the analysis of various market segments by Application, covering the market size and development potential of each market segment, to help readers find the blue ocean market in different downstream markets.
  • Chapter 6, 7, 8, 9, 10: North America, Europe, Asia Pacific, Latin America, Middle East and Africa segment by country. It provides a quantitative analysis of the market size and development potential of each region and its main countries and introduces the market development, future development prospects, market space, and capacity of each country in the world.
  • Chapter 11: Provides profiles of key players, introducing the basic situation of the main companies in the market in detail, including product sales, revenue, price, gross margin, product introduction, recent development, etc.
  • Chapter 12: The main points and conclusions of the report.

FAQ for this report

How fast is Business Energy Solution Market growing?

Ans: The Business Energy Solution Market witnessing a CAGR of 10.8% during the forecast period 2026-2031.

What is the Business Energy Solution Market size in 2031?

Ans: The Business Energy Solution Market size in 2031 will be US$ 14568 million.

Who are the main players in the Business Energy Solution Market report?

Ans: The main players in the Business Energy Solution Market are SSE Energy Solutions, BES Utilities, SDG&E, Direct Energy, NRG Energy, Ofgem, Energy Solutions, TEP, Alliant Energy, Nectr, AGL, Eon, Xcel Energy, Efficiency, Shell Energy, Guernsey Energy, Constellation, ActewAGL, TXU Energy, Drax, Centrica, Ignite Energy, Energy Harbor, Opus Energy

What are the Application segmentation covered in the Business Energy Solution Market report?

Ans: The Applications covered in the Business Energy Solution Market report are Commercial and Industrial Energy Storage, Distributed Energy, Electric Vehicle Charging, Other

What are the Type segmentation covered in the Business Energy Solution Market report?

Ans: The Types covered in the Business Energy Solution Market report are Solar Energy, Wind Energy, Energy Storage, Hydrogen Energy

1 Report Overview
1.1 Study Scope
1.2 Market Analysis by Type
1.2.1 Global Business Energy Solution Market Size Growth Rate by Type: 2020 VS 2024 VS 2031
1.2.2 Solar Energy
1.2.3 Wind Energy
1.2.4 Energy Storage
1.2.5 Hydrogen Energy
1.3 Market by Technical Architecture
1.3.1 Global Business Energy Solution Market Size Growth Rate by Technical Architecture: 2020 VS 2024 VS 2031
1.3.2 Internet of Things (IoT) Intelligent System
1.3.3 AI-Driven Decision Platform
1.3.4 Convergence of Cloud Computing and Edge Computing
1.4 Market by Service Models
1.4.1 Global Business Energy Solution Market Size Growth Rate by Service Models: 2020 VS 2024 VS 2031
1.4.2 Energy Management Contract (EMC)
1.4.3 Equipment Leasing
1.4.4 BOT Model
1.5 Market by Application
1.5.1 Global Business Energy Solution Market Growth by Application: 2020 VS 2024 VS 2031
1.5.2 Commercial and Industrial Energy Storage
1.5.3 Distributed Energy
1.5.4 Electric Vehicle Charging
1.5.5 Other
1.6 Assumptions and Limitations
1.7 Study Objectives
1.8 Years Considered
2 Global Growth Trends
2.1 Global Business Energy Solution Market Perspective (2020-2031)
2.2 Global Business Energy Solution Growth Trends by Region
2.2.1 Global Business Energy Solution Market Size by Region: 2020 VS 2024 VS 2031
2.2.2 Business Energy Solution Historic Market Size by Region (2020-2025)
2.2.3 Business Energy Solution Forecasted Market Size by Region (2026-2031)
2.3 Business Energy Solution Market Dynamics
2.3.1 Business Energy Solution Industry Trends
2.3.2 Business Energy Solution Market Drivers
2.3.3 Business Energy Solution Market Challenges
2.3.4 Business Energy Solution Market Restraints
3 Competition Landscape by Key Players
3.1 Global Top Business Energy Solution Players by Revenue
3.1.1 Global Top Business Energy Solution Players by Revenue (2020-2025)
3.1.2 Global Business Energy Solution Revenue Market Share by Players (2020-2025)
3.2 Global Top Business Energy Solution Players by Company Type and Market Share by Company Type (Tier 1, Tier 2, and Tier 3)
3.3 Global Key Players Ranking by Business Energy Solution Revenue
3.4 Global Business Energy Solution Market Concentration Ratio
3.4.1 Global Business Energy Solution Market Concentration Ratio (CR5 and HHI)
3.4.2 Global Top 10 and Top 5 Companies by Business Energy Solution Revenue in 2024
3.5 Global Key Players of Business Energy Solution Head office and Area Served
3.6 Global Key Players of Business Energy Solution, Product and Application
3.7 Global Key Players of Business Energy Solution, Date of Enter into This Industry
3.8 Mergers & Acquisitions, Expansion Plans
4 Business Energy Solution Breakdown Data by Type
4.1 Global Business Energy Solution Historic Market Size by Type (2020-2025)
4.2 Global Business Energy Solution Forecasted Market Size by Type (2026-2031)
5 Business Energy Solution Breakdown Data by Application
5.1 Global Business Energy Solution Historic Market Size by Application (2020-2025)
5.2 Global Business Energy Solution Forecasted Market Size by Application (2026-2031)
6 North America
6.1 North America Business Energy Solution Market Size (2020-2031)
6.2 North America Business Energy Solution Market Growth Rate by Country: 2020 VS 2024 VS 2031
6.3 North America Business Energy Solution Market Size by Country (2020-2025)
6.4 North America Business Energy Solution Market Size by Country (2026-2031)
6.5 United States
6.6 Canada
7 Europe
7.1 Europe Business Energy Solution Market Size (2020-2031)
7.2 Europe Business Energy Solution Market Growth Rate by Country: 2020 VS 2024 VS 2031
7.3 Europe Business Energy Solution Market Size by Country (2020-2025)
7.4 Europe Business Energy Solution Market Size by Country (2026-2031)
7.5 Germany
7.6 France
7.7 U.K.
7.8 Italy
7.9 Russia
7.10 Ireland
8 Asia-Pacific
8.1 Asia-Pacific Business Energy Solution Market Size (2020-2031)
8.2 Asia-Pacific Business Energy Solution Market Growth Rate by Region: 2020 VS 2024 VS 2031
8.3 Asia-Pacific Business Energy Solution Market Size by Region (2020-2025)
8.4 Asia-Pacific Business Energy Solution Market Size by Region (2026-2031)
8.5 China
8.6 Japan
8.7 South Korea
8.8 Southeast Asia
8.9 India
8.10 Australia & New Zealand
9 Latin America
9.1 Latin America Business Energy Solution Market Size (2020-2031)
9.2 Latin America Business Energy Solution Market Growth Rate by Country: 2020 VS 2024 VS 2031
9.3 Latin America Business Energy Solution Market Size by Country (2020-2025)
9.4 Latin America Business Energy Solution Market Size by Country (2026-2031)
9.5 Mexico
9.6 Brazil
10 Middle East & Africa
10.1 Middle East & Africa Business Energy Solution Market Size (2020-2031)
10.2 Middle East & Africa Business Energy Solution Market Growth Rate by Country: 2020 VS 2024 VS 2031
10.3 Middle East & Africa Business Energy Solution Market Size by Country (2020-2025)
10.4 Middle East & Africa Business Energy Solution Market Size by Country (2026-2031)
10.5 Israel
10.6 Saudi Arabia
10.7 UAE
11 Key Players Profiles
11.1 SSE Energy Solutions
11.1.1 SSE Energy Solutions Company Details
11.1.2 SSE Energy Solutions Business Overview
11.1.3 SSE Energy Solutions Business Energy Solution Introduction
11.1.4 SSE Energy Solutions Revenue in Business Energy Solution Business (2020-2025)
11.1.5 SSE Energy Solutions Recent Development
11.2 BES Utilities
11.2.1 BES Utilities Company Details
11.2.2 BES Utilities Business Overview
11.2.3 BES Utilities Business Energy Solution Introduction
11.2.4 BES Utilities Revenue in Business Energy Solution Business (2020-2025)
11.2.5 BES Utilities Recent Development
11.3 SDG&E
11.3.1 SDG&E Company Details
11.3.2 SDG&E Business Overview
11.3.3 SDG&E Business Energy Solution Introduction
11.3.4 SDG&E Revenue in Business Energy Solution Business (2020-2025)
11.3.5 SDG&E Recent Development
11.4 Direct Energy
11.4.1 Direct Energy Company Details
11.4.2 Direct Energy Business Overview
11.4.3 Direct Energy Business Energy Solution Introduction
11.4.4 Direct Energy Revenue in Business Energy Solution Business (2020-2025)
11.4.5 Direct Energy Recent Development
11.5 NRG Energy
11.5.1 NRG Energy Company Details
11.5.2 NRG Energy Business Overview
11.5.3 NRG Energy Business Energy Solution Introduction
11.5.4 NRG Energy Revenue in Business Energy Solution Business (2020-2025)
11.5.5 NRG Energy Recent Development
11.6 Ofgem
11.6.1 Ofgem Company Details
11.6.2 Ofgem Business Overview
11.6.3 Ofgem Business Energy Solution Introduction
11.6.4 Ofgem Revenue in Business Energy Solution Business (2020-2025)
11.6.5 Ofgem Recent Development
11.7 Energy Solutions
11.7.1 Energy Solutions Company Details
11.7.2 Energy Solutions Business Overview
11.7.3 Energy Solutions Business Energy Solution Introduction
11.7.4 Energy Solutions Revenue in Business Energy Solution Business (2020-2025)
11.7.5 Energy Solutions Recent Development
11.8 TEP
11.8.1 TEP Company Details
11.8.2 TEP Business Overview
11.8.3 TEP Business Energy Solution Introduction
11.8.4 TEP Revenue in Business Energy Solution Business (2020-2025)
11.8.5 TEP Recent Development
11.9 Alliant Energy
11.9.1 Alliant Energy Company Details
11.9.2 Alliant Energy Business Overview
11.9.3 Alliant Energy Business Energy Solution Introduction
11.9.4 Alliant Energy Revenue in Business Energy Solution Business (2020-2025)
11.9.5 Alliant Energy Recent Development
11.10 Nectr
11.10.1 Nectr Company Details
11.10.2 Nectr Business Overview
11.10.3 Nectr Business Energy Solution Introduction
11.10.4 Nectr Revenue in Business Energy Solution Business (2020-2025)
11.10.5 Nectr Recent Development
11.11 AGL
11.11.1 AGL Company Details
11.11.2 AGL Business Overview
11.11.3 AGL Business Energy Solution Introduction
11.11.4 AGL Revenue in Business Energy Solution Business (2020-2025)
11.11.5 AGL Recent Development
11.12 Eon
11.12.1 Eon Company Details
11.12.2 Eon Business Overview
11.12.3 Eon Business Energy Solution Introduction
11.12.4 Eon Revenue in Business Energy Solution Business (2020-2025)
11.12.5 Eon Recent Development
11.13 Xcel Energy
11.13.1 Xcel Energy Company Details
11.13.2 Xcel Energy Business Overview
11.13.3 Xcel Energy Business Energy Solution Introduction
11.13.4 Xcel Energy Revenue in Business Energy Solution Business (2020-2025)
11.13.5 Xcel Energy Recent Development
11.14 Efficiency
11.14.1 Efficiency Company Details
11.14.2 Efficiency Business Overview
11.14.3 Efficiency Business Energy Solution Introduction
11.14.4 Efficiency Revenue in Business Energy Solution Business (2020-2025)
11.14.5 Efficiency Recent Development
11.15 Shell Energy
11.15.1 Shell Energy Company Details
11.15.2 Shell Energy Business Overview
11.15.3 Shell Energy Business Energy Solution Introduction
11.15.4 Shell Energy Revenue in Business Energy Solution Business (2020-2025)
11.15.5 Shell Energy Recent Development
11.16 Guernsey Energy
11.16.1 Guernsey Energy Company Details
11.16.2 Guernsey Energy Business Overview
11.16.3 Guernsey Energy Business Energy Solution Introduction
11.16.4 Guernsey Energy Revenue in Business Energy Solution Business (2020-2025)
11.16.5 Guernsey Energy Recent Development
11.17 Constellation
11.17.1 Constellation Company Details
11.17.2 Constellation Business Overview
11.17.3 Constellation Business Energy Solution Introduction
11.17.4 Constellation Revenue in Business Energy Solution Business (2020-2025)
11.17.5 Constellation Recent Development
11.18 ActewAGL
11.18.1 ActewAGL Company Details
11.18.2 ActewAGL Business Overview
11.18.3 ActewAGL Business Energy Solution Introduction
11.18.4 ActewAGL Revenue in Business Energy Solution Business (2020-2025)
11.18.5 ActewAGL Recent Development
11.19 TXU Energy
11.19.1 TXU Energy Company Details
11.19.2 TXU Energy Business Overview
11.19.3 TXU Energy Business Energy Solution Introduction
11.19.4 TXU Energy Revenue in Business Energy Solution Business (2020-2025)
11.19.5 TXU Energy Recent Development
11.20 Drax
11.20.1 Drax Company Details
11.20.2 Drax Business Overview
11.20.3 Drax Business Energy Solution Introduction
11.20.4 Drax Revenue in Business Energy Solution Business (2020-2025)
11.20.5 Drax Recent Development
11.21 Centrica
11.21.1 Centrica Company Details
11.21.2 Centrica Business Overview
11.21.3 Centrica Business Energy Solution Introduction
11.21.4 Centrica Revenue in Business Energy Solution Business (2020-2025)
11.21.5 Centrica Recent Development
11.22 Ignite Energy
11.22.1 Ignite Energy Company Details
11.22.2 Ignite Energy Business Overview
11.22.3 Ignite Energy Business Energy Solution Introduction
11.22.4 Ignite Energy Revenue in Business Energy Solution Business (2020-2025)
11.22.5 Ignite Energy Recent Development
11.23 Energy Harbor
11.23.1 Energy Harbor Company Details
11.23.2 Energy Harbor Business Overview
11.23.3 Energy Harbor Business Energy Solution Introduction
11.23.4 Energy Harbor Revenue in Business Energy Solution Business (2020-2025)
11.23.5 Energy Harbor Recent Development
11.24 Opus Energy
11.24.1 Opus Energy Company Details
11.24.2 Opus Energy Business Overview
11.24.3 Opus Energy Business Energy Solution Introduction
11.24.4 Opus Energy Revenue in Business Energy Solution Business (2020-2025)
11.24.5 Opus Energy Recent Development
12 Analyst's Viewpoints/Conclusions
13 Appendix
13.1 Research Methodology
13.1.1 Methodology/Research Approach
13.1.1.1 Research Programs/Design
13.1.1.2 Market Size Estimation
13.1.1.3 Market Breakdown and Data Triangulation
13.1.2 Data Source
13.1.2.1 Secondary Sources
13.1.2.2 Primary Sources
13.2 Author Details
13.3 Disclaimer
List of Tables
 Table 1. Global Business Energy Solution Market Size Growth Rate by Type (US$ Million): 2020 VS 2024 VS 2031
 Table 2. Key Players of Solar Energy
 Table 3. Key Players of Wind Energy
 Table 4. Key Players of Energy Storage
 Table 5. Key Players of Hydrogen Energy
 Table 6. Global Business Energy Solution Market Size Growth Rate by Technical Architecture (US$ Million): 2020 VS 2024 VS 2031
 Table 7. Key Players of Internet of Things (IoT) Intelligent System
 Table 8. Key Players of AI-Driven Decision Platform
 Table 9. Key Players of Convergence of Cloud Computing and Edge Computing
 Table 10. Global Business Energy Solution Market Size Growth Rate by Service Models (US$ Million): 2020 VS 2024 VS 2031
 Table 11. Key Players of Energy Management Contract (EMC)
 Table 12. Key Players of Equipment Leasing
 Table 13. Key Players of BOT Model
 Table 14. Global Business Energy Solution Market Size Growth by Application (US$ Million): 2020 VS 2024 VS 2031
 Table 15. Global Business Energy Solution Market Size by Region (US$ Million): 2020 VS 2024 VS 2031
 Table 16. Global Business Energy Solution Market Size by Region (2020-2025) & (US$ Million)
 Table 17. Global Business Energy Solution Market Share by Region (2020-2025)
 Table 18. Global Business Energy Solution Forecasted Market Size by Region (2026-2031) & (US$ Million)
 Table 19. Global Business Energy Solution Market Share by Region (2026-2031)
 Table 20. Business Energy Solution Market Trends
 Table 21. Business Energy Solution Market Drivers
 Table 22. Business Energy Solution Market Challenges
 Table 23. Business Energy Solution Market Restraints
 Table 24. Global Business Energy Solution Revenue by Players (2020-2025) & (US$ Million)
 Table 25. Global Business Energy Solution Market Share by Players (2020-2025)
 Table 26. Global Top Business Energy Solution Players by Company Type (Tier 1, Tier 2, and Tier 3) & (based on the Revenue in Business Energy Solution as of 2024)
 Table 27. Ranking of Global Top Business Energy Solution Companies by Revenue (US$ Million) in 2024
 Table 28. Global 5 Largest Players Market Share by Business Energy Solution Revenue (CR5 and HHI) & (2020-2025)
 Table 29. Global Key Players of Business Energy Solution, Headquarters and Area Served
 Table 30. Global Key Players of Business Energy Solution, Product and Application
 Table 31. Global Key Players of Business Energy Solution, Date of Enter into This Industry
 Table 32. Mergers & Acquisitions, Expansion Plans
 Table 33. Global Business Energy Solution Market Size by Type (2020-2025) & (US$ Million)
 Table 34. Global Business Energy Solution Revenue Market Share by Type (2020-2025)
 Table 35. Global Business Energy Solution Forecasted Market Size by Type (2026-2031) & (US$ Million)
 Table 36. Global Business Energy Solution Revenue Market Share by Type (2026-2031)
 Table 37. Global Business Energy Solution Market Size by Application (2020-2025) & (US$ Million)
 Table 38. Global Business Energy Solution Revenue Market Share by Application (2020-2025)
 Table 39. Global Business Energy Solution Forecasted Market Size by Application (2026-2031) & (US$ Million)
 Table 40. Global Business Energy Solution Revenue Market Share by Application (2026-2031)
 Table 41. North America Business Energy Solution Market Size Growth Rate by Country (US$ Million): 2020 VS 2024 VS 2031
 Table 42. North America Business Energy Solution Market Size by Country (2020-2025) & (US$ Million)
 Table 43. North America Business Energy Solution Market Size by Country (2026-2031) & (US$ Million)
 Table 44. Europe Business Energy Solution Market Size Growth Rate by Country (US$ Million): 2020 VS 2024 VS 2031
 Table 45. Europe Business Energy Solution Market Size by Country (2020-2025) & (US$ Million)
 Table 46. Europe Business Energy Solution Market Size by Country (2026-2031) & (US$ Million)
 Table 47. Asia-Pacific Business Energy Solution Market Size Growth Rate by Region (US$ Million): 2020 VS 2024 VS 2031
 Table 48. Asia-Pacific Business Energy Solution Market Size by Region (2020-2025) & (US$ Million)
 Table 49. Asia-Pacific Business Energy Solution Market Size by Region (2026-2031) & (US$ Million)
 Table 50. Latin America Business Energy Solution Market Size Growth Rate by Country (US$ Million): 2020 VS 2024 VS 2031
 Table 51. Latin America Business Energy Solution Market Size by Country (2020-2025) & (US$ Million)
 Table 52. Latin America Business Energy Solution Market Size by Country (2026-2031) & (US$ Million)
 Table 53. Middle East & Africa Business Energy Solution Market Size Growth Rate by Country (US$ Million): 2020 VS 2024 VS 2031
 Table 54. Middle East & Africa Business Energy Solution Market Size by Country (2020-2025) & (US$ Million)
 Table 55. Middle East & Africa Business Energy Solution Market Size by Country (2026-2031) & (US$ Million)
 Table 56. SSE Energy Solutions Company Details
 Table 57. SSE Energy Solutions Business Overview
 Table 58. SSE Energy Solutions Business Energy Solution Product
 Table 59. SSE Energy Solutions Revenue in Business Energy Solution Business (2020-2025) & (US$ Million)
 Table 60. SSE Energy Solutions Recent Development
 Table 61. BES Utilities Company Details
 Table 62. BES Utilities Business Overview
 Table 63. BES Utilities Business Energy Solution Product
 Table 64. BES Utilities Revenue in Business Energy Solution Business (2020-2025) & (US$ Million)
 Table 65. BES Utilities Recent Development
 Table 66. SDG&E Company Details
 Table 67. SDG&E Business Overview
 Table 68. SDG&E Business Energy Solution Product
 Table 69. SDG&E Revenue in Business Energy Solution Business (2020-2025) & (US$ Million)
 Table 70. SDG&E Recent Development
 Table 71. Direct Energy Company Details
 Table 72. Direct Energy Business Overview
 Table 73. Direct Energy Business Energy Solution Product
 Table 74. Direct Energy Revenue in Business Energy Solution Business (2020-2025) & (US$ Million)
 Table 75. Direct Energy Recent Development
 Table 76. NRG Energy Company Details
 Table 77. NRG Energy Business Overview
 Table 78. NRG Energy Business Energy Solution Product
 Table 79. NRG Energy Revenue in Business Energy Solution Business (2020-2025) & (US$ Million)
 Table 80. NRG Energy Recent Development
 Table 81. Ofgem Company Details
 Table 82. Ofgem Business Overview
 Table 83. Ofgem Business Energy Solution Product
 Table 84. Ofgem Revenue in Business Energy Solution Business (2020-2025) & (US$ Million)
 Table 85. Ofgem Recent Development
 Table 86. Energy Solutions Company Details
 Table 87. Energy Solutions Business Overview
 Table 88. Energy Solutions Business Energy Solution Product
 Table 89. Energy Solutions Revenue in Business Energy Solution Business (2020-2025) & (US$ Million)
 Table 90. Energy Solutions Recent Development
 Table 91. TEP Company Details
 Table 92. TEP Business Overview
 Table 93. TEP Business Energy Solution Product
 Table 94. TEP Revenue in Business Energy Solution Business (2020-2025) & (US$ Million)
 Table 95. TEP Recent Development
 Table 96. Alliant Energy Company Details
 Table 97. Alliant Energy Business Overview
 Table 98. Alliant Energy Business Energy Solution Product
 Table 99. Alliant Energy Revenue in Business Energy Solution Business (2020-2025) & (US$ Million)
 Table 100. Alliant Energy Recent Development
 Table 101. Nectr Company Details
 Table 102. Nectr Business Overview
 Table 103. Nectr Business Energy Solution Product
 Table 104. Nectr Revenue in Business Energy Solution Business (2020-2025) & (US$ Million)
 Table 105. Nectr Recent Development
 Table 106. AGL Company Details
 Table 107. AGL Business Overview
 Table 108. AGL Business Energy Solution Product
 Table 109. AGL Revenue in Business Energy Solution Business (2020-2025) & (US$ Million)
 Table 110. AGL Recent Development
 Table 111. Eon Company Details
 Table 112. Eon Business Overview
 Table 113. Eon Business Energy Solution Product
 Table 114. Eon Revenue in Business Energy Solution Business (2020-2025) & (US$ Million)
 Table 115. Eon Recent Development
 Table 116. Xcel Energy Company Details
 Table 117. Xcel Energy Business Overview
 Table 118. Xcel Energy Business Energy Solution Product
 Table 119. Xcel Energy Revenue in Business Energy Solution Business (2020-2025) & (US$ Million)
 Table 120. Xcel Energy Recent Development
 Table 121. Efficiency Company Details
 Table 122. Efficiency Business Overview
 Table 123. Efficiency Business Energy Solution Product
 Table 124. Efficiency Revenue in Business Energy Solution Business (2020-2025) & (US$ Million)
 Table 125. Efficiency Recent Development
 Table 126. Shell Energy Company Details
 Table 127. Shell Energy Business Overview
 Table 128. Shell Energy Business Energy Solution Product
 Table 129. Shell Energy Revenue in Business Energy Solution Business (2020-2025) & (US$ Million)
 Table 130. Shell Energy Recent Development
 Table 131. Guernsey Energy Company Details
 Table 132. Guernsey Energy Business Overview
 Table 133. Guernsey Energy Business Energy Solution Product
 Table 134. Guernsey Energy Revenue in Business Energy Solution Business (2020-2025) & (US$ Million)
 Table 135. Guernsey Energy Recent Development
 Table 136. Constellation Company Details
 Table 137. Constellation Business Overview
 Table 138. Constellation Business Energy Solution Product
 Table 139. Constellation Revenue in Business Energy Solution Business (2020-2025) & (US$ Million)
 Table 140. Constellation Recent Development
 Table 141. ActewAGL Company Details
 Table 142. ActewAGL Business Overview
 Table 143. ActewAGL Business Energy Solution Product
 Table 144. ActewAGL Revenue in Business Energy Solution Business (2020-2025) & (US$ Million)
 Table 145. ActewAGL Recent Development
 Table 146. TXU Energy Company Details
 Table 147. TXU Energy Business Overview
 Table 148. TXU Energy Business Energy Solution Product
 Table 149. TXU Energy Revenue in Business Energy Solution Business (2020-2025) & (US$ Million)
 Table 150. TXU Energy Recent Development
 Table 151. Drax Company Details
 Table 152. Drax Business Overview
 Table 153. Drax Business Energy Solution Product
 Table 154. Drax Revenue in Business Energy Solution Business (2020-2025) & (US$ Million)
 Table 155. Drax Recent Development
 Table 156. Centrica Company Details
 Table 157. Centrica Business Overview
 Table 158. Centrica Business Energy Solution Product
 Table 159. Centrica Revenue in Business Energy Solution Business (2020-2025) & (US$ Million)
 Table 160. Centrica Recent Development
 Table 161. Ignite Energy Company Details
 Table 162. Ignite Energy Business Overview
 Table 163. Ignite Energy Business Energy Solution Product
 Table 164. Ignite Energy Revenue in Business Energy Solution Business (2020-2025) & (US$ Million)
 Table 165. Ignite Energy Recent Development
 Table 166. Energy Harbor Company Details
 Table 167. Energy Harbor Business Overview
 Table 168. Energy Harbor Business Energy Solution Product
 Table 169. Energy Harbor Revenue in Business Energy Solution Business (2020-2025) & (US$ Million)
 Table 170. Energy Harbor Recent Development
 Table 171. Opus Energy Company Details
 Table 172. Opus Energy Business Overview
 Table 173. Opus Energy Business Energy Solution Product
 Table 174. Opus Energy Revenue in Business Energy Solution Business (2020-2025) & (US$ Million)
 Table 175. Opus Energy Recent Development
 Table 176. Research Programs/Design for This Report
 Table 177. Key Data Information from Secondary Sources
 Table 178. Key Data Information from Primary Sources
 Table 179. Authors List of This Report


List of Figures
 Figure 1. Business Energy Solution Picture
 Figure 2. Global Business Energy Solution Market Size Comparison by Type (2020-2031) & (US$ Million)
 Figure 3. Global Business Energy Solution Market Share by Type: 2024 VS 2031
 Figure 4. Solar Energy Features
 Figure 5. Wind Energy Features
 Figure 6. Energy Storage Features
 Figure 7. Hydrogen Energy Features
 Figure 8. Global Business Energy Solution Market Size Comparison by Technical Architecture (2020-2031) & (US$ Million)
 Figure 9. Internet of Things (IoT) Intelligent System Features
 Figure 10. AI-Driven Decision Platform Features
 Figure 11. Convergence of Cloud Computing and Edge Computing Features
 Figure 12. Global Business Energy Solution Market Size Comparison by Service Models (2020-2031) & (US$ Million)
 Figure 13. Energy Management Contract (EMC) Features
 Figure 14. Equipment Leasing Features
 Figure 15. BOT Model Features
 Figure 16. Global Business Energy Solution Market Size by Application (2020-2031) & (US$ Million)
 Figure 17. Global Business Energy Solution Market Share by Application: 2024 VS 2031
 Figure 18. Commercial and Industrial Energy Storage Case Studies
 Figure 19. Distributed Energy Case Studies
 Figure 20. Electric Vehicle Charging Case Studies
 Figure 21. Other Case Studies
 Figure 22. Business Energy Solution Report Years Considered
 Figure 23. Global Business Energy Solution Market Size (US$ Million), Year-over-Year: 2020-2031
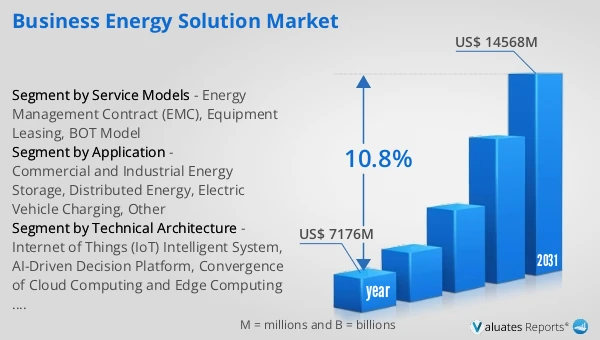
 Figure 24. Global Business Energy Solution Market Size, (US$ Million), 2020 VS 2024 VS 2031
 Figure 25. Global Business Energy Solution Market Share by Region: 2024 VS 2031
 Figure 26. Global Business Energy Solution Market Share by Players in 2024
 Figure 27. Global Business Energy Solution Market Share by Company Type (Tier 1, Tier 2, and Tier 3)
 Figure 28. The Top 10 and 5 Players Market Share by Business Energy Solution Revenue in 2024
 Figure 29. North America Business Energy Solution Market Size YoY Growth (2020-2031) & (US$ Million)
 Figure 30. North America Business Energy Solution Market Share by Country (2020-2031)
 Figure 31. United States Business Energy Solution Market Size YoY Growth (2020-2031) & (US$ Million)
 Figure 32. Canada Business Energy Solution Market Size YoY Growth (2020-2031) & (US$ Million)
 Figure 33. Europe Business Energy Solution Market Size YoY Growth (2020-2031) & (US$ Million)
 Figure 34. Europe Business Energy Solution Market Share by Country (2020-2031)
 Figure 35. Germany Business Energy Solution Market Size YoY Growth (2020-2031) & (US$ Million)
 Figure 36. France Business Energy Solution Market Size YoY Growth (2020-2031) & (US$ Million)
 Figure 37. U.K. Business Energy Solution Market Size YoY Growth (2020-2031) & (US$ Million)
 Figure 38. Italy Business Energy Solution Market Size YoY Growth (2020-2031) & (US$ Million)
 Figure 39. Russia Business Energy Solution Market Size YoY Growth (2020-2031) & (US$ Million)
 Figure 40. Ireland Business Energy Solution Market Size YoY Growth (2020-2031) & (US$ Million)
 Figure 41. Asia-Pacific Business Energy Solution Market Size YoY Growth (2020-2031) & (US$ Million)
 Figure 42. Asia-Pacific Business Energy Solution Market Share by Region (2020-2031)
 Figure 43. China Business Energy Solution Market Size YoY Growth (2020-2031) & (US$ Million)
 Figure 44. Japan Business Energy Solution Market Size YoY Growth (2020-2031) & (US$ Million)
 Figure 45. South Korea Business Energy Solution Market Size YoY Growth (2020-2031) & (US$ Million)
 Figure 46. Southeast Asia Business Energy Solution Market Size YoY Growth (2020-2031) & (US$ Million)
 Figure 47. India Business Energy Solution Market Size YoY Growth (2020-2031) & (US$ Million)
 Figure 48. Australia & New Zealand Business Energy Solution Market Size YoY Growth (2020-2031) & (US$ Million)
 Figure 49. Latin America Business Energy Solution Market Size YoY Growth (2020-2031) & (US$ Million)
 Figure 50. Latin America Business Energy Solution Market Share by Country (2020-2031)
 Figure 51. Mexico Business Energy Solution Market Size YoY Growth (2020-2031) & (US$ Million)
 Figure 52. Brazil Business Energy Solution Market Size YoY Growth (2020-2031) & (US$ Million)
 Figure 53. Middle East & Africa Business Energy Solution Market Size YoY Growth (2020-2031) & (US$ Million)
 Figure 54. Middle East & Africa Business Energy Solution Market Share by Country (2020-2031)
 Figure 55. Israel Business Energy Solution Market Size YoY Growth (2020-2031) & (US$ Million)
 Figure 56. Saudi Arabia Business Energy Solution Market Size YoY Growth (2020-2031) & (US$ Million)
 Figure 57. UAE Business Energy Solution Market Size YoY Growth (2020-2031) & (US$ Million)
 Figure 58. SSE Energy Solutions Revenue Growth Rate in Business Energy Solution Business (2020-2025)
 Figure 59. BES Utilities Revenue Growth Rate in Business Energy Solution Business (2020-2025)
 Figure 60. SDG&E Revenue Growth Rate in Business Energy Solution Business (2020-2025)
 Figure 61. Direct Energy Revenue Growth Rate in Business Energy Solution Business (2020-2025)
 Figure 62. NRG Energy Revenue Growth Rate in Business Energy Solution Business (2020-2025)
 Figure 63. Ofgem Revenue Growth Rate in Business Energy Solution Business (2020-2025)
 Figure 64. Energy Solutions Revenue Growth Rate in Business Energy Solution Business (2020-2025)
 Figure 65. TEP Revenue Growth Rate in Business Energy Solution Business (2020-2025)
 Figure 66. Alliant Energy Revenue Growth Rate in Business Energy Solution Business (2020-2025)
 Figure 67. Nectr Revenue Growth Rate in Business Energy Solution Business (2020-2025)
 Figure 68. AGL Revenue Growth Rate in Business Energy Solution Business (2020-2025)
 Figure 69. Eon Revenue Growth Rate in Business Energy Solution Business (2020-2025)
 Figure 70. Xcel Energy Revenue Growth Rate in Business Energy Solution Business (2020-2025)
 Figure 71. Efficiency Revenue Growth Rate in Business Energy Solution Business (2020-2025)
 Figure 72. Shell Energy Revenue Growth Rate in Business Energy Solution Business (2020-2025)
 Figure 73. Guernsey Energy Revenue Growth Rate in Business Energy Solution Business (2020-2025)
 Figure 74. Constellation Revenue Growth Rate in Business Energy Solution Business (2020-2025)
 Figure 75. ActewAGL Revenue Growth Rate in Business Energy Solution Business (2020-2025)
 Figure 76. TXU Energy Revenue Growth Rate in Business Energy Solution Business (2020-2025)
 Figure 77. Drax Revenue Growth Rate in Business Energy Solution Business (2020-2025)
 Figure 78. Centrica Revenue Growth Rate in Business Energy Solution Business (2020-2025)
 Figure 79. Ignite Energy Revenue Growth Rate in Business Energy Solution Business (2020-2025)
 Figure 80. Energy Harbor Revenue Growth Rate in Business Energy Solution Business (2020-2025)
 Figure 81. Opus Energy Revenue Growth Rate in Business Energy Solution Business (2020-2025)
 Figure 82. Bottom-up and Top-down Approaches for This Report
 Figure 83. Data Triangulation
 Figure 84. Key Executives Interviewed
SELECT A FORMAT
Added to Cart
Electronic

$2900

Single User License
Electronic

$4350

Multi User License
Electronic

$5800

Enterprise License
Add to Cart
Buy Now (15% Discount)

OUR CUSTOMER

Bioinformatics Barcelona

SIMILAR REPORTS