List of Tables
Table 1. Global Ceramics For Semiconductor Manufacturing Equipment Market Size Growth Rate by Material (US$ Million): 2021 vs 2025 vs 2032
Table 2. Key Players of Alumina Ceramics
Table 3. Key Players of AlN Ceramics
Table 4. Key Players of SiC Ceramics
Table 5. Key Players of Si3N4 Ceramics
Table 6. Key Players of Others
Table 7. Global Ceramics For Semiconductor Manufacturing Equipment Market Size Growth Rate by Wafer Size (US$ Million): 2021 vs 2025 vs 2032
Table 8. Key Players of 300mm Semiconductor Equipment
Table 9. Key Players of 200mm Semiconductor Equipment
Table 10. Key Players of Others
Table 11. Global Ceramics For Semiconductor Manufacturing Equipment Market Size Growth by Application (US$ Million): 2021 vs 2025 vs 2032
Table 12. Global Ceramics For Semiconductor Manufacturing Equipment Market Size by Region (US$ Million): 2021 vs 2025 vs 2032
Table 13. Global Ceramics For Semiconductor Manufacturing Equipment Market Size by Region (US$ Million), 2021–2026
Table 14. Global Ceramics For Semiconductor Manufacturing Equipment Market Share by Region (2021–2026)
Table 15. Global Ceramics For Semiconductor Manufacturing Equipment Forecasted Market Size by Region (US$ Million), 2027–2032
Table 16. Global Ceramics For Semiconductor Manufacturing Equipment Market Share by Region (2027–2032)
Table 17. Ceramics For Semiconductor Manufacturing Equipment Market Trends
Table 18. Ceramics For Semiconductor Manufacturing Equipment Market Drivers
Table 19. Ceramics For Semiconductor Manufacturing Equipment Market Challenges
Table 20. Ceramics For Semiconductor Manufacturing Equipment Market Restraints
Table 21. Global Ceramics For Semiconductor Manufacturing Equipment Revenue by Players (US$ Million), 2021–2026
Table 22. Global Ceramics For Semiconductor Manufacturing Equipment Market Share by Players (2021–2026)
Table 23. Global Top Ceramics For Semiconductor Manufacturing Equipment Players by Tier (Tier 1, Tier 2, and Tier 3), based on Ceramics For Semiconductor Manufacturing Equipment Revenue, 2025
Table 24. Ranking of Global Top Ceramics For Semiconductor Manufacturing Equipment Companies by Revenue (US$ Million) in 2025
Table 25. Global 5 Largest Players Market Share by Ceramics For Semiconductor Manufacturing Equipment Revenue (CR5 and HHI), 2021–2026
Table 26. Global Key Players of Ceramics For Semiconductor Manufacturing Equipment, Headquarters and Area Served
Table 27. Global Key Players of Ceramics For Semiconductor Manufacturing Equipment, Products and Applications
Table 28. Global Key Players of Ceramics For Semiconductor Manufacturing Equipment, Date of General Availability (GA)
Table 29. Mergers and Acquisitions, Expansion Plans
Table 30. Global Ceramics For Semiconductor Manufacturing Equipment Market Size by Material (US$ Million), 2021–2026
Table 31. Global Ceramics For Semiconductor Manufacturing Equipment Revenue Market Share by Material (2021–2026)
Table 32. Global Ceramics For Semiconductor Manufacturing Equipment Forecasted Market Size by Material (US$ Million), 2027–2032
Table 33. Global Ceramics For Semiconductor Manufacturing Equipment Revenue Market Share by Material (2027–2032)
Table 34. Global Ceramics For Semiconductor Manufacturing Equipment Market Size by Application (US$ Million), 2021–2026
Table 35. Global Ceramics For Semiconductor Manufacturing Equipment Revenue Market Share by Application (2021–2026)
Table 36. Global Ceramics For Semiconductor Manufacturing Equipment Forecasted Market Size by Application (US$ Million), 2027–2032
Table 37. Global Ceramics For Semiconductor Manufacturing Equipment Revenue Market Share by Application (2027–2032)
Table 38. North America Ceramics For Semiconductor Manufacturing Equipment Market Size Growth Rate by Country (US$ Million): 2021 vs 2025 vs 2032
Table 39. North America Ceramics For Semiconductor Manufacturing Equipment Market Size by Country (US$ Million), 2021–2026
Table 40. North America Ceramics For Semiconductor Manufacturing Equipment Market Size by Country (US$ Million), 2027–2032
Table 41. Europe Ceramics For Semiconductor Manufacturing Equipment Market Size Growth Rate by Country (US$ Million): 2021 vs 2025 vs 2032
Table 42. Europe Ceramics For Semiconductor Manufacturing Equipment Market Size by Country (US$ Million), 2021–2026
Table 43. Europe Ceramics For Semiconductor Manufacturing Equipment Market Size by Country (US$ Million), 2027–2032
Table 44. Asia-Pacific Ceramics For Semiconductor Manufacturing Equipment Market Size Growth Rate by Region (US$ Million): 2021 vs 2025 vs 2032
Table 45. Asia-Pacific Ceramics For Semiconductor Manufacturing Equipment Market Size by Region (US$ Million), 2021–2026
Table 46. Asia-Pacific Ceramics For Semiconductor Manufacturing Equipment Market Size by Region (US$ Million), 2027–2032
Table 47. Latin America Ceramics For Semiconductor Manufacturing Equipment Market Size Growth Rate by Country (US$ Million): 2021 vs 2025 vs 2032
Table 48. Latin America Ceramics For Semiconductor Manufacturing Equipment Market Size by Country (US$ Million), 2021–2026
Table 49. Latin America Ceramics For Semiconductor Manufacturing Equipment Market Size by Country (US$ Million), 2027–2032
Table 50. Middle East & Africa Ceramics For Semiconductor Manufacturing Equipment Market Size Growth Rate by Country (US$ Million): 2021 vs 2025 vs 2032
Table 51. Middle East & Africa Ceramics For Semiconductor Manufacturing Equipment Market Size by Country (US$ Million), 2021–2026
Table 52. Middle East & Africa Ceramics For Semiconductor Manufacturing Equipment Market Size by Country (US$ Million), 2027–2032
Table 53. NGK Insulators Company Details
Table 54. NGK Insulators Business Overview
Table 55. NGK Insulators Ceramics For Semiconductor Manufacturing Equipment Product
Table 56. NGK Insulators Revenue in Ceramics For Semiconductor Manufacturing Equipment Business (US$ Million), 2021–2026
Table 57. NGK Insulators Recent Development
Table 58. Kyocera Company Details
Table 59. Kyocera Business Overview
Table 60. Kyocera Ceramics For Semiconductor Manufacturing Equipment Product
Table 61. Kyocera Revenue in Ceramics For Semiconductor Manufacturing Equipment Business (US$ Million), 2021–2026
Table 62. Kyocera Recent Development
Table 63. Ferrotec Company Details
Table 64. Ferrotec Business Overview
Table 65. Ferrotec Ceramics For Semiconductor Manufacturing Equipment Product
Table 66. Ferrotec Revenue in Ceramics For Semiconductor Manufacturing Equipment Business (US$ Million), 2021–2026
Table 67. Ferrotec Recent Development
Table 68. TOTO Advanced Ceramics Company Details
Table 69. TOTO Advanced Ceramics Business Overview
Table 70. TOTO Advanced Ceramics Ceramics For Semiconductor Manufacturing Equipment Product
Table 71. TOTO Advanced Ceramics Revenue in Ceramics For Semiconductor Manufacturing Equipment Business (US$ Million), 2021–2026
Table 72. TOTO Advanced Ceramics Recent Development
Table 73. Niterra Co., Ltd. Company Details
Table 74. Niterra Co., Ltd. Business Overview
Table 75. Niterra Co., Ltd. Ceramics For Semiconductor Manufacturing Equipment Product
Table 76. Niterra Co., Ltd. Revenue in Ceramics For Semiconductor Manufacturing Equipment Business (US$ Million), 2021–2026
Table 77. Niterra Co., Ltd. Recent Development
Table 78. ASUZAC Fine Ceramics Company Details
Table 79. ASUZAC Fine Ceramics Business Overview
Table 80. ASUZAC Fine Ceramics Ceramics For Semiconductor Manufacturing Equipment Product
Table 81. ASUZAC Fine Ceramics Revenue in Ceramics For Semiconductor Manufacturing Equipment Business (US$ Million), 2021–2026
Table 82. ASUZAC Fine Ceramics Recent Development
Table 83. Japan Fine Ceramics Co., Ltd. (JFC) Company Details
Table 84. Japan Fine Ceramics Co., Ltd. (JFC) Business Overview
Table 85. Japan Fine Ceramics Co., Ltd. (JFC) Ceramics For Semiconductor Manufacturing Equipment Product
Table 86. Japan Fine Ceramics Co., Ltd. (JFC) Revenue in Ceramics For Semiconductor Manufacturing Equipment Business (US$ Million), 2021–2026
Table 87. Japan Fine Ceramics Co., Ltd. (JFC) Recent Development
Table 88. Maruwa Company Details
Table 89. Maruwa Business Overview
Table 90. Maruwa Ceramics For Semiconductor Manufacturing Equipment Product
Table 91. Maruwa Revenue in Ceramics For Semiconductor Manufacturing Equipment Business (US$ Million), 2021–2026
Table 92. Maruwa Recent Development
Table 93. Nishimura Advanced Ceramics Company Details
Table 94. Nishimura Advanced Ceramics Business Overview
Table 95. Nishimura Advanced Ceramics Ceramics For Semiconductor Manufacturing Equipment Product
Table 96. Nishimura Advanced Ceramics Revenue in Ceramics For Semiconductor Manufacturing Equipment Business (US$ Million), 2021–2026
Table 97. Nishimura Advanced Ceramics Recent Development
Table 98. Repton Co., Ltd. Company Details
Table 99. Repton Co., Ltd. Business Overview
Table 100. Repton Co., Ltd. Ceramics For Semiconductor Manufacturing Equipment Product
Table 101. Repton Co., Ltd. Revenue in Ceramics For Semiconductor Manufacturing Equipment Business (US$ Million), 2021–2026
Table 102. Repton Co., Ltd. Recent Development
Table 103. Pacific Rundum Company Details
Table 104. Pacific Rundum Business Overview
Table 105. Pacific Rundum Ceramics For Semiconductor Manufacturing Equipment Product
Table 106. Pacific Rundum Revenue in Ceramics For Semiconductor Manufacturing Equipment Business (US$ Million), 2021–2026
Table 107. Pacific Rundum Recent Development
Table 108. Coorstek Company Details
Table 109. Coorstek Business Overview
Table 110. Coorstek Ceramics For Semiconductor Manufacturing Equipment Product
Table 111. Coorstek Revenue in Ceramics For Semiconductor Manufacturing Equipment Business (US$ Million), 2021–2026
Table 112. Coorstek Recent Development
Table 113. 3M Company Details
Table 114. 3M Business Overview
Table 115. 3M Ceramics For Semiconductor Manufacturing Equipment Product
Table 116. 3M Revenue in Ceramics For Semiconductor Manufacturing Equipment Business (US$ Million), 2021–2026
Table 117. 3M Recent Development
Table 118. Bullen Ultrasonics Company Details
Table 119. Bullen Ultrasonics Business Overview
Table 120. Bullen Ultrasonics Ceramics For Semiconductor Manufacturing Equipment Product
Table 121. Bullen Ultrasonics Revenue in Ceramics For Semiconductor Manufacturing Equipment Business (US$ Million), 2021–2026
Table 122. Bullen Ultrasonics Recent Development
Table 123. STC Material Solutions Company Details
Table 124. STC Material Solutions Business Overview
Table 125. STC Material Solutions Ceramics For Semiconductor Manufacturing Equipment Product
Table 126. STC Material Solutions Revenue in Ceramics For Semiconductor Manufacturing Equipment Business (US$ Million), 2021–2026
Table 127. STC Material Solutions Recent Development
Table 128. Precision Ferrites & Ceramics (PFC) Company Details
Table 129. Precision Ferrites & Ceramics (PFC) Business Overview
Table 130. Precision Ferrites & Ceramics (PFC) Ceramics For Semiconductor Manufacturing Equipment Product
Table 131. Precision Ferrites & Ceramics (PFC) Revenue in Ceramics For Semiconductor Manufacturing Equipment Business (US$ Million), 2021–2026
Table 132. Precision Ferrites & Ceramics (PFC) Recent Development
Table 133. Ortech Ceramics Company Details
Table 134. Ortech Ceramics Business Overview
Table 135. Ortech Ceramics Ceramics For Semiconductor Manufacturing Equipment Product
Table 136. Ortech Ceramics Revenue in Ceramics For Semiconductor Manufacturing Equipment Business (US$ Million), 2021–2026
Table 137. Ortech Ceramics Recent Development
Table 138. Morgan Advanced Materials Company Details
Table 139. Morgan Advanced Materials Business Overview
Table 140. Morgan Advanced Materials Ceramics For Semiconductor Manufacturing Equipment Product
Table 141. Morgan Advanced Materials Revenue in Ceramics For Semiconductor Manufacturing Equipment Business (US$ Million), 2021–2026
Table 142. Morgan Advanced Materials Recent Development
Table 143. CeramTec Company Details
Table 144. CeramTec Business Overview
Table 145. CeramTec Ceramics For Semiconductor Manufacturing Equipment Product
Table 146. CeramTec Revenue in Ceramics For Semiconductor Manufacturing Equipment Business (US$ Million), 2021–2026
Table 147. CeramTec Recent Development
Table 148. Saint-Gobain Company Details
Table 149. Saint-Gobain Business Overview
Table 150. Saint-Gobain Ceramics For Semiconductor Manufacturing Equipment Product
Table 151. Saint-Gobain Revenue in Ceramics For Semiconductor Manufacturing Equipment Business (US$ Million), 2021–2026
Table 152. Saint-Gobain Recent Development
Table 153. Schunk Xycarb Technology Company Details
Table 154. Schunk Xycarb Technology Business Overview
Table 155. Schunk Xycarb Technology Ceramics For Semiconductor Manufacturing Equipment Product
Table 156. Schunk Xycarb Technology Revenue in Ceramics For Semiconductor Manufacturing Equipment Business (US$ Million), 2021–2026
Table 157. Schunk Xycarb Technology Recent Development
Table 158. Advanced Special Tools (AST) Company Details
Table 159. Advanced Special Tools (AST) Business Overview
Table 160. Advanced Special Tools (AST) Ceramics For Semiconductor Manufacturing Equipment Product
Table 161. Advanced Special Tools (AST) Revenue in Ceramics For Semiconductor Manufacturing Equipment Business (US$ Million), 2021–2026
Table 162. Advanced Special Tools (AST) Recent Development
Table 163. MiCo Ceramics Co., Ltd. Company Details
Table 164. MiCo Ceramics Co., Ltd. Business Overview
Table 165. MiCo Ceramics Co., Ltd. Ceramics For Semiconductor Manufacturing Equipment Product
Table 166. MiCo Ceramics Co., Ltd. Revenue in Ceramics For Semiconductor Manufacturing Equipment Business (US$ Million), 2021–2026
Table 167. MiCo Ceramics Co., Ltd. Recent Development
Table 168. WONIK QnC Company Details
Table 169. WONIK QnC Business Overview
Table 170. WONIK QnC Ceramics For Semiconductor Manufacturing Equipment Product
Table 171. WONIK QnC Revenue in Ceramics For Semiconductor Manufacturing Equipment Business (US$ Million), 2021–2026
Table 172. WONIK QnC Recent Development
Table 173. Micro Ceramics Ltd Company Details
Table 174. Micro Ceramics Ltd Business Overview
Table 175. Micro Ceramics Ltd Ceramics For Semiconductor Manufacturing Equipment Product
Table 176. Micro Ceramics Ltd Revenue in Ceramics For Semiconductor Manufacturing Equipment Business (US$ Million), 2021–2026
Table 177. Micro Ceramics Ltd Recent Development
Table 178. Suzhou KemaTek, Inc. Company Details
Table 179. Suzhou KemaTek, Inc. Business Overview
Table 180. Suzhou KemaTek, Inc. Ceramics For Semiconductor Manufacturing Equipment Product
Table 181. Suzhou KemaTek, Inc. Revenue in Ceramics For Semiconductor Manufacturing Equipment Business (US$ Million), 2021–2026
Table 182. Suzhou KemaTek, Inc. Recent Development
Table 183. Shanghai Companion Company Details
Table 184. Shanghai Companion Business Overview
Table 185. Shanghai Companion Ceramics For Semiconductor Manufacturing Equipment Product
Table 186. Shanghai Companion Revenue in Ceramics For Semiconductor Manufacturing Equipment Business (US$ Million), 2021–2026
Table 187. Shanghai Companion Recent Development
Table 188. Sanzer (Shanghai) New Materials Technology Company Details
Table 189. Sanzer (Shanghai) New Materials Technology Business Overview
Table 190. Sanzer (Shanghai) New Materials Technology Ceramics For Semiconductor Manufacturing Equipment Product
Table 191. Sanzer (Shanghai) New Materials Technology Revenue in Ceramics For Semiconductor Manufacturing Equipment Business (US$ Million), 2021–2026
Table 192. Sanzer (Shanghai) New Materials Technology Recent Development
Table 193. St.Cera Co., Ltd Company Details
Table 194. St.Cera Co., Ltd Business Overview
Table 195. St.Cera Co., Ltd Ceramics For Semiconductor Manufacturing Equipment Product
Table 196. St.Cera Co., Ltd Revenue in Ceramics For Semiconductor Manufacturing Equipment Business (US$ Million), 2021–2026
Table 197. St.Cera Co., Ltd Recent Development
Table 198. Fountyl Company Details
Table 199. Fountyl Business Overview
Table 200. Fountyl Ceramics For Semiconductor Manufacturing Equipment Product
Table 201. Fountyl Revenue in Ceramics For Semiconductor Manufacturing Equipment Business (US$ Million), 2021–2026
Table 202. Fountyl Recent Development
Table 203. Hebei Sinopack Electronic Technology Company Details
Table 204. Hebei Sinopack Electronic Technology Business Overview
Table 205. Hebei Sinopack Electronic Technology Ceramics For Semiconductor Manufacturing Equipment Product
Table 206. Hebei Sinopack Electronic Technology Revenue in Ceramics For Semiconductor Manufacturing Equipment Business (US$ Million), 2021–2026
Table 207. Hebei Sinopack Electronic Technology Recent Development
Table 208. ChaoZhou Three-circle Company Details
Table 209. ChaoZhou Three-circle Business Overview
Table 210. ChaoZhou Three-circle Ceramics For Semiconductor Manufacturing Equipment Product
Table 211. ChaoZhou Three-circle Revenue in Ceramics For Semiconductor Manufacturing Equipment Business (US$ Million), 2021–2026
Table 212. ChaoZhou Three-circle Recent Development
Table 213. Fujian Huaqing Electronic Material Technology Company Details
Table 214. Fujian Huaqing Electronic Material Technology Business Overview
Table 215. Fujian Huaqing Electronic Material Technology Ceramics For Semiconductor Manufacturing Equipment Product
Table 216. Fujian Huaqing Electronic Material Technology Revenue in Ceramics For Semiconductor Manufacturing Equipment Business (US$ Million), 2021–2026
Table 217. Fujian Huaqing Electronic Material Technology Recent Development
Table 218. 3X Ceramic Parts Company Company Details
Table 219. 3X Ceramic Parts Company Business Overview
Table 220. 3X Ceramic Parts Company Ceramics For Semiconductor Manufacturing Equipment Product
Table 221. 3X Ceramic Parts Company Revenue in Ceramics For Semiconductor Manufacturing Equipment Business (US$ Million), 2021–2026
Table 222. 3X Ceramic Parts Company Recent Development
Table 223. Krosaki Harima Corporation Company Details
Table 224. Krosaki Harima Corporation Business Overview
Table 225. Krosaki Harima Corporation Ceramics For Semiconductor Manufacturing Equipment Product
Table 226. Krosaki Harima Corporation Revenue in Ceramics For Semiconductor Manufacturing Equipment Business (US$ Million), 2021–2026
Table 227. Krosaki Harima Corporation Recent Development
Table 228. Kallex Company,Ltd Company Details
Table 229. Kallex Company,Ltd Business Overview
Table 230. Kallex Company,Ltd Ceramics For Semiconductor Manufacturing Equipment Product
Table 231. Kallex Company,Ltd Revenue in Ceramics For Semiconductor Manufacturing Equipment Business (US$ Million), 2021–2026
Table 232. Kallex Company,Ltd Recent Development
Table 233. Shaanxi UDC Materials Technology Company Details
Table 234. Shaanxi UDC Materials Technology Business Overview
Table 235. Shaanxi UDC Materials Technology Ceramics For Semiconductor Manufacturing Equipment Product
Table 236. Shaanxi UDC Materials Technology Revenue in Ceramics For Semiconductor Manufacturing Equipment Business (US$ Million), 2021–2026
Table 237. Shaanxi UDC Materials Technology Recent Development
Table 238. AGC Company Details
Table 239. AGC Business Overview
Table 240. AGC Ceramics For Semiconductor Manufacturing Equipment Product
Table 241. AGC Revenue in Ceramics For Semiconductor Manufacturing Equipment Business (US$ Million), 2021–2026
Table 242. AGC Recent Development
Table 243. Coalition Technology Company Details
Table 244. Coalition Technology Business Overview
Table 245. Coalition Technology Ceramics For Semiconductor Manufacturing Equipment Product
Table 246. Coalition Technology Revenue in Ceramics For Semiconductor Manufacturing Equipment Business (US$ Million), 2021–2026
Table 247. Coalition Technology Recent Development
Table 248. Solmics Company Details
Table 249. Solmics Business Overview
Table 250. Solmics Ceramics For Semiconductor Manufacturing Equipment Product
Table 251. Solmics Revenue in Ceramics For Semiconductor Manufacturing Equipment Business (US$ Million), 2021–2026
Table 252. Solmics Recent Development
Table 253. Research Programs/Design for This Report
Table 254. Key Data Information from Secondary Sources
Table 255. Key Data Information from Primary Sources
Table 256. Authors List of This Report
List of Figures
Figure 1. Ceramics For Semiconductor Manufacturing Equipment Picture
Figure 2. Global Ceramics For Semiconductor Manufacturing Equipment Market Size Comparison by Material (US$ Million), 2021–2032
Figure 3. Global Ceramics For Semiconductor Manufacturing Equipment Market Share by Material: 2025 vs 2032
Figure 4. Alumina Ceramics Features
Figure 5. AlN Ceramics Features
Figure 6. SiC Ceramics Features
Figure 7. Si3N4 Ceramics Features
Figure 8. Others Features
Figure 9. Global Ceramics For Semiconductor Manufacturing Equipment Market Size Comparison by Wafer Size (US$ Million), 2021–2032
Figure 10. 300mm Semiconductor Equipment Features
Figure 11. 200mm Semiconductor Equipment Features
Figure 12. Others Features
Figure 13. Global Ceramics For Semiconductor Manufacturing Equipment Market Size by Application (US$ Million), 2021–2032
Figure 14. Global Ceramics For Semiconductor Manufacturing Equipment Market Share by Application: 2025 vs 2032
Figure 15. Semiconductor Deposition Equipment Case Studies
Figure 16. Semiconductor Etch Equipment Case Studies
Figure 17. Lithography Machines Case Studies
Figure 18. Ion Implant Equipment Case Studies
Figure 19. Heat Treatment Equipment Case Studies
Figure 20. CMP Equipment Case Studies
Figure 21. Wafer Handling Case Studies
Figure 22. Assembly Equipment Case Studies
Figure 23. Others Case Studies
Figure 24. Ceramics For Semiconductor Manufacturing Equipment Report Years Considered
Figure 25. Global Ceramics For Semiconductor Manufacturing Equipment Market Size (US$ Million), Year-over-Year: 2021–2032
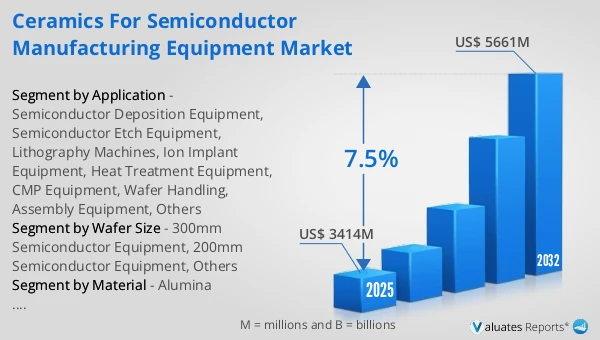
Figure 26. Global Ceramics For Semiconductor Manufacturing Equipment Market Size, (US$ Million), 2021 vs 2025 vs 2032
Figure 27. Global Ceramics For Semiconductor Manufacturing Equipment Market Share by Region: 2025 vs 2032
Figure 28. Global Ceramics For Semiconductor Manufacturing Equipment Market Share by Players in 2025
Figure 29. Global Ceramics For Semiconductor Manufacturing Equipment Market Share by Company Type (Tier 1, Tier 2, and Tier 3)
Figure 30. The Top 10 and 5 Players Market Share by Ceramics For Semiconductor Manufacturing Equipment Revenue in 2025
Figure 31. North America Ceramics For Semiconductor Manufacturing Equipment Market Size YoY Growth (US$ Million), 2021–2032
Figure 32. North America Ceramics For Semiconductor Manufacturing Equipment Market Share by Country (2021–2032)
Figure 33. United States Ceramics For Semiconductor Manufacturing Equipment Market Size YoY Growth (US$ Million), 2021–2032
Figure 34. Canada Ceramics For Semiconductor Manufacturing Equipment Market Size YoY Growth (US$ Million), 2021–2032
Figure 35. Europe Ceramics For Semiconductor Manufacturing Equipment Market Size YoY Growth (US$ Million), 2021–2032
Figure 36. Europe Ceramics For Semiconductor Manufacturing Equipment Market Share by Country (2021–2032)
Figure 37. Germany Ceramics For Semiconductor Manufacturing Equipment Market Size YoY Growth (US$ Million), 2021–2032
Figure 38. France Ceramics For Semiconductor Manufacturing Equipment Market Size YoY Growth (US$ Million), 2021–2032
Figure 39. U.K. Ceramics For Semiconductor Manufacturing Equipment Market Size YoY Growth (US$ Million), 2021–2032
Figure 40. Italy Ceramics For Semiconductor Manufacturing Equipment Market Size YoY Growth (US$ Million), 2021–2032
Figure 41. Russia Ceramics For Semiconductor Manufacturing Equipment Market Size YoY Growth (US$ Million), 2021–2032
Figure 42. Ireland Ceramics For Semiconductor Manufacturing Equipment Market Size YoY Growth (US$ Million), 2021–2032
Figure 43. Asia-Pacific Ceramics For Semiconductor Manufacturing Equipment Market Size YoY Growth (US$ Million), 2021–2032
Figure 44. Asia-Pacific Ceramics For Semiconductor Manufacturing Equipment Market Share by Region (2021–2032)
Figure 45. China Ceramics For Semiconductor Manufacturing Equipment Market Size YoY Growth (US$ Million), 2021–2032
Figure 46. Japan Ceramics For Semiconductor Manufacturing Equipment Market Size YoY Growth (US$ Million), 2021–2032
Figure 47. South Korea Ceramics For Semiconductor Manufacturing Equipment Market Size YoY Growth (US$ Million), 2021–2032
Figure 48. Southeast Asia Ceramics For Semiconductor Manufacturing Equipment Market Size YoY Growth (US$ Million), 2021–2032
Figure 49. India Ceramics For Semiconductor Manufacturing Equipment Market Size YoY Growth (US$ Million), 2021–2032
Figure 50. Australia & New Zealand Ceramics For Semiconductor Manufacturing Equipment Market Size YoY Growth (US$ Million), 2021–2032
Figure 51. Latin America Ceramics For Semiconductor Manufacturing Equipment Market Size YoY Growth (US$ Million), 2021–2032
Figure 52. Latin America Ceramics For Semiconductor Manufacturing Equipment Market Share by Country (2021–2032)
Figure 53. Mexico Ceramics For Semiconductor Manufacturing Equipment Market Size YoY Growth (US$ Million), 2021–2032
Figure 54. Brazil Ceramics For Semiconductor Manufacturing Equipment Market Size YoY Growth (US$ Million), 2021–2032
Figure 55. Middle East & Africa Ceramics For Semiconductor Manufacturing Equipment Market Size YoY Growth (US$ Million), 2021–2032
Figure 56. Middle East & Africa Ceramics For Semiconductor Manufacturing Equipment Market Share by Country (2021–2032)
Figure 57. Israel Ceramics For Semiconductor Manufacturing Equipment Market Size YoY Growth (US$ Million), 2021–2032
Figure 58. Saudi Arabia Ceramics For Semiconductor Manufacturing Equipment Market Size YoY Growth (US$ Million), 2021–2032
Figure 59. UAE Ceramics For Semiconductor Manufacturing Equipment Market Size YoY Growth (US$ Million), 2021–2032
Figure 60. NGK Insulators Revenue Growth Rate in Ceramics For Semiconductor Manufacturing Equipment Business (2021–2026)
Figure 61. Kyocera Revenue Growth Rate in Ceramics For Semiconductor Manufacturing Equipment Business (2021–2026)
Figure 62. Ferrotec Revenue Growth Rate in Ceramics For Semiconductor Manufacturing Equipment Business (2021–2026)
Figure 63. TOTO Advanced Ceramics Revenue Growth Rate in Ceramics For Semiconductor Manufacturing Equipment Business (2021–2026)
Figure 64. Niterra Co., Ltd. Revenue Growth Rate in Ceramics For Semiconductor Manufacturing Equipment Business (2021–2026)
Figure 65. ASUZAC Fine Ceramics Revenue Growth Rate in Ceramics For Semiconductor Manufacturing Equipment Business (2021–2026)
Figure 66. Japan Fine Ceramics Co., Ltd. (JFC) Revenue Growth Rate in Ceramics For Semiconductor Manufacturing Equipment Business (2021–2026)
Figure 67. Maruwa Revenue Growth Rate in Ceramics For Semiconductor Manufacturing Equipment Business (2021–2026)
Figure 68. Nishimura Advanced Ceramics Revenue Growth Rate in Ceramics For Semiconductor Manufacturing Equipment Business (2021–2026)
Figure 69. Repton Co., Ltd. Revenue Growth Rate in Ceramics For Semiconductor Manufacturing Equipment Business (2021–2026)
Figure 70. Pacific Rundum Revenue Growth Rate in Ceramics For Semiconductor Manufacturing Equipment Business (2021–2026)
Figure 71. Coorstek Revenue Growth Rate in Ceramics For Semiconductor Manufacturing Equipment Business (2021–2026)
Figure 72. 3M Revenue Growth Rate in Ceramics For Semiconductor Manufacturing Equipment Business (2021–2026)
Figure 73. Bullen Ultrasonics Revenue Growth Rate in Ceramics For Semiconductor Manufacturing Equipment Business (2021–2026)
Figure 74. STC Material Solutions Revenue Growth Rate in Ceramics For Semiconductor Manufacturing Equipment Business (2021–2026)
Figure 75. Precision Ferrites & Ceramics (PFC) Revenue Growth Rate in Ceramics For Semiconductor Manufacturing Equipment Business (2021–2026)
Figure 76. Ortech Ceramics Revenue Growth Rate in Ceramics For Semiconductor Manufacturing Equipment Business (2021–2026)
Figure 77. Morgan Advanced Materials Revenue Growth Rate in Ceramics For Semiconductor Manufacturing Equipment Business (2021–2026)
Figure 78. CeramTec Revenue Growth Rate in Ceramics For Semiconductor Manufacturing Equipment Business (2021–2026)
Figure 79. Saint-Gobain Revenue Growth Rate in Ceramics For Semiconductor Manufacturing Equipment Business (2021–2026)
Figure 80. Schunk Xycarb Technology Revenue Growth Rate in Ceramics For Semiconductor Manufacturing Equipment Business (2021–2026)
Figure 81. Advanced Special Tools (AST) Revenue Growth Rate in Ceramics For Semiconductor Manufacturing Equipment Business (2021–2026)
Figure 82. MiCo Ceramics Co., Ltd. Revenue Growth Rate in Ceramics For Semiconductor Manufacturing Equipment Business (2021–2026)
Figure 83. WONIK QnC Revenue Growth Rate in Ceramics For Semiconductor Manufacturing Equipment Business (2021–2026)
Figure 84. Micro Ceramics Ltd Revenue Growth Rate in Ceramics For Semiconductor Manufacturing Equipment Business (2021–2026)
Figure 85. Suzhou KemaTek, Inc. Revenue Growth Rate in Ceramics For Semiconductor Manufacturing Equipment Business (2021–2026)
Figure 86. Shanghai Companion Revenue Growth Rate in Ceramics For Semiconductor Manufacturing Equipment Business (2021–2026)
Figure 87. Sanzer (Shanghai) New Materials Technology Revenue Growth Rate in Ceramics For Semiconductor Manufacturing Equipment Business (2021–2026)
Figure 88. St.Cera Co., Ltd Revenue Growth Rate in Ceramics For Semiconductor Manufacturing Equipment Business (2021–2026)
Figure 89. Fountyl Revenue Growth Rate in Ceramics For Semiconductor Manufacturing Equipment Business (2021–2026)
Figure 90. Hebei Sinopack Electronic Technology Revenue Growth Rate in Ceramics For Semiconductor Manufacturing Equipment Business (2021–2026)
Figure 91. ChaoZhou Three-circle Revenue Growth Rate in Ceramics For Semiconductor Manufacturing Equipment Business (2021–2026)
Figure 92. Fujian Huaqing Electronic Material Technology Revenue Growth Rate in Ceramics For Semiconductor Manufacturing Equipment Business (2021–2026)
Figure 93. 3X Ceramic Parts Company Revenue Growth Rate in Ceramics For Semiconductor Manufacturing Equipment Business (2021–2026)
Figure 94. Krosaki Harima Corporation Revenue Growth Rate in Ceramics For Semiconductor Manufacturing Equipment Business (2021–2026)
Figure 95. Kallex Company,Ltd Revenue Growth Rate in Ceramics For Semiconductor Manufacturing Equipment Business (2021–2026)
Figure 96. Shaanxi UDC Materials Technology Revenue Growth Rate in Ceramics For Semiconductor Manufacturing Equipment Business (2021–2026)
Figure 97. AGC Revenue Growth Rate in Ceramics For Semiconductor Manufacturing Equipment Business (2021–2026)
Figure 98. Coalition Technology Revenue Growth Rate in Ceramics For Semiconductor Manufacturing Equipment Business (2021–2026)
Figure 99. Solmics Revenue Growth Rate in Ceramics For Semiconductor Manufacturing Equipment Business (2021–2026)
Figure 100. Bottom-up and Top-down Approaches for This Report
Figure 101. Data Triangulation
Figure 102. Key Executives Interviewed