List of Tables
Table 1. Global Endpoint Adjudication Service Market Size Growth Rate by Type (US$ Million): 2020 VS 2024 VS 2031
Table 2. Key Players of Layered Architecture Decision Making
Table 3. Key Players of Client-Server Decision Making
Table 4. Key Players of Master-Slave Negotiation Decision Making
Table 5. Key Players of Microservice Mesh Decision Making
Table 6. Global Endpoint Adjudication Service Market Size Growth Rate by Decision-making mechanisms (US$ Million): 2020 VS 2024 VS 2031
Table 7. Key Players of Autocratic Decision-Making
Table 8. Key Players of Consultative Decision-Making
Table 9. Key Players of Rules-Driven Decision-Making
Table 10. Key Players of Machine Learning-Driven Decision-Making
Table 11. Global Endpoint Adjudication Service Market Size Growth Rate by Deployment Perspective (US$ Million): 2020 VS 2024 VS 2031
Table 12. Key Players of On-premises Deployment
Table 13. Key Players of Public Cloud Deployment
Table 14. Key Players of Hybrid Cloud Deployment
Table 15. Key Players of Edge Deployment
Table 16. Global Endpoint Adjudication Service Market Size Growth by Application (US$ Million): 2020 VS 2024 VS 2031
Table 17. Global Endpoint Adjudication Service Market Size by Region (US$ Million): 2020 VS 2024 VS 2031
Table 18. Global Endpoint Adjudication Service Market Size by Region (2020-2025) & (US$ Million)
Table 19. Global Endpoint Adjudication Service Market Share by Region (2020-2025)
Table 20. Global Endpoint Adjudication Service Forecasted Market Size by Region (2026-2031) & (US$ Million)
Table 21. Global Endpoint Adjudication Service Market Share by Region (2026-2031)
Table 22. Endpoint Adjudication Service Market Trends
Table 23. Endpoint Adjudication Service Market Drivers
Table 24. Endpoint Adjudication Service Market Challenges
Table 25. Endpoint Adjudication Service Market Restraints
Table 26. Global Endpoint Adjudication Service Revenue by Players (2020-2025) & (US$ Million)
Table 27. Global Endpoint Adjudication Service Market Share by Players (2020-2025)
Table 28. Global Top Endpoint Adjudication Service Players by Company Type (Tier 1, Tier 2, and Tier 3) & (based on the Revenue in Endpoint Adjudication Service as of 2024)
Table 29. Ranking of Global Top Endpoint Adjudication Service Companies by Revenue (US$ Million) in 2024
Table 30. Global 5 Largest Players Market Share by Endpoint Adjudication Service Revenue (CR5 and HHI) & (2020-2025)
Table 31. Global Key Players of Endpoint Adjudication Service, Headquarters and Area Served
Table 32. Global Key Players of Endpoint Adjudication Service, Product and Application
Table 33. Global Key Players of Endpoint Adjudication Service, Date of Enter into This Industry
Table 34. Mergers & Acquisitions, Expansion Plans
Table 35. Global Endpoint Adjudication Service Market Size by Type (2020-2025) & (US$ Million)
Table 36. Global Endpoint Adjudication Service Revenue Market Share by Type (2020-2025)
Table 37. Global Endpoint Adjudication Service Forecasted Market Size by Type (2026-2031) & (US$ Million)
Table 38. Global Endpoint Adjudication Service Revenue Market Share by Type (2026-2031)
Table 39. Global Endpoint Adjudication Service Market Size by Application (2020-2025) & (US$ Million)
Table 40. Global Endpoint Adjudication Service Revenue Market Share by Application (2020-2025)
Table 41. Global Endpoint Adjudication Service Forecasted Market Size by Application (2026-2031) & (US$ Million)
Table 42. Global Endpoint Adjudication Service Revenue Market Share by Application (2026-2031)
Table 43. North America Endpoint Adjudication Service Market Size Growth Rate by Country (US$ Million): 2020 VS 2024 VS 2031
Table 44. North America Endpoint Adjudication Service Market Size by Country (2020-2025) & (US$ Million)
Table 45. North America Endpoint Adjudication Service Market Size by Country (2026-2031) & (US$ Million)
Table 46. Europe Endpoint Adjudication Service Market Size Growth Rate by Country (US$ Million): 2020 VS 2024 VS 2031
Table 47. Europe Endpoint Adjudication Service Market Size by Country (2020-2025) & (US$ Million)
Table 48. Europe Endpoint Adjudication Service Market Size by Country (2026-2031) & (US$ Million)
Table 49. Asia-Pacific Endpoint Adjudication Service Market Size Growth Rate by Region (US$ Million): 2020 VS 2024 VS 2031
Table 50. Asia-Pacific Endpoint Adjudication Service Market Size by Region (2020-2025) & (US$ Million)
Table 51. Asia-Pacific Endpoint Adjudication Service Market Size by Region (2026-2031) & (US$ Million)
Table 52. Latin America Endpoint Adjudication Service Market Size Growth Rate by Country (US$ Million): 2020 VS 2024 VS 2031
Table 53. Latin America Endpoint Adjudication Service Market Size by Country (2020-2025) & (US$ Million)
Table 54. Latin America Endpoint Adjudication Service Market Size by Country (2026-2031) & (US$ Million)
Table 55. Middle East & Africa Endpoint Adjudication Service Market Size Growth Rate by Country (US$ Million): 2020 VS 2024 VS 2031
Table 56. Middle East & Africa Endpoint Adjudication Service Market Size by Country (2020-2025) & (US$ Million)
Table 57. Middle East & Africa Endpoint Adjudication Service Market Size by Country (2026-2031) & (US$ Million)
Table 58. Microsoft Company Details
Table 59. Microsoft Business Overview
Table 60. Microsoft Endpoint Adjudication Service Product
Table 61. Microsoft Revenue in Endpoint Adjudication Service Business (2020-2025) & (US$ Million)
Table 62. Microsoft Recent Development
Table 63. Cisco Secure Company Details
Table 64. Cisco Secure Business Overview
Table 65. Cisco Secure Endpoint Adjudication Service Product
Table 66. Cisco Secure Revenue in Endpoint Adjudication Service Business (2020-2025) & (US$ Million)
Table 67. Cisco Secure Recent Development
Table 68. Carbon Black Company Details
Table 69. Carbon Black Business Overview
Table 70. Carbon Black Endpoint Adjudication Service Product
Table 71. Carbon Black Revenue in Endpoint Adjudication Service Business (2020-2025) & (US$ Million)
Table 72. Carbon Black Recent Development
Table 73. Sophos Company Details
Table 74. Sophos Business Overview
Table 75. Sophos Endpoint Adjudication Service Product
Table 76. Sophos Revenue in Endpoint Adjudication Service Business (2020-2025) & (US$ Million)
Table 77. Sophos Recent Development
Table 78. Tata Consultancy Services Company Details
Table 79. Tata Consultancy Services Business Overview
Table 80. Tata Consultancy Services Endpoint Adjudication Service Product
Table 81. Tata Consultancy Services Revenue in Endpoint Adjudication Service Business (2020-2025) & (US$ Million)
Table 82. Tata Consultancy Services Recent Development
Table 83. Infosys Company Details
Table 84. Infosys Business Overview
Table 85. Infosys Endpoint Adjudication Service Product
Table 86. Infosys Revenue in Endpoint Adjudication Service Business (2020-2025) & (US$ Million)
Table 87. Infosys Recent Development
Table 88. Hangzhou Endpoint Network Technology Company Details
Table 89. Hangzhou Endpoint Network Technology Business Overview
Table 90. Hangzhou Endpoint Network Technology Endpoint Adjudication Service Product
Table 91. Hangzhou Endpoint Network Technology Revenue in Endpoint Adjudication Service Business (2020-2025) & (US$ Million)
Table 92. Hangzhou Endpoint Network Technology Recent Development
Table 93. BANOOK GROUP Company Details
Table 94. BANOOK GROUP Business Overview
Table 95. BANOOK GROUP Endpoint Adjudication Service Product
Table 96. BANOOK GROUP Revenue in Endpoint Adjudication Service Business (2020-2025) & (US$ Million)
Table 97. BANOOK GROUP Recent Development
Table 98. ICON plc Company Details
Table 99. ICON plc Business Overview
Table 100. ICON plc Endpoint Adjudication Service Product
Table 101. ICON plc Revenue in Endpoint Adjudication Service Business (2020-2025) & (US$ Million)
Table 102. ICON plc Recent Development
Table 103. Ethical GmbH Company Details
Table 104. Ethical GmbH Business Overview
Table 105. Ethical GmbH Endpoint Adjudication Service Product
Table 106. Ethical GmbH Revenue in Endpoint Adjudication Service Business (2020-2025) & (US$ Million)
Table 107. Ethical GmbH Recent Development
Table 108. Advarra Company Details
Table 109. Advarra Business Overview
Table 110. Advarra Endpoint Adjudication Service Product
Table 111. Advarra Revenue in Endpoint Adjudication Service Business (2020-2025) & (US$ Million)
Table 112. Advarra Recent Development
Table 113. Sitero Company Details
Table 114. Sitero Business Overview
Table 115. Sitero Endpoint Adjudication Service Product
Table 116. Sitero Revenue in Endpoint Adjudication Service Business (2020-2025) & (US$ Million)
Table 117. Sitero Recent Development
Table 118. George Clinical Company Details
Table 119. George Clinical Business Overview
Table 120. George Clinical Endpoint Adjudication Service Product
Table 121. George Clinical Revenue in Endpoint Adjudication Service Business (2020-2025) & (US$ Million)
Table 122. George Clinical Recent Development
Table 123. Medidata Solutions Company Details
Table 124. Medidata Solutions Business Overview
Table 125. Medidata Solutions Endpoint Adjudication Service Product
Table 126. Medidata Solutions Revenue in Endpoint Adjudication Service Business (2020-2025) & (US$ Million)
Table 127. Medidata Solutions Recent Development
Table 128. WCG Company Details
Table 129. WCG Business Overview
Table 130. WCG Endpoint Adjudication Service Product
Table 131. WCG Revenue in Endpoint Adjudication Service Business (2020-2025) & (US$ Million)
Table 132. WCG Recent Development
Table 133. Judi for Adjumination Company Details
Table 134. Judi for Adjumination Business Overview
Table 135. Judi for Adjumination Endpoint Adjudication Service Product
Table 136. Judi for Adjumination Revenue in Endpoint Adjudication Service Business (2020-2025) & (US$ Million)
Table 137. Judi for Adjumination Recent Development
Table 138. Clario Company Details
Table 139. Clario Business Overview
Table 140. Clario Endpoint Adjudication Service Product
Table 141. Clario Revenue in Endpoint Adjudication Service Business (2020-2025) & (US$ Million)
Table 142. Clario Recent Development
Table 143. ITREAS Company Details
Table 144. ITREAS Business Overview
Table 145. ITREAS Endpoint Adjudication Service Product
Table 146. ITREAS Revenue in Endpoint Adjudication Service Business (2020-2025) & (US$ Million)
Table 147. ITREAS Recent Development
Table 148. CISYS LifeSciences Company Details
Table 149. CISYS LifeSciences Business Overview
Table 150. CISYS LifeSciences Endpoint Adjudication Service Product
Table 151. CISYS LifeSciences Revenue in Endpoint Adjudication Service Business (2020-2025) & (US$ Million)
Table 152. CISYS LifeSciences Recent Development
Table 153. Crucial Data Solutions Company Details
Table 154. Crucial Data Solutions Business Overview
Table 155. Crucial Data Solutions Endpoint Adjudication Service Product
Table 156. Crucial Data Solutions Revenue in Endpoint Adjudication Service Business (2020-2025) & (US$ Million)
Table 157. Crucial Data Solutions Recent Development
Table 158. Voiant Company Details
Table 159. Voiant Business Overview
Table 160. Voiant Endpoint Adjudication Service Product
Table 161. Voiant Revenue in Endpoint Adjudication Service Business (2020-2025) & (US$ Million)
Table 162. Voiant Recent Development
Table 163. Exom Company Details
Table 164. Exom Business Overview
Table 165. Exom Endpoint Adjudication Service Product
Table 166. Exom Revenue in Endpoint Adjudication Service Business (2020-2025) & (US$ Million)
Table 167. Exom Recent Development
Table 168. TCell Clinical Services Company Details
Table 169. TCell Clinical Services Business Overview
Table 170. TCell Clinical Services Endpoint Adjudication Service Product
Table 171. TCell Clinical Services Revenue in Endpoint Adjudication Service Business (2020-2025) & (US$ Million)
Table 172. TCell Clinical Services Recent Development
Table 173. Research Programs/Design for This Report
Table 174. Key Data Information from Secondary Sources
Table 175. Key Data Information from Primary Sources
Table 176. Authors List of This Report
List of Figures
Figure 1. Endpoint Adjudication Service Picture
Figure 2. Global Endpoint Adjudication Service Market Size Comparison by Type (2020-2031) & (US$ Million)
Figure 3. Global Endpoint Adjudication Service Market Share by Type: 2024 VS 2031
Figure 4. Layered Architecture Decision Making Features
Figure 5. Client-Server Decision Making Features
Figure 6. Master-Slave Negotiation Decision Making Features
Figure 7. Microservice Mesh Decision Making Features
Figure 8. Global Endpoint Adjudication Service Market Size Comparison by Decision-making mechanisms (2020-2031) & (US$ Million)
Figure 9. Autocratic Decision-Making Features
Figure 10. Consultative Decision-Making Features
Figure 11. Rules-Driven Decision-Making Features
Figure 12. Machine Learning-Driven Decision-Making Features
Figure 13. Global Endpoint Adjudication Service Market Size Comparison by Deployment Perspective (2020-2031) & (US$ Million)
Figure 14. On-premises Deployment Features
Figure 15. Public Cloud Deployment Features
Figure 16. Hybrid Cloud Deployment Features
Figure 17. Edge Deployment Features
Figure 18. Global Endpoint Adjudication Service Market Size by Application (2020-2031) & (US$ Million)
Figure 19. Global Endpoint Adjudication Service Market Share by Application: 2024 VS 2031
Figure 20. Financial Industry Case Studies
Figure 21. Biomedicine Case Studies
Figure 22. Smart Manufacturing Case Studies
Figure 23. Other Case Studies
Figure 24. Endpoint Adjudication Service Report Years Considered
Figure 25. Global Endpoint Adjudication Service Market Size (US$ Million), Year-over-Year: 2020-2031
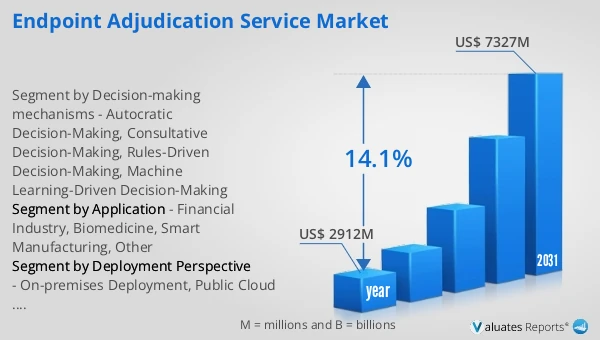
Figure 26. Global Endpoint Adjudication Service Market Size, (US$ Million), 2020 VS 2024 VS 2031
Figure 27. Global Endpoint Adjudication Service Market Share by Region: 2024 VS 2031
Figure 28. Global Endpoint Adjudication Service Market Share by Players in 2024
Figure 29. Global Endpoint Adjudication Service Market Share by Company Type (Tier 1, Tier 2, and Tier 3)
Figure 30. The Top 10 and 5 Players Market Share by Endpoint Adjudication Service Revenue in 2024
Figure 31. North America Endpoint Adjudication Service Market Size YoY Growth (2020-2031) & (US$ Million)
Figure 32. North America Endpoint Adjudication Service Market Share by Country (2020-2031)
Figure 33. United States Endpoint Adjudication Service Market Size YoY Growth (2020-2031) & (US$ Million)
Figure 34. Canada Endpoint Adjudication Service Market Size YoY Growth (2020-2031) & (US$ Million)
Figure 35. Europe Endpoint Adjudication Service Market Size YoY Growth (2020-2031) & (US$ Million)
Figure 36. Europe Endpoint Adjudication Service Market Share by Country (2020-2031)
Figure 37. Germany Endpoint Adjudication Service Market Size YoY Growth (2020-2031) & (US$ Million)
Figure 38. France Endpoint Adjudication Service Market Size YoY Growth (2020-2031) & (US$ Million)
Figure 39. U.K. Endpoint Adjudication Service Market Size YoY Growth (2020-2031) & (US$ Million)
Figure 40. Italy Endpoint Adjudication Service Market Size YoY Growth (2020-2031) & (US$ Million)
Figure 41. Russia Endpoint Adjudication Service Market Size YoY Growth (2020-2031) & (US$ Million)
Figure 42. Ireland Endpoint Adjudication Service Market Size YoY Growth (2020-2031) & (US$ Million)
Figure 43. Asia-Pacific Endpoint Adjudication Service Market Size YoY Growth (2020-2031) & (US$ Million)
Figure 44. Asia-Pacific Endpoint Adjudication Service Market Share by Region (2020-2031)
Figure 45. China Endpoint Adjudication Service Market Size YoY Growth (2020-2031) & (US$ Million)
Figure 46. Japan Endpoint Adjudication Service Market Size YoY Growth (2020-2031) & (US$ Million)
Figure 47. South Korea Endpoint Adjudication Service Market Size YoY Growth (2020-2031) & (US$ Million)
Figure 48. Southeast Asia Endpoint Adjudication Service Market Size YoY Growth (2020-2031) & (US$ Million)
Figure 49. India Endpoint Adjudication Service Market Size YoY Growth (2020-2031) & (US$ Million)
Figure 50. Australia & New Zealand Endpoint Adjudication Service Market Size YoY Growth (2020-2031) & (US$ Million)
Figure 51. Latin America Endpoint Adjudication Service Market Size YoY Growth (2020-2031) & (US$ Million)
Figure 52. Latin America Endpoint Adjudication Service Market Share by Country (2020-2031)
Figure 53. Mexico Endpoint Adjudication Service Market Size YoY Growth (2020-2031) & (US$ Million)
Figure 54. Brazil Endpoint Adjudication Service Market Size YoY Growth (2020-2031) & (US$ Million)
Figure 55. Middle East & Africa Endpoint Adjudication Service Market Size YoY Growth (2020-2031) & (US$ Million)
Figure 56. Middle East & Africa Endpoint Adjudication Service Market Share by Country (2020-2031)
Figure 57. Israel Endpoint Adjudication Service Market Size YoY Growth (2020-2031) & (US$ Million)
Figure 58. Saudi Arabia Endpoint Adjudication Service Market Size YoY Growth (2020-2031) & (US$ Million)
Figure 59. UAE Endpoint Adjudication Service Market Size YoY Growth (2020-2031) & (US$ Million)
Figure 60. Microsoft Revenue Growth Rate in Endpoint Adjudication Service Business (2020-2025)
Figure 61. Cisco Secure Revenue Growth Rate in Endpoint Adjudication Service Business (2020-2025)
Figure 62. Carbon Black Revenue Growth Rate in Endpoint Adjudication Service Business (2020-2025)
Figure 63. Sophos Revenue Growth Rate in Endpoint Adjudication Service Business (2020-2025)
Figure 64. Tata Consultancy Services Revenue Growth Rate in Endpoint Adjudication Service Business (2020-2025)
Figure 65. Infosys Revenue Growth Rate in Endpoint Adjudication Service Business (2020-2025)
Figure 66. Hangzhou Endpoint Network Technology Revenue Growth Rate in Endpoint Adjudication Service Business (2020-2025)
Figure 67. BANOOK GROUP Revenue Growth Rate in Endpoint Adjudication Service Business (2020-2025)
Figure 68. ICON plc Revenue Growth Rate in Endpoint Adjudication Service Business (2020-2025)
Figure 69. Ethical GmbH Revenue Growth Rate in Endpoint Adjudication Service Business (2020-2025)
Figure 70. Advarra Revenue Growth Rate in Endpoint Adjudication Service Business (2020-2025)
Figure 71. Sitero Revenue Growth Rate in Endpoint Adjudication Service Business (2020-2025)
Figure 72. George Clinical Revenue Growth Rate in Endpoint Adjudication Service Business (2020-2025)
Figure 73. Medidata Solutions Revenue Growth Rate in Endpoint Adjudication Service Business (2020-2025)
Figure 74. WCG Revenue Growth Rate in Endpoint Adjudication Service Business (2020-2025)
Figure 75. Judi for Adjumination Revenue Growth Rate in Endpoint Adjudication Service Business (2020-2025)
Figure 76. Clario Revenue Growth Rate in Endpoint Adjudication Service Business (2020-2025)
Figure 77. ITREAS Revenue Growth Rate in Endpoint Adjudication Service Business (2020-2025)
Figure 78. CISYS LifeSciences Revenue Growth Rate in Endpoint Adjudication Service Business (2020-2025)
Figure 79. Crucial Data Solutions Revenue Growth Rate in Endpoint Adjudication Service Business (2020-2025)
Figure 80. Voiant Revenue Growth Rate in Endpoint Adjudication Service Business (2020-2025)
Figure 81. Exom Revenue Growth Rate in Endpoint Adjudication Service Business (2020-2025)
Figure 82. TCell Clinical Services Revenue Growth Rate in Endpoint Adjudication Service Business (2020-2025)
Figure 83. Bottom-up and Top-down Approaches for This Report
Figure 84. Data Triangulation
Figure 85. Key Executives Interviewed