List of Tables
Table 1. N-Methylmorpholine N-Oxide (NMMO) CAGR in Value, India VS Global, 2018 VS 2022 VS 2029
Table 2. N-Methylmorpholine N-Oxide (NMMO) Market Trends
Table 3. N-Methylmorpholine N-Oxide (NMMO) Market Drivers
Table 4. N-Methylmorpholine N-Oxide (NMMO) Market Challenges
Table 5. N-Methylmorpholine N-Oxide (NMMO) Market Restraints
Table 6. Global N-Methylmorpholine N-Oxide (NMMO) Sales Growth Rate (CAGR) by Type: 2018 VS 2022 VS 2029 (US$ Million)
Table 7. India N-Methylmorpholine N-Oxide (NMMO) Sales Growth Rate (CAGR) by Type: 2018 VS 2022 VS 2029 (US$ Million)
Table 8. Global N-Methylmorpholine N-Oxide (NMMO) Sales Growth Rate (CAGR) by Application: 2018 VS 2022 VS 2029 (US$ Million)
Table 9. India N-Methylmorpholine N-Oxide (NMMO) Sales Growth Rate (CAGR) by Application: 2018 VS 2022 VS 2029 (US$ Million)
Table 10. Global Key Manufacturers of N-Methylmorpholine N-Oxide (NMMO), Ranked by Revenue (2022) & (US$ Million)
Table 11. Global N-Methylmorpholine N-Oxide (NMMO) Revenue by Manufacturer, (US$ Million), 2018-2023
Table 12. Global N-Methylmorpholine N-Oxide (NMMO) Revenue Share by Manufacturer, 2018-2023
Table 13. Global N-Methylmorpholine N-Oxide (NMMO) Sales by Manufacturer, (MT), 2018-2023
Table 14. Global N-Methylmorpholine N-Oxide (NMMO) Sales Share by Manufacturer, 2018-2023
Table 15. Global N-Methylmorpholine N-Oxide (NMMO) Price by Manufacturer (2018-2023) & (USD/MT)
Table 16. Global N-Methylmorpholine N-Oxide (NMMO) Manufacturers Market Concentration Ratio (CR5 and HHI)
Table 17. Global N-Methylmorpholine N-Oxide (NMMO) by Company Type (Tier 1, Tier 2, and Tier 3) & (based on the Revenue in N-Methylmorpholine N-Oxide (NMMO) as of 2022)
Table 18. Global Key Manufacturers of N-Methylmorpholine N-Oxide (NMMO), Manufacturing Base Distribution and Headquarters
Table 19. Global Key Manufacturers of N-Methylmorpholine N-Oxide (NMMO), Product Offered and Application
Table 20. Global Key Manufacturers of N-Methylmorpholine N-Oxide (NMMO), Date of Enter into This Industry
Table 21. Manufacturers Mergers & Acquisitions, Expansion Plans
Table 22. Key Players of N-Methylmorpholine N-Oxide (NMMO) in India, Ranked by Revenue (2022) & (US$ million)
Table 23. India N-Methylmorpholine N-Oxide (NMMO) Revenue by Players, (US$ Million), (2018-2023)
Table 24. India N-Methylmorpholine N-Oxide (NMMO) Revenue Share by Players, (2018-2023)
Table 25. India N-Methylmorpholine N-Oxide (NMMO) Sales by Players, (MT), (2018-2023)
Table 26. India N-Methylmorpholine N-Oxide (NMMO) Sales Share by Players, (2018-2023)
Table 27. Global N-Methylmorpholine N-Oxide (NMMO) Market Size Growth Rate (CAGR) by Region (US$ Million): 2018 VS 2022 VS 2029
Table 28. Global N-Methylmorpholine N-Oxide (NMMO) Sales in Volume by Region (2018-2023) & (MT)
Table 29. Global N-Methylmorpholine N-Oxide (NMMO) Sales in Volume Forecast by Region (2024-2029) & (MT)
Table 30. Global N-Methylmorpholine N-Oxide (NMMO) Sales in Value by Region (2018-2023) & (US$ Million)
Table 31. Global N-Methylmorpholine N-Oxide (NMMO) Sales in Value Forecast by Region (2024-2029) & (US$ Million)
Table 32. Americas N-Methylmorpholine N-Oxide (NMMO) Market Size Growth Rate (CAGR) by Country (US$ Million): 2018 VS 2022 VS 2029
Table 33. Americas N-Methylmorpholine N-Oxide (NMMO) Sales in Value by Country (2018-2023) & (US$ Million)
Table 34. Americas N-Methylmorpholine N-Oxide (NMMO) Sales in Value by Country (2024-2029) & (US$ Million)
Table 35. Americas N-Methylmorpholine N-Oxide (NMMO) Sales in Volume by Country (2018-2023) & (MT)
Table 36. Americas N-Methylmorpholine N-Oxide (NMMO) Sales in Volume by Country (2024-2029) & (MT)
Table 37. EMEA N-Methylmorpholine N-Oxide (NMMO) Market Size Growth Rate (CAGR) by Country (US$ Million): 2018 VS 2022 VS 2029
Table 38. EMEA N-Methylmorpholine N-Oxide (NMMO) Sales in Value by Country (2018-2023) & (US$ Million)
Table 39. EMEA N-Methylmorpholine N-Oxide (NMMO) Sales in Value by Country (2024-2029) & (US$ Million)
Table 40. EMEA N-Methylmorpholine N-Oxide (NMMO) Sales in Volume by Country (2018-2023) & (MT)
Table 41. EMEA N-Methylmorpholine N-Oxide (NMMO) Sales in Volume by Country (2024-2029) & (MT)
Table 42. APAC N-Methylmorpholine N-Oxide (NMMO) Market Size Growth Rate (CAGR) by Country (US$ Million): 2018 VS 2022 VS 2029
Table 43. APAC N-Methylmorpholine N-Oxide (NMMO) Sales in Value by Country (2018-2023) & (US$ Million)
Table 44. APAC N-Methylmorpholine N-Oxide (NMMO) Sales in Value by Country (2024-2029) & (US$ Million)
Table 45. APAC N-Methylmorpholine N-Oxide (NMMO) Sales in Volume by Country (2018-2023) & (MT)
Table 46. APAC N-Methylmorpholine N-Oxide (NMMO) Sales in Volume by Country (2024-2029) & (MT)
Table 47. BASF Company Information
Table 48. BASF Description and Business Overview
Table 49. BASF N-Methylmorpholine N-Oxide (NMMO) Sales (MT), Revenue (US$ Million), Price (USD/MT) and Gross Margin (2018-2023)
Table 50. BASF N-Methylmorpholine N-Oxide (NMMO) Product
Table 51. BASF Recent Development
Table 52. Huntsman Company Information
Table 53. Huntsman Description and Business Overview
Table 54. Huntsman N-Methylmorpholine N-Oxide (NMMO) Sales (MT), Revenue (US$ Million), Price (USD/MT) and Gross Margin (2018-2023)
Table 55. Huntsman N-Methylmorpholine N-Oxide (NMMO) Product
Table 56. Huntsman Recent Development
Table 57. Amines & Plasticizers Limited Company Information
Table 58. Amines & Plasticizers Limited Description and Business Overview
Table 59. Amines & Plasticizers Limited N-Methylmorpholine N-Oxide (NMMO) Sales (MT), Revenue (US$ Million), Price (USD/MT) and Gross Margin (2018-2023)
Table 60. Amines & Plasticizers Limited N-Methylmorpholine N-Oxide (NMMO) Product
Table 61. Amines & Plasticizers Limited Recent Development
Table 62. Sterling Auxiliaries Company Information
Table 63. Sterling Auxiliaries Description and Business Overview
Table 64. Sterling Auxiliaries N-Methylmorpholine N-Oxide (NMMO) Sales (MT), Revenue (US$ Million), Price (USD/MT) and Gross Margin (2018-2023)
Table 65. Sterling Auxiliaries N-Methylmorpholine N-Oxide (NMMO) Product
Table 66. Sterling Auxiliaries Recent Development
Table 67. Lianrun Chemical Company Information
Table 68. Lianrun Chemical Description and Business Overview
Table 69. Lianrun Chemical N-Methylmorpholine N-Oxide (NMMO) Sales (MT), Revenue (US$ Million), Price (USD/MT) and Gross Margin (2018-2023)
Table 70. Lianrun Chemical N-Methylmorpholine N-Oxide (NMMO) Product
Table 71. Lianrun Chemical Recent Development
Table 72. Anhui Wotu Chemical Company Information
Table 73. Anhui Wotu Chemical Description and Business Overview
Table 74. Anhui Wotu Chemical N-Methylmorpholine N-Oxide (NMMO) Sales (MT), Revenue (US$ Million), Price (USD/MT) and Gross Margin (2018-2023)
Table 75. Anhui Wotu Chemical N-Methylmorpholine N-Oxide (NMMO) Product
Table 76. Anhui Wotu Chemical Recent Development
Table 77. SINCERE CHEMICALS Company Information
Table 78. SINCERE CHEMICALS Description and Business Overview
Table 79. SINCERE CHEMICALS N-Methylmorpholine N-Oxide (NMMO) Sales (MT), Revenue (US$ Million), Price (USD/MT) and Gross Margin (2018-2023)
Table 80. SINCERE CHEMICALS N-Methylmorpholine N-Oxide (NMMO) Product
Table 81. SINCERE CHEMICALS Recent Development
Table 82. Key Raw Materials Lists
Table 83. Raw Materials Key Suppliers Lists
Table 84. N-Methylmorpholine N-Oxide (NMMO) Customers List
Table 85. N-Methylmorpholine N-Oxide (NMMO) Distributors List
Table 86. Research Programs/Design for This Report
Table 87. Key Data Information from Secondary Sources
Table 88. Key Data Information from Primary Sources
List of Figures
Figure 1. N-Methylmorpholine N-Oxide (NMMO) Product Picture
Figure 2. Global N-Methylmorpholine N-Oxide (NMMO) Revenue, (US$ Million), 2018 VS 2022 VS 2029
Figure 3. Global N-Methylmorpholine N-Oxide (NMMO) Market Size 2018-2029 (US$ Million)
Figure 4. Global N-Methylmorpholine N-Oxide (NMMO) Sales 2018-2029 (MT)
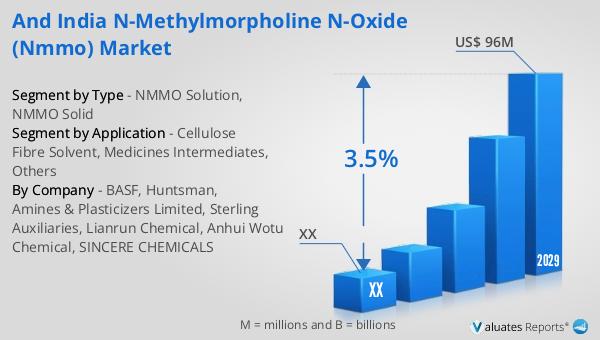
Figure 5. India N-Methylmorpholine N-Oxide (NMMO) Revenue, (US$ Million), 2018 VS 2022 VS 2029
Figure 6. India N-Methylmorpholine N-Oxide (NMMO) Market Size 2018-2029 (US$ Million)
Figure 7. India N-Methylmorpholine N-Oxide (NMMO) Sales 2018-2029 (MT)
Figure 8. India N-Methylmorpholine N-Oxide (NMMO) Market Share in Global, in Value (US$ Million) 2018-2029
Figure 9. India N-Methylmorpholine N-Oxide (NMMO) Market Share in Global, in Volume (MT) 2018-2029
Figure 10. N-Methylmorpholine N-Oxide (NMMO) Report Years Considered
Figure 11. Product Picture of NMMO Solution
Figure 12. Product Picture of NMMO Solid
Figure 13. Global N-Methylmorpholine N-Oxide (NMMO) Market Share by Type in 2022 & 2029
Figure 14. Global N-Methylmorpholine N-Oxide (NMMO) Sales in Value by Type (2018-2029) & (US$ Million)
Figure 15. Global N-Methylmorpholine N-Oxide (NMMO) Sales Market Share in Value by Type (2018-2029)
Figure 16. Global N-Methylmorpholine N-Oxide (NMMO) Sales by Type (2018-2029) & (MT)
Figure 17. Global N-Methylmorpholine N-Oxide (NMMO) Sales Market Share in Volume by Type (2018-2029)
Figure 18. Global N-Methylmorpholine N-Oxide (NMMO) Price by Type (2018-2029) & (USD/MT)
Figure 19. India N-Methylmorpholine N-Oxide (NMMO) Market Share by Type in 2022 & 2029
Figure 20. India N-Methylmorpholine N-Oxide (NMMO) Sales in Value by Type (2018-2029) & (US$ Million)
Figure 21. India N-Methylmorpholine N-Oxide (NMMO) Sales Market Share in Value by Type (2018-2029)
Figure 22. India N-Methylmorpholine N-Oxide (NMMO) Sales by Type (2018-2029) & (MT)
Figure 23. India N-Methylmorpholine N-Oxide (NMMO) Sales Market Share in Volume by Type (2018-2029)
Figure 24. India N-Methylmorpholine N-Oxide (NMMO) Price by Type (2018-2029) & (USD/MT)
Figure 25. Product Picture of Cellulose Fibre Solvent
Figure 26. Product Picture of Medicines Intermediates
Figure 27. Product Picture of Others
Figure 28. Global N-Methylmorpholine N-Oxide (NMMO) Market Share by Application in 2022 & 2029
Figure 29. Global N-Methylmorpholine N-Oxide (NMMO) Sales in Value by Application (2018-2029) & (US$ Million)
Figure 30. Global N-Methylmorpholine N-Oxide (NMMO) Sales Market Share in Value by Application (2018-2029)
Figure 31. Global N-Methylmorpholine N-Oxide (NMMO) Sales by Application (2018-2029) & (MT)
Figure 32. Global N-Methylmorpholine N-Oxide (NMMO) Sales Market Share in Volume by Application (2018-2029)
Figure 33. Global N-Methylmorpholine N-Oxide (NMMO) Price by Application (2018-2029) & (USD/MT)
Figure 34. India N-Methylmorpholine N-Oxide (NMMO) Market Share by Application in 2022 & 2029
Figure 35. India N-Methylmorpholine N-Oxide (NMMO) Sales in Value by Application (2018-2029) & (US$ Million)
Figure 36. India N-Methylmorpholine N-Oxide (NMMO) Sales Market Share in Value by Application (2018-2029)
Figure 37. India N-Methylmorpholine N-Oxide (NMMO) Sales by Application (2018-2029) & (MT)
Figure 38. India N-Methylmorpholine N-Oxide (NMMO) Sales Market Share in Volume by Application (2018-2029)
Figure 39. India N-Methylmorpholine N-Oxide (NMMO) Price by Application (2018-2029) & (USD/MT)
Figure 40. Americas N-Methylmorpholine N-Oxide (NMMO) Sales in Volume Growth Rate 2018-2029 (MT)
Figure 41. Americas N-Methylmorpholine N-Oxide (NMMO) Sales in Value Growth Rate 2018-2029 (US$ Million)
Figure 42. Americas N-Methylmorpholine N-Oxide (NMMO) Sales by Type (2018-2029) & (MT)
Figure 43. Americas N-Methylmorpholine N-Oxide (NMMO) Sales Market Share in Volume by Type (2018-2029)
Figure 44. Americas N-Methylmorpholine N-Oxide (NMMO) Sales by Application (2018-2029) & (MT)
Figure 45. Americas N-Methylmorpholine N-Oxide (NMMO) Sales Market Share in Volume by Application (2018-2029)
Figure 46. United States N-Methylmorpholine N-Oxide (NMMO) Sales in Value Growth Rate (2018-2029) & (US$ Million)
Figure 47. Canada N-Methylmorpholine N-Oxide (NMMO) Sales in Value Growth Rate (2018-2029) & (US$ Million)
Figure 48. Mexico N-Methylmorpholine N-Oxide (NMMO) Sales in Value Growth Rate (2018-2029) & (US$ Million)
Figure 49. Brazil N-Methylmorpholine N-Oxide (NMMO) Sales in Value Growth Rate (2018-2029) & (US$ Million)
Figure 50. EMEA N-Methylmorpholine N-Oxide (NMMO) Sales in Volume Growth Rate 2018-2029 (MT)
Figure 51. EMEA N-Methylmorpholine N-Oxide (NMMO) Sales in Value Growth Rate 2018-2029 (US$ Million)
Figure 52. EMEA N-Methylmorpholine N-Oxide (NMMO) Sales by Type (2018-2029) & (MT)
Figure 53. EMEA N-Methylmorpholine N-Oxide (NMMO) Sales Market Share in Volume by Type (2018-2029)
Figure 54. EMEA N-Methylmorpholine N-Oxide (NMMO) Sales by Application (2018-2029) & (MT)
Figure 55. EMEA N-Methylmorpholine N-Oxide (NMMO) Sales Market Share in Volume by Application (2018-2029)
Figure 56. Europe N-Methylmorpholine N-Oxide (NMMO) Sales in Value Growth Rate (2018-2029) & (US$ Million)
Figure 57. Middle East N-Methylmorpholine N-Oxide (NMMO) Sales in Value Growth Rate (2018-2029) & (US$ Million)
Figure 58. Africa N-Methylmorpholine N-Oxide (NMMO) Sales in Value Growth Rate (2018-2029) & (US$ Million)
Figure 59. China N-Methylmorpholine N-Oxide (NMMO) Sales in Volume Growth Rate 2018-2029 (MT)
Figure 60. China N-Methylmorpholine N-Oxide (NMMO) Sales in Value Growth Rate 2018-2029 (US$ Million)
Figure 61. China N-Methylmorpholine N-Oxide (NMMO) Sales by Type (2018-2029) & (MT)
Figure 62. China N-Methylmorpholine N-Oxide (NMMO) Sales Market Share in Volume by Type (2018-2029)
Figure 63. China N-Methylmorpholine N-Oxide (NMMO) Sales by Application (2018-2029) & (MT)
Figure 64. China N-Methylmorpholine N-Oxide (NMMO) Sales Market Share in Volume by Application (2018-2029)
Figure 65. APAC N-Methylmorpholine N-Oxide (NMMO) Sales in Volume Growth Rate 2018-2029 (MT)
Figure 66. APAC N-Methylmorpholine N-Oxide (NMMO) Sales in Value Growth Rate 2018-2029 (US$ Million)
Figure 67. APAC N-Methylmorpholine N-Oxide (NMMO) Sales by Type (2018-2029) & (MT)
Figure 68. APAC N-Methylmorpholine N-Oxide (NMMO) Sales Market Share in Volume by Type (2018-2029)
Figure 69. APAC N-Methylmorpholine N-Oxide (NMMO) Sales by Application (2018-2029) & (MT)
Figure 70. APAC N-Methylmorpholine N-Oxide (NMMO) Sales Market Share in Volume by Application (2018-2029)
Figure 71. Japan N-Methylmorpholine N-Oxide (NMMO) Sales in Value Growth Rate (2018-2029) & (US$ Million)
Figure 72. South Korea N-Methylmorpholine N-Oxide (NMMO) Sales in Value Growth Rate (2018-2029) & (US$ Million)
Figure 73. China Taiwan N-Methylmorpholine N-Oxide (NMMO) Sales in Value Growth Rate (2018-2029) & (US$ Million)
Figure 74. Southeast Asia N-Methylmorpholine N-Oxide (NMMO) Sales in Value Growth Rate (2018-2029) & (US$ Million)
Figure 75. India N-Methylmorpholine N-Oxide (NMMO) Sales in Value Growth Rate (2018-2029) & (US$ Million)
Figure 76. N-Methylmorpholine N-Oxide (NMMO) Value Chain
Figure 77. N-Methylmorpholine N-Oxide (NMMO) Production Process
Figure 78. Channels of Distribution
Figure 79. Distributors Profiles
Figure 80. Bottom-up and Top-down Approaches for This Report
Figure 81. Data Triangulation
Figure 82. Key Executives Interviewed