List of Tables
Table 1. IoT Connected Rail Market Trends
Table 2. IoT Connected Rail Market Drivers & Opportunity
Table 3. IoT Connected Rail Market Challenges
Table 4. IoT Connected Rail Market Restraints
Table 5. Global IoT Connected Rail Revenue by Company (2019-2024) & (US$ Million)
Table 6. Global IoT Connected Rail Revenue Market Share by Company (2019-2024)
Table 7. Key Companies IoT Connected Rail Manufacturing Base Distribution and Headquarters
Table 8. Key Companies IoT Connected Rail Product Type
Table 9. Key Companies Time to Begin Mass Production of IoT Connected Rail
Table 10. Global IoT Connected Rail Companies Market Concentration Ratio (CR5 and HHI)
Table 11. Global Top Companies Market Share by Company Type (Tier 1, Tier 2, and Tier 3) & (based on the Revenue in IoT Connected Rail as of 2023)
Table 12. Mergers & Acquisitions, Expansion Plans
Table 13. Global IoT Connected Rail Sales Value by Type: 2019 VS 2023 VS 2030 (US$ Million)
Table 14. Global IoT Connected Rail Sales Value by Type (2019-2024) & (US$ Million)
Table 15. Global IoT Connected Rail Sales Value by Type (2025-2030) & (US$ Million)
Table 16. Global IoT Connected Rail Sales Market Share in Value by Type (2019-2024) & (%)
Table 17. Global IoT Connected Rail Sales Market Share in Value by Type (2025-2030) & (%)
Table 18. Global IoT Connected Rail Sales Value by Application: 2019 VS 2023 VS 2030 (US$ Million)
Table 19. Global IoT Connected Rail Sales Value by Application (2019-2024) & (US$ Million)
Table 20. Global IoT Connected Rail Sales Value by Application (2025-2030) & (US$ Million)
Table 21. Global IoT Connected Rail Sales Market Share in Value by Application (2019-2024) & (%)
Table 22. Global IoT Connected Rail Sales Market Share in Value by Application (2025-2030) & (%)
Table 23. Global IoT Connected Rail Sales Value by Region: 2019 VS 2023 VS 2030 (US$ Million)
Table 24. Global IoT Connected Rail Sales Value by Region (2019-2024) & (US$ Million)
Table 25. Global IoT Connected Rail Sales Value by Region (2025-2030) & (US$ Million)
Table 26. Global IoT Connected Rail Sales Value by Region (2019-2024) & (%)
Table 27. Global IoT Connected Rail Sales Value by Region (2025-2030) & (%)
Table 28. Key Countries/Regions IoT Connected Rail Sales Value Growth Trends, (US$ Million): 2019 VS 2023 VS 2030
Table 29. Key Countries/Regions IoT Connected Rail Sales Value, (2019-2024) & (US$ Million)
Table 30. Key Countries/Regions IoT Connected Rail Sales Value, (2025-2030) & (US$ Million)
Table 31. Siemens Basic Information List
Table 32. Siemens Description and Business Overview
Table 33. Siemens IoT Connected Rail Products, Services and Solutions
Table 34. Revenue (US$ Million) in IoT Connected Rail Business of Siemens (2019-2024)
Table 35. Siemens Recent Developments
Table 36. Hitachi Rail Basic Information List
Table 37. Hitachi Rail Description and Business Overview
Table 38. Hitachi Rail IoT Connected Rail Products, Services and Solutions
Table 39. Revenue (US$ Million) in IoT Connected Rail Business of Hitachi Rail (2019-2024)
Table 40. Hitachi Rail Recent Developments
Table 41. Wabtec Corporation Basic Information List
Table 42. Wabtec Corporation Description and Business Overview
Table 43. Wabtec Corporation IoT Connected Rail Products, Services and Solutions
Table 44. Revenue (US$ Million) in IoT Connected Rail Business of Wabtec Corporation (2019-2024)
Table 45. Wabtec Corporation Recent Developments
Table 46. Trimble Basic Information List
Table 47. Trimble Description and Business Overview
Table 48. Trimble IoT Connected Rail Products, Services and Solutions
Table 49. Revenue (US$ Million) in IoT Connected Rail Business of Trimble (2019-2024)
Table 50. Trimble Recent Developments
Table 51. Bosch Basic Information List
Table 52. Bosch Description and Business Overview
Table 53. Bosch IoT Connected Rail Products, Services and Solutions
Table 54. Revenue (US$ Million) in IoT Connected Rail Business of Bosch (2019-2024)
Table 55. Bosch Recent Developments
Table 56. HUAWEI Basic Information List
Table 57. HUAWEI Description and Business Overview
Table 58. HUAWEI IoT Connected Rail Products, Services and Solutions
Table 59. Revenue (US$ Million) in IoT Connected Rail Business of HUAWEI (2019-2024)
Table 60. HUAWEI Recent Developments
Table 61. Cisco Basic Information List
Table 62. Cisco Description and Business Overview
Table 63. Cisco IoT Connected Rail Products, Services and Solutions
Table 64. Revenue (US$ Million) in IoT Connected Rail Business of Cisco (2019-2024)
Table 65. Cisco Recent Developments
Table 66. Nokia Basic Information List
Table 67. Nokia Description and Business Overview
Table 68. Nokia IoT Connected Rail Products, Services and Solutions
Table 69. Revenue (US$ Million) in IoT Connected Rail Business of Nokia (2019-2024)
Table 70. Nokia Recent Developments
Table 71. Atos Basic Information List
Table 72. Atos Description and Business Overview
Table 73. Atos IoT Connected Rail Products, Services and Solutions
Table 74. Revenue (US$ Million) in IoT Connected Rail Business of Atos (2019-2024)
Table 75. Atos Recent Developments
Table 76. IBM Basic Information List
Table 77. IBM Description and Business Overview
Table 78. IBM IoT Connected Rail Products, Services and Solutions
Table 79. Revenue (US$ Million) in IoT Connected Rail Business of IBM (2019-2024)
Table 80. IBM Recent Developments
Table 81. Tech Mahindra Basic Information List
Table 82. Tech Mahindra Description and Business Overview
Table 83. Tech Mahindra IoT Connected Rail Products, Services and Solutions
Table 84. Revenue (US$ Million) in IoT Connected Rail Business of Tech Mahindra (2019-2024)
Table 85. Tech Mahindra Recent Developments
Table 86. SIERRA WIRELESS Basic Information List
Table 87. SIERRA WIRELESS Description and Business Overview
Table 88. SIERRA WIRELESS IoT Connected Rail Products, Services and Solutions
Table 89. Revenue (US$ Million) in IoT Connected Rail Business of SIERRA WIRELESS (2019-2024)
Table 90. SIERRA WIRELESS Recent Developments
Table 91. Toshiba Basic Information List
Table 92. Toshiba Description and Business Overview
Table 93. Toshiba IoT Connected Rail Products, Services and Solutions
Table 94. Revenue (US$ Million) in IoT Connected Rail Business of Toshiba (2019-2024)
Table 95. Toshiba Recent Developments
Table 96. Scomi Group Basic Information List
Table 97. Scomi Group Description and Business Overview
Table 98. Scomi Group IoT Connected Rail Products, Services and Solutions
Table 99. Revenue (US$ Million) in IoT Connected Rail Business of Scomi Group (2019-2024)
Table 100. Scomi Group Recent Developments
Table 101. ABB Basic Information List
Table 102. ABB Description and Business Overview
Table 103. ABB IoT Connected Rail Products, Services and Solutions
Table 104. Revenue (US$ Million) in IoT Connected Rail Business of ABB (2019-2024)
Table 105. ABB Recent Developments
Table 106. Strukton Rail Basic Information List
Table 107. Strukton Rail Description and Business Overview
Table 108. Strukton Rail IoT Connected Rail Products, Services and Solutions
Table 109. Revenue (US$ Million) in IoT Connected Rail Business of Strukton Rail (2019-2024)
Table 110. Strukton Rail Recent Developments
Table 111. Legios Basic Information List
Table 112. Legios Description and Business Overview
Table 113. Legios IoT Connected Rail Products, Services and Solutions
Table 114. Revenue (US$ Million) in IoT Connected Rail Business of Legios (2019-2024)
Table 115. Legios Recent Developments
Table 116. Thales Group Basic Information List
Table 117. Thales Group Description and Business Overview
Table 118. Thales Group IoT Connected Rail Products, Services and Solutions
Table 119. Revenue (US$ Million) in IoT Connected Rail Business of Thales Group (2019-2024)
Table 120. Thales Group Recent Developments
Table 121. Deutsche Bahn Basic Information List
Table 122. Deutsche Bahn Description and Business Overview
Table 123. Deutsche Bahn IoT Connected Rail Products, Services and Solutions
Table 124. Revenue (US$ Million) in IoT Connected Rail Business of Deutsche Bahn (2019-2024)
Table 125. Deutsche Bahn Recent Developments
Table 126. Calamp Corp Basic Information List
Table 127. Calamp Corp Description and Business Overview
Table 128. Calamp Corp IoT Connected Rail Products, Services and Solutions
Table 129. Revenue (US$ Million) in IoT Connected Rail Business of Calamp Corp (2019-2024)
Table 130. Calamp Corp Recent Developments
Table 131. Woojin Industrial Systems Basic Information List
Table 132. Woojin Industrial Systems Description and Business Overview
Table 133. Woojin Industrial Systems IoT Connected Rail Products, Services and Solutions
Table 134. Revenue (US$ Million) in IoT Connected Rail Business of Woojin Industrial Systems (2019-2024)
Table 135. Woojin Industrial Systems Recent Developments
Table 136. DEUTA-WERKE Basic Information List
Table 137. DEUTA-WERKE Description and Business Overview
Table 138. DEUTA-WERKE IoT Connected Rail Products, Services and Solutions
Table 139. Revenue (US$ Million) in IoT Connected Rail Business of DEUTA-WERKE (2019-2024)
Table 140. DEUTA-WERKE Recent Developments
Table 141. UGL Limited Basic Information List
Table 142. UGL Limited Description and Business Overview
Table 143. UGL Limited IoT Connected Rail Products, Services and Solutions
Table 144. Revenue (US$ Million) in IoT Connected Rail Business of UGL Limited (2019-2024)
Table 145. UGL Limited Recent Developments
Table 146. TÜV Rheinland Basic Information List
Table 147. TÜV Rheinland Description and Business Overview
Table 148. TÜV Rheinland IoT Connected Rail Products, Services and Solutions
Table 149. Revenue (US$ Million) in IoT Connected Rail Business of TÜV Rheinland (2019-2024)
Table 150. TÜV Rheinland Recent Developments
Table 151. Key Raw Materials Lists
Table 152. Raw Materials Key Suppliers Lists
Table 153. IoT Connected Rail Downstream Customers
Table 154. IoT Connected Rail Distributors List
Table 155. Research Programs/Design for This Report
Table 156. Key Data Information from Secondary Sources
Table 157. Key Data Information from Primary Sources
Table 158. Business Unit and Senior & Team Lead Analysts
List of Figures
Figure 1. IoT Connected Rail Product Picture
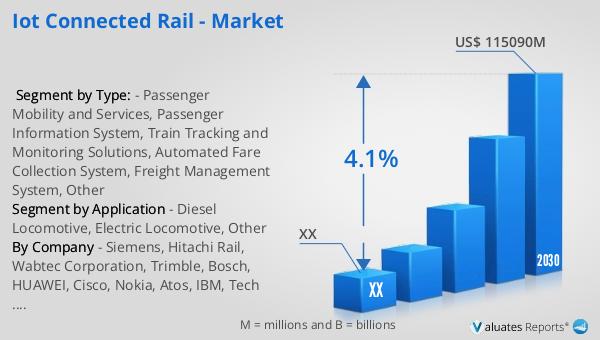
Figure 2. Global IoT Connected Rail Sales Value, 2019 VS 2023 VS 2030 (US$ Million)
Figure 3. Global IoT Connected Rail Sales Value (2019-2030) & (US$ Million)
Figure 4. IoT Connected Rail Report Years Considered
Figure 5. Global IoT Connected Rail Players Revenue Ranking (2023) & (US$ Million)
Figure 6. The 5 and 10 Largest Manufacturers in the World: Market Share by IoT Connected Rail Revenue in 2023
Figure 7. IoT Connected Rail Market Share by Company Type (Tier 1, Tier 2, and Tier 3): 2019 VS 2023
Figure 8. Passenger Mobility and Services Picture
Figure 9. Passenger Information System Picture
Figure 10. Train Tracking and Monitoring Solutions Picture
Figure 11. Automated Fare Collection System Picture
Figure 12. Freight Management System Picture
Figure 13. Other Picture
Figure 14. Global IoT Connected Rail Sales Value by Type (2019 VS 2023 VS 2030) & (US$ Million)
Figure 15. Global IoT Connected Rail Sales Value Market Share by Type, 2023 & 2030
Figure 16. Product Picture of Diesel Locomotive
Figure 17. Product Picture of Electric Locomotive
Figure 18. Product Picture of Other
Figure 19. Global IoT Connected Rail Sales Value by Application (2019 VS 2023 VS 2030) & (US$ Million)
Figure 20. Global IoT Connected Rail Sales Value Market Share by Application, 2023 & 2030
Figure 21. North America IoT Connected Rail Sales Value (2019-2030) & (US$ Million)
Figure 22. North America IoT Connected Rail Sales Value by Country (%), 2023 VS 2030
Figure 23. Europe IoT Connected Rail Sales Value (2019-2030) & (US$ Million)
Figure 24. Europe IoT Connected Rail Sales Value by Country (%), 2023 VS 2030
Figure 25. Asia Pacific IoT Connected Rail Sales Value (2019-2030) & (US$ Million)
Figure 26. Asia Pacific IoT Connected Rail Sales Value by Country (%), 2023 VS 2030
Figure 27. South America IoT Connected Rail Sales Value (2019-2030) & (US$ Million)
Figure 28. South America IoT Connected Rail Sales Value by Country (%), 2023 VS 2030
Figure 29. Middle East & Africa IoT Connected Rail Sales Value (2019-2030) & (US$ Million)
Figure 30. Middle East & Africa IoT Connected Rail Sales Value by Country (%), 2023 VS 2030
Figure 31. Key Countries/Regions IoT Connected Rail Sales Value (%), (2019-2030)
Figure 32. United States IoT Connected Rail Sales Value, (2019-2030) & (US$ Million)
Figure 33. United States IoT Connected Rail Sales Value by Type (%), 2023 VS 2030
Figure 34. United States IoT Connected Rail Sales Value by Application (%), 2023 VS 2030
Figure 35. Europe IoT Connected Rail Sales Value, (2019-2030) & (US$ Million)
Figure 36. Europe IoT Connected Rail Sales Value by Type (%), 2023 VS 2030
Figure 37. Europe IoT Connected Rail Sales Value by Application (%), 2023 VS 2030
Figure 38. China IoT Connected Rail Sales Value, (2019-2030) & (US$ Million)
Figure 39. China IoT Connected Rail Sales Value by Type (%), 2023 VS 2030
Figure 40. China IoT Connected Rail Sales Value by Application (%), 2023 VS 2030
Figure 41. Japan IoT Connected Rail Sales Value, (2019-2030) & (US$ Million)
Figure 42. Japan IoT Connected Rail Sales Value by Type (%), 2023 VS 2030
Figure 43. Japan IoT Connected Rail Sales Value by Application (%), 2023 VS 2030
Figure 44. South Korea IoT Connected Rail Sales Value, (2019-2030) & (US$ Million)
Figure 45. South Korea IoT Connected Rail Sales Value by Type (%), 2023 VS 2030
Figure 46. South Korea IoT Connected Rail Sales Value by Application (%), 2023 VS 2030
Figure 47. Southeast Asia IoT Connected Rail Sales Value, (2019-2030) & (US$ Million)
Figure 48. Southeast Asia IoT Connected Rail Sales Value by Type (%), 2023 VS 2030
Figure 49. Southeast Asia IoT Connected Rail Sales Value by Application (%), 2023 VS 2030
Figure 50. India IoT Connected Rail Sales Value, (2019-2030) & (US$ Million)
Figure 51. India IoT Connected Rail Sales Value by Type (%), 2023 VS 2030
Figure 52. India IoT Connected Rail Sales Value by Application (%), 2023 VS 2030
Figure 53. IoT Connected Rail Industrial Chain
Figure 54. IoT Connected Rail Manufacturing Cost Structure
Figure 55. Channels of Distribution (Direct Sales, and Distribution)
Figure 56. Bottom-up and Top-down Approaches for This Report
Figure 57. Data Triangulation