0
U.S. (TOLL FREE)
+1 (315) 215-3225
Automative

0
U.S. (TOLL FREE)
+1 (315) 215-3225
Global and India Linseed Oil Market Report & Forecast 2023-2029
Published Date: November 2023
|
Report Code: QYRE-Auto-18G15741
Home | Market Reports | Business & Industrial| Chemicals Industry
Global and India Linseed Oil Market Report Forecast 2023 2029
BUY CHAPTERS

Global and India Linseed Oil Market Report & Forecast 2023-2029

Code: QYRE-Auto-18G15741
Report
November 2023
Pages:125
QYResearch
Buy Now with 15% Discount
DESCRIPTION
TABLE OF CONTENT
TABLES & FIGURES

and India Linseed Oil Market Size

The global Linseed Oil revenue was US$ 2040 million in 2022 and is forecast to a readjusted size of US$ 2446.8 million by 2029 with a CAGR of 2.6% during the forecast period (2023-2029).

and India Linseed Oil Market

and India Linseed Oil Market

Flaxseed oil, also known as linseed oil or flax oil, is a colourless to yellowish oil obtained from the dried, ripened seeds of the flax plant (Linum usitatissimum). The oil is obtained by pressing, sometimes followed by solvent extraction. Linseed oil is a drying oil, meaning it can polymerize into a solid form.
In India, the Linseed Oil revenue is expected to grow from US$ million in 2022 to US$ million by 2029, at a CAGR of % during the forecast period (2023-2029).
Global Linseed Oil main players are Hongjingyuan, Shape Foods, Fueder, ADM, Blackmores, etc. Global top four manufacturers hold a share over 25%. North America is the largest market, with a share nearly 35%.
This report focuses on global and India Linseed Oil market, also covers the segmentation data of other regions in regional level and county level.
India is now the world’s most populous country. According to IMF (its July update to its World Economic Outlook), India’s GDP growth is projected at 6.1% in 2023, powered by domestic investment. First and foremost, the key factor in India's rapid economic growth is the huge supply and demand from a large population base. Demand and supply sides working in both directions to support India's economic stability.
India is a market full of opportunities, and the demand for Linseed Oil will continue to grow rapidly in the future.
Global Linseed Oil Scope and Market Size
Linseed Oil market is segmented in regional and country, by players, by type and by application. Companies, stakeholders, and other participants in the global Linseed Oil market will be able to gain the upper hand as they use the report as a powerful resource. The segmental analysis focuses on revenue and forecast by type and by application for the period 2018-2029.
For India market, this report focuses on the Linseed Oil market size by players, by Type and by Application, for the period 2018-2029. The key players include the global and local players, which play important roles in India.

Scope of and India Linseed Oil Market Report

Report Metric Details
Report Name and India Linseed Oil Market
Forecasted market size in 2029 US$ 2446.8 million
CAGR 2.6%
Forecasted years 2023 - 2029
Segment by Type
  • Organic Flaxseed Oil
  • Inorganic Flaxseed Oil
Segment by Application
  • Foods
  • Cosmetics
  • Pharmaceuticals
  • Others
By Region
  • North America (United States, Canada)
  • Europe (Germany, France, UK, Italy, Russia) Rest of Europe
  • Nordic Countries
  • Asia-Pacific (China, Japan, South Korea)
  • Southeast Asia (India, Australia)
  • Rest of Asia
  • Latin America (Mexico, Brazil)
  • Rest of Latin America
  • Middle East & Africa (Turkey, Saudi Arabia, UAE, Rest of MEA)
By Company Hongjingyuan, Shape Foods, Fueder, ADM, Blackmores, GNC, Meng Gu Xiang, Nature’s Bounty, Henry Lamotte Oils, Wonderful, Luyuan, Nature’s Way Products, Spectrum, Krishi Oils, Gustav Heess, Pharmavite, Jamieson, Sundown Naturals, Ningxia Yousufu Qingzhen Food Co.,Ltd, Zonghoo
Forecast units USD million in value
Report coverage Revenue and volume forecast, company share, competitive landscape, growth factors and trends

FAQ for this report

What is the and India Linseed Oil Market size in 2029?

Ans: The and India Linseed Oil Market size in 2029 will be US$ 2446.8 million.

What is the market share of major companies in and India Linseed Oil Market?

Ans: Global top four manufacturers hold a share over 25%.

What is the and India Linseed Oil Market share by region?

Ans: According to IMF (its July update to its World Economic Outlook), India’s GDP growth is projected at 6.1% in 2023, powered by domestic investment.

Who are the main players in the and India Linseed Oil Market report?

Ans: The main players in the and India Linseed Oil Market are Hongjingyuan, Shape Foods, Fueder, ADM, Blackmores, GNC, Meng Gu Xiang, Nature’s Bounty, Henry Lamotte Oils, Wonderful, Luyuan, Nature’s Way Products, Spectrum, Krishi Oils, Gustav Heess, Pharmavite, Jamieson, Sundown Naturals, Ningxia Yousufu Qingzhen Food Co.,Ltd, Zonghoo

What are the Application segmentation covered in the and India Linseed Oil Market report?

Ans: The Applications covered in the and India Linseed Oil Market report are Foods, Cosmetics, Pharmaceuticals, Others

What are the Type segmentation covered in the and India Linseed Oil Market report?

Ans: The Types covered in the and India Linseed Oil Market report are Organic Flaxseed Oil, Inorganic Flaxseed Oil

1 Study Coverage
1.1 Linseed Oil Product Introduction
1.2 Global Linseed Oil Outlook 2018 VS 2022 VS 2029
1.2.1 Global Linseed Oil Sales in US$ Million for the Year 2018-2029
1.2.2 Global Linseed Oil Sales in Volume for the Year 2018-2029
1.3 India Linseed Oil Outlook 2018 VS 2022 VS 2029
1.3.1 India Linseed Oil Sales in US$ Million for the Year 2018-2029
1.3.2 India Linseed Oil Sales in Volume for the Year 2018-2029
1.4 Linseed Oil Market Size, India VS Global, 2018 VS 2022 VS 2029
1.4.1 The Market Share of India Linseed Oil in Global, 2018 VS 2022 VS 2029
1.4.2 The Growth Rate of Linseed Oil Market Size, India VS Global, 2018 VS 2022 VS 2029
1.5 Linseed Oil Market Dynamics
1.5.1 Linseed Oil Industry Trends
1.5.2 Linseed Oil Market Drivers
1.5.3 Linseed Oil Market Challenges
1.5.4 Linseed Oil Market Restraints
1.6 Study Objectives
1.7 Years Considered
1.8 Years Considered
2 Linseed Oil by Type
2.1 Linseed Oil Market Segment by Type
2.1.1 Organic Flaxseed Oil
2.1.2 Inorganic Flaxseed Oil
2.2 Global Linseed Oil Market Size by Type
2.2.1 Global Linseed Oil Sales in Value, by Type (2018, 2022 & 2029)
2.2.2 Global Linseed Oil Sales in Volume, by Type (2018, 2022 & 2029)
2.2.3 Global Linseed Oil Average Selling Price (ASP) by Type (2018, 2022 & 2029)
2.3 India Linseed Oil Market Size by Type
2.3.1 India Linseed Oil Sales in Value, by Type (2018, 2022 & 2029)
2.3.2 India Linseed Oil Sales in Volume, by Type (2018, 2022 & 2029)
2.3.3 India Linseed Oil Average Selling Price (ASP) by Type (2018, 2022 & 2029)
3 Linseed Oil by Application
3.1 Linseed Oil Market Segment by Application
3.1.1 Foods
3.1.2 Cosmetics
3.1.3 Pharmaceuticals
3.1.4 Others
3.2 Global Linseed Oil Market Size by Application
3.2.1 Global Linseed Oil Sales in Value, by Application (2018, 2022 & 2029)
3.2.2 Global Linseed Oil Sales in Volume, by Application (2018, 2022 & 2029)
3.3.3 Global Linseed Oil Average Selling Price (ASP) by Application (2018, 2022 & 2029)
3.3 India Linseed Oil Market Size by Application
3.3.1 India Linseed Oil Sales in Value, by Application (2018, 2022 & 2029)
3.3.2 India Linseed Oil Sales in Volume, by Application (2018, 2022 & 2029)
3.3.3 India Linseed Oil Average Selling Price (ASP) by Application (2018, 2022 & 2029)
4 Global Linseed Oil Competitor Landscape by Company
4.1 Global Linseed Oil Market Size by Company
4.1.1 Global Key Manufacturers of Linseed Oil, Ranked by Revenue (2022)
4.1.2 Global Linseed Oil Revenue by Manufacturer (2018-2023)
4.1.3 Global Linseed Oil Sales by Manufacturer (2018-2023)
4.1.4 Global Linseed Oil Price by Manufacturer (2018-2023)
4.2 Global Linseed Oil Concentration Ratio (CR)
4.2.1 Linseed Oil Market Concentration Ratio (CR)
4.2.2 Global Top 5 and Top 10 Largest Manufacturers of Linseed Oil in 2022
4.2.3 Global Linseed Oil Market Share by Company Type (Tier 1, Tier 2, and Tier 3)
4.3 Global Key Manufacturers of Linseed Oil, Manufacturing Base Distribution and Headquarters
4.4 Global Key Manufacturers of Linseed Oil, Product Offered and Application
4.5 Global Key Manufacturers of Linseed Oil, Date of Enter into This Industry
4.6 Manufacturers Mergers & Acquisitions, Expansion Plans
4.7 India Linseed Oil Market Size by Company
4.7.1 Key Players of Linseed Oil in India, Ranked by Revenue (2022)
4.7.2 India Linseed Oil Revenue by Players (2018-2023)
4.7.3 India Linseed Oil Sales by Players (2018-2023)
5 Global Linseed Oil Market Size by Region
5.1 Global Linseed Oil Market Size by Region: 2018 VS 2022 VS 2029
5.2 Global Linseed Oil Market Size in Volume by Region (2018-2029)
5.2.1 Global Linseed Oil Sales in Volume by Region: 2018-2023
5.2.2 Global Linseed Oil Sales in Volume Forecast by Region (2024-2029)
5.3 Global Linseed Oil Market Size in Value by Region (2018-2029)
5.3.1 Global Linseed Oil Sales in Value by Region: 2018-2023
5.3.2 Global Linseed Oil Sales in Value by Region: 2024-2029
6 Americas
6.1 Americas Linseed Oil Market Size YoY Growth 2018-2029
6.2 Americas Linseed Oil Sales in Volume, by Type (2018, 2022 & 2029)
6.3 Americas Linseed Oil Sales in Volume, by Application (2018, 2022 & 2029)
6.4 Americas Linseed Oil Market Facts & Figures by Country (2018, 2022 & 2029)
6.4.1 Americas Linseed Oil Sales in Value by Country (2018, 2022 & 2029)
6.4.2 Americas Linseed Oil Sales in Volume by Country (2018, 2022 & 2029)
6.4.3 United States
6.4.4 Canada
6.4.5 Mexico
6.4.6 Brazil
7 EMEA
7.1 EMEA Linseed Oil Market Size YoY Growth 2018-2029
7.2 EMEA Linseed Oil Sales in Volume, by Type (2018, 2022 & 2029)
7.3 EMEA Linseed Oil Sales in Volume, by Application (2018, 2022 & 2029)
7.4 EMEA Linseed Oil Market Facts & Figures by Country (2018, 2022 & 2029)
7.4.1 EMEA Linseed Oil Sales in Value by Country (2018, 2022 & 2029)
7.4.2 EMEA Linseed Oil Sales in Volume by Country (2018, 2022 & 2029)
7.4.3 Europe
7.4.4 Middle East
7.4.5 Africa
8 China
8.1 China Linseed Oil Market Size YoY Growth 2018-2029
8.2 China Linseed Oil Sales in Volume, by Type (2018, 2022 & 2029)
8.3 China Linseed Oil Sales in Volume, by Application (2018, 2022 & 2029)
9 APAC
9.1 APAC Linseed Oil Market Size YoY Growth 2018-2029
9.2 APAC Linseed Oil Sales in Volume, by Type (2018, 2022 & 2029)
9.3 APAC Linseed Oil Sales in Volume, by Application (2018, 2022 & 2029)
9.4 APAC Linseed Oil Market Facts & Figures by Region (2018, 2022 & 2029)
9.4.1 APAC Linseed Oil Sales in Value by Region (2018, 2022 & 2029)
9.4.2 APAC Linseed Oil Sales in Volume by Region (2018, 2022 & 2029)
9.4.3 Japan
9.4.4 South Korea
9.4.5 China Taiwan
9.4.6 Southeast Asia
9.4.7 India
10 Company Profiles
10.1 Hongjingyuan
10.1.1 Hongjingyuan Company Information
10.1.2 Hongjingyuan Description and Business Overview
10.1.3 Hongjingyuan Linseed Oil Sales, Revenue and Gross Margin (2018-2023)
10.1.4 Hongjingyuan Linseed Oil Products Offered
10.1.5 Hongjingyuan Recent Development
10.2 Shape Foods
10.2.1 Shape Foods Company Information
10.2.2 Shape Foods Description and Business Overview
10.2.3 Shape Foods Linseed Oil Sales, Revenue and Gross Margin (2018-2023)
10.2.4 Shape Foods Linseed Oil Products Offered
10.2.5 Shape Foods Recent Development
10.3 Fueder
10.3.1 Fueder Company Information
10.3.2 Fueder Description and Business Overview
10.3.3 Fueder Linseed Oil Sales, Revenue and Gross Margin (2018-2023)
10.3.4 Fueder Linseed Oil Products Offered
10.3.5 Fueder Recent Development
10.4 ADM
10.4.1 ADM Company Information
10.4.2 ADM Description and Business Overview
10.4.3 ADM Linseed Oil Sales, Revenue and Gross Margin (2018-2023)
10.4.4 ADM Linseed Oil Products Offered
10.4.5 ADM Recent Development
10.5 Blackmores
10.5.1 Blackmores Company Information
10.5.2 Blackmores Description and Business Overview
10.5.3 Blackmores Linseed Oil Sales, Revenue and Gross Margin (2018-2023)
10.5.4 Blackmores Linseed Oil Products Offered
10.5.5 Blackmores Recent Development
10.6 GNC
10.6.1 GNC Company Information
10.6.2 GNC Description and Business Overview
10.6.3 GNC Linseed Oil Sales, Revenue and Gross Margin (2018-2023)
10.6.4 GNC Linseed Oil Products Offered
10.6.5 GNC Recent Development
10.7 Meng Gu Xiang
10.7.1 Meng Gu Xiang Company Information
10.7.2 Meng Gu Xiang Description and Business Overview
10.7.3 Meng Gu Xiang Linseed Oil Sales, Revenue and Gross Margin (2018-2023)
10.7.4 Meng Gu Xiang Linseed Oil Products Offered
10.7.5 Meng Gu Xiang Recent Development
10.8 Nature’s Bounty
10.8.1 Nature’s Bounty Company Information
10.8.2 Nature’s Bounty Description and Business Overview
10.8.3 Nature’s Bounty Linseed Oil Sales, Revenue and Gross Margin (2018-2023)
10.8.4 Nature’s Bounty Linseed Oil Products Offered
10.8.5 Nature’s Bounty Recent Development
10.9 Henry Lamotte Oils
10.9.1 Henry Lamotte Oils Company Information
10.9.2 Henry Lamotte Oils Description and Business Overview
10.9.3 Henry Lamotte Oils Linseed Oil Sales, Revenue and Gross Margin (2018-2023)
10.9.4 Henry Lamotte Oils Linseed Oil Products Offered
10.9.5 Henry Lamotte Oils Recent Development
10.10 Wonderful
10.10.1 Wonderful Company Information
10.10.2 Wonderful Description and Business Overview
10.10.3 Wonderful Linseed Oil Sales, Revenue and Gross Margin (2018-2023)
10.10.4 Wonderful Linseed Oil Products Offered
10.10.5 Wonderful Recent Development
10.11 Luyuan
10.11.1 Luyuan Company Information
10.11.2 Luyuan Description and Business Overview
10.11.3 Luyuan Linseed Oil Sales, Revenue and Gross Margin (2018-2023)
10.11.4 Luyuan Linseed Oil Products Offered
10.11.5 Luyuan Recent Development
10.12 Nature’s Way Products
10.12.1 Nature’s Way Products Company Information
10.12.2 Nature’s Way Products Description and Business Overview
10.12.3 Nature’s Way Products Linseed Oil Sales, Revenue and Gross Margin (2018-2023)
10.12.4 Nature’s Way Products Linseed Oil Products Offered
10.12.5 Nature’s Way Products Recent Development
10.13 Spectrum
10.13.1 Spectrum Company Information
10.13.2 Spectrum Description and Business Overview
10.13.3 Spectrum Linseed Oil Sales, Revenue and Gross Margin (2018-2023)
10.13.4 Spectrum Linseed Oil Products Offered
10.13.5 Spectrum Recent Development
10.14 Krishi Oils
10.14.1 Krishi Oils Company Information
10.14.2 Krishi Oils Description and Business Overview
10.14.3 Krishi Oils Linseed Oil Sales, Revenue and Gross Margin (2018-2023)
10.14.4 Krishi Oils Linseed Oil Products Offered
10.14.5 Krishi Oils Recent Development
10.15 Gustav Heess
10.15.1 Gustav Heess Company Information
10.15.2 Gustav Heess Description and Business Overview
10.15.3 Gustav Heess Linseed Oil Sales, Revenue and Gross Margin (2018-2023)
10.15.4 Gustav Heess Linseed Oil Products Offered
10.15.5 Gustav Heess Recent Development
10.16 Pharmavite
10.16.1 Pharmavite Company Information
10.16.2 Pharmavite Description and Business Overview
10.16.3 Pharmavite Linseed Oil Sales, Revenue and Gross Margin (2018-2023)
10.16.4 Pharmavite Linseed Oil Products Offered
10.16.5 Pharmavite Recent Development
10.17 Jamieson
10.17.1 Jamieson Company Information
10.17.2 Jamieson Description and Business Overview
10.17.3 Jamieson Linseed Oil Sales, Revenue and Gross Margin (2018-2023)
10.17.4 Jamieson Linseed Oil Products Offered
10.17.5 Jamieson Recent Development
10.18 Sundown Naturals
10.18.1 Sundown Naturals Company Information
10.18.2 Sundown Naturals Description and Business Overview
10.18.3 Sundown Naturals Linseed Oil Sales, Revenue and Gross Margin (2018-2023)
10.18.4 Sundown Naturals Linseed Oil Products Offered
10.18.5 Sundown Naturals Recent Development
10.19 Ningxia Yousufu Qingzhen Food Co.,Ltd
10.19.1 Ningxia Yousufu Qingzhen Food Co.,Ltd Company Information
10.19.2 Ningxia Yousufu Qingzhen Food Co.,Ltd Description and Business Overview
10.19.3 Ningxia Yousufu Qingzhen Food Co.,Ltd Linseed Oil Sales, Revenue and Gross Margin (2018-2023)
10.19.4 Ningxia Yousufu Qingzhen Food Co.,Ltd Linseed Oil Products Offered
10.19.5 Ningxia Yousufu Qingzhen Food Co.,Ltd Recent Development
10.20 Zonghoo
10.20.1 Zonghoo Company Information
10.20.2 Zonghoo Description and Business Overview
10.20.3 Zonghoo Linseed Oil Sales, Revenue and Gross Margin (2018-2023)
10.20.4 Zonghoo Linseed Oil Products Offered
10.20.5 Zonghoo Recent Development
11 Industry Chain and Sales Channels Analysis
11.1 Linseed Oil Industry Chain Analysis
11.2 Linseed Oil Key Raw Materials
11.2.1 Key Raw Materials
11.2.2 Raw Materials Key Suppliers
11.3 Linseed Oil Production Mode & Process
11.4 Linseed Oil Sales and Marketing
11.4.1 Linseed Oil Sales Channels
11.4.2 Linseed Oil Distributors
11.5 Linseed Oil Customers
12 Research Findings and Conclusion
13 Appendix
13.1 Research Methodology
13.1.1 Methodology/Research Approach
13.1.2 Data Source
13.2 Author Details
13.3 Disclaimer
List of Tables
    Table 1. Linseed Oil CAGR in Value, India VS Global, 2018 VS 2022 VS 2029
    Table 2. Linseed Oil Market Trends
    Table 3. Linseed Oil Market Drivers
    Table 4. Linseed Oil Market Challenges
    Table 5. Linseed Oil Market Restraints
    Table 6. Global Linseed Oil Sales Growth Rate (CAGR) by Type: 2018 VS 2022 VS 2029 (US$ Million)
    Table 7. India Linseed Oil Sales Growth Rate (CAGR) by Type: 2018 VS 2022 VS 2029 (US$ Million)
    Table 8. Global Linseed Oil Sales Growth Rate (CAGR) by Application: 2018 VS 2022 VS 2029 (US$ Million)
    Table 9. India Linseed Oil Sales Growth Rate (CAGR) by Application: 2018 VS 2022 VS 2029 (US$ Million)
    Table 10. Global Key Manufacturers of Linseed Oil, Ranked by Revenue (2022) & (US$ Million)
    Table 11. Global Linseed Oil Revenue by Manufacturer, (US$ Million), 2018-2023
    Table 12. Global Linseed Oil Revenue Share by Manufacturer, 2018-2023
    Table 13. Global Linseed Oil Sales by Manufacturer, (K MT), 2018-2023
    Table 14. Global Linseed Oil Sales Share by Manufacturer, 2018-2023
    Table 15. Global Linseed Oil Price by Manufacturer (2018-2023) & (USD/MT)
    Table 16. Global Linseed Oil Manufacturers Market Concentration Ratio (CR5 and HHI)
    Table 17. Global Linseed Oil by Company Type (Tier 1, Tier 2, and Tier 3) & (based on the Revenue in Linseed Oil as of 2022)
    Table 18. Global Key Manufacturers of Linseed Oil, Manufacturing Base Distribution and Headquarters
    Table 19. Global Key Manufacturers of Linseed Oil, Product Offered and Application
    Table 20. Global Key Manufacturers of Linseed Oil, Date of Enter into This Industry
    Table 21. Manufacturers Mergers & Acquisitions, Expansion Plans
    Table 22. Key Players of Linseed Oil in India, Ranked by Revenue (2022) & (US$ million)
    Table 23. India Linseed Oil Revenue by Players, (US$ Million), (2018-2023)
    Table 24. India Linseed Oil Revenue Share by Players, (2018-2023)
    Table 25. India Linseed Oil Sales by Players, (K MT), (2018-2023)
    Table 26. India Linseed Oil Sales Share by Players, (2018-2023)
    Table 27. Global Linseed Oil Market Size Growth Rate (CAGR) by Region (US$ Million): 2018 VS 2022 VS 2029
    Table 28. Global Linseed Oil Sales in Volume by Region (2018-2023) & (K MT)
    Table 29. Global Linseed Oil Sales in Volume Forecast by Region (2024-2029) & (K MT)
    Table 30. Global Linseed Oil Sales in Value by Region (2018-2023) & (US$ Million)
    Table 31. Global Linseed Oil Sales in Value Forecast by Region (2024-2029) & (US$ Million)
    Table 32. Americas Linseed Oil Market Size Growth Rate (CAGR) by Country (US$ Million): 2018 VS 2022 VS 2029
    Table 33. Americas Linseed Oil Sales in Value by Country (2018-2023) & (US$ Million)
    Table 34. Americas Linseed Oil Sales in Value by Country (2024-2029) & (US$ Million)
    Table 35. Americas Linseed Oil Sales in Volume by Country (2018-2023) & (K MT)
    Table 36. Americas Linseed Oil Sales in Volume by Country (2024-2029) & (K MT)
    Table 37. EMEA Linseed Oil Market Size Growth Rate (CAGR) by Country (US$ Million): 2018 VS 2022 VS 2029
    Table 38. EMEA Linseed Oil Sales in Value by Country (2018-2023) & (US$ Million)
    Table 39. EMEA Linseed Oil Sales in Value by Country (2024-2029) & (US$ Million)
    Table 40. EMEA Linseed Oil Sales in Volume by Country (2018-2023) & (K MT)
    Table 41. EMEA Linseed Oil Sales in Volume by Country (2024-2029) & (K MT)
    Table 42. APAC Linseed Oil Market Size Growth Rate (CAGR) by Country (US$ Million): 2018 VS 2022 VS 2029
    Table 43. APAC Linseed Oil Sales in Value by Country (2018-2023) & (US$ Million)
    Table 44. APAC Linseed Oil Sales in Value by Country (2024-2029) & (US$ Million)
    Table 45. APAC Linseed Oil Sales in Volume by Country (2018-2023) & (K MT)
    Table 46. APAC Linseed Oil Sales in Volume by Country (2024-2029) & (K MT)
    Table 47. Hongjingyuan Company Information
    Table 48. Hongjingyuan Description and Business Overview
    Table 49. Hongjingyuan Linseed Oil Sales (K MT), Revenue (US$ Million), Price (USD/MT) and Gross Margin (2018-2023)
    Table 50. Hongjingyuan Linseed Oil Product
    Table 51. Hongjingyuan Recent Development
    Table 52. Shape Foods Company Information
    Table 53. Shape Foods Description and Business Overview
    Table 54. Shape Foods Linseed Oil Sales (K MT), Revenue (US$ Million), Price (USD/MT) and Gross Margin (2018-2023)
    Table 55. Shape Foods Linseed Oil Product
    Table 56. Shape Foods Recent Development
    Table 57. Fueder Company Information
    Table 58. Fueder Description and Business Overview
    Table 59. Fueder Linseed Oil Sales (K MT), Revenue (US$ Million), Price (USD/MT) and Gross Margin (2018-2023)
    Table 60. Fueder Linseed Oil Product
    Table 61. Fueder Recent Development
    Table 62. ADM Company Information
    Table 63. ADM Description and Business Overview
    Table 64. ADM Linseed Oil Sales (K MT), Revenue (US$ Million), Price (USD/MT) and Gross Margin (2018-2023)
    Table 65. ADM Linseed Oil Product
    Table 66. ADM Recent Development
    Table 67. Blackmores Company Information
    Table 68. Blackmores Description and Business Overview
    Table 69. Blackmores Linseed Oil Sales (K MT), Revenue (US$ Million), Price (USD/MT) and Gross Margin (2018-2023)
    Table 70. Blackmores Linseed Oil Product
    Table 71. Blackmores Recent Development
    Table 72. GNC Company Information
    Table 73. GNC Description and Business Overview
    Table 74. GNC Linseed Oil Sales (K MT), Revenue (US$ Million), Price (USD/MT) and Gross Margin (2018-2023)
    Table 75. GNC Linseed Oil Product
    Table 76. GNC Recent Development
    Table 77. Meng Gu Xiang Company Information
    Table 78. Meng Gu Xiang Description and Business Overview
    Table 79. Meng Gu Xiang Linseed Oil Sales (K MT), Revenue (US$ Million), Price (USD/MT) and Gross Margin (2018-2023)
    Table 80. Meng Gu Xiang Linseed Oil Product
    Table 81. Meng Gu Xiang Recent Development
    Table 82. Nature’s Bounty Company Information
    Table 83. Nature’s Bounty Description and Business Overview
    Table 84. Nature’s Bounty Linseed Oil Sales (K MT), Revenue (US$ Million), Price (USD/MT) and Gross Margin (2018-2023)
    Table 85. Nature’s Bounty Linseed Oil Product
    Table 86. Nature’s Bounty Recent Development
    Table 87. Henry Lamotte Oils Company Information
    Table 88. Henry Lamotte Oils Description and Business Overview
    Table 89. Henry Lamotte Oils Linseed Oil Sales (K MT), Revenue (US$ Million), Price (USD/MT) and Gross Margin (2018-2023)
    Table 90. Henry Lamotte Oils Linseed Oil Product
    Table 91. Henry Lamotte Oils Recent Development
    Table 92. Wonderful Company Information
    Table 93. Wonderful Description and Business Overview
    Table 94. Wonderful Linseed Oil Sales (K MT), Revenue (US$ Million), Price (USD/MT) and Gross Margin (2018-2023)
    Table 95. Wonderful Linseed Oil Product
    Table 96. Wonderful Recent Development
    Table 97. Luyuan Company Information
    Table 98. Luyuan Description and Business Overview
    Table 99. Luyuan Linseed Oil Sales (K MT), Revenue (US$ Million), Price (USD/MT) and Gross Margin (2018-2023)
    Table 100. Luyuan Linseed Oil Product
    Table 101. Luyuan Recent Development
    Table 102. Nature’s Way Products Company Information
    Table 103. Nature’s Way Products Description and Business Overview
    Table 104. Nature’s Way Products Linseed Oil Sales (K MT), Revenue (US$ Million), Price (USD/MT) and Gross Margin (2018-2023)
    Table 105. Nature’s Way Products Linseed Oil Product
    Table 106. Nature’s Way Products Recent Development
    Table 107. Spectrum Company Information
    Table 108. Spectrum Description and Business Overview
    Table 109. Spectrum Linseed Oil Sales (K MT), Revenue (US$ Million), Price (USD/MT) and Gross Margin (2018-2023)
    Table 110. Spectrum Linseed Oil Product
    Table 111. Spectrum Recent Development
    Table 112. Krishi Oils Company Information
    Table 113. Krishi Oils Description and Business Overview
    Table 114. Krishi Oils Linseed Oil Sales (K MT), Revenue (US$ Million), Price (USD/MT) and Gross Margin (2018-2023)
    Table 115. Krishi Oils Linseed Oil Product
    Table 116. Krishi Oils Recent Development
    Table 117. Gustav Heess Company Information
    Table 118. Gustav Heess Description and Business Overview
    Table 119. Gustav Heess Linseed Oil Sales (K MT), Revenue (US$ Million), Price (USD/MT) and Gross Margin (2018-2023)
    Table 120. Gustav Heess Linseed Oil Product
    Table 121. Gustav Heess Recent Development
    Table 122. Pharmavite Company Information
    Table 123. Pharmavite Description and Business Overview
    Table 124. Pharmavite Linseed Oil Sales (K MT), Revenue (US$ Million), Price (USD/MT) and Gross Margin (2018-2023)
    Table 125. Pharmavite Linseed Oil Product
    Table 126. Pharmavite Recent Development
    Table 127. Jamieson Company Information
    Table 128. Jamieson Description and Business Overview
    Table 129. Jamieson Linseed Oil Sales (K MT), Revenue (US$ Million), Price (USD/MT) and Gross Margin (2018-2023)
    Table 130. Jamieson Linseed Oil Product
    Table 131. Jamieson Recent Development
    Table 132. Sundown Naturals Company Information
    Table 133. Sundown Naturals Description and Business Overview
    Table 134. Sundown Naturals Linseed Oil Sales (K MT), Revenue (US$ Million), Price (USD/MT) and Gross Margin (2018-2023)
    Table 135. Sundown Naturals Linseed Oil Product
    Table 136. Sundown Naturals Recent Development
    Table 137. Ningxia Yousufu Qingzhen Food Co.,Ltd Company Information
    Table 138. Ningxia Yousufu Qingzhen Food Co.,Ltd Description and Business Overview
    Table 139. Ningxia Yousufu Qingzhen Food Co.,Ltd Linseed Oil Sales (K MT), Revenue (US$ Million), Price (USD/MT) and Gross Margin (2018-2023)
    Table 140. Ningxia Yousufu Qingzhen Food Co.,Ltd Linseed Oil Product
    Table 141. Ningxia Yousufu Qingzhen Food Co.,Ltd Recent Development
    Table 142. Zonghoo Company Information
    Table 143. Zonghoo Description and Business Overview
    Table 144. Zonghoo Linseed Oil Sales (K MT), Revenue (US$ Million), Price (USD/MT) and Gross Margin (2018-2023)
    Table 145. Zonghoo Linseed Oil Product
    Table 146. Zonghoo Recent Development
    Table 147. Key Raw Materials Lists
    Table 148. Raw Materials Key Suppliers Lists
    Table 149. Linseed Oil Customers List
    Table 150. Linseed Oil Distributors List
    Table 151. Research Programs/Design for This Report
    Table 152. Key Data Information from Secondary Sources
    Table 153. Key Data Information from Primary Sources
List of Figures
    Figure 1. Linseed Oil Product Picture
    Figure 2. Global Linseed Oil Revenue, (US$ Million), 2018 VS 2022 VS 2029
    Figure 3. Global Linseed Oil Market Size 2018-2029 (US$ Million)
    Figure 4. Global Linseed Oil Sales 2018-2029 (K MT)
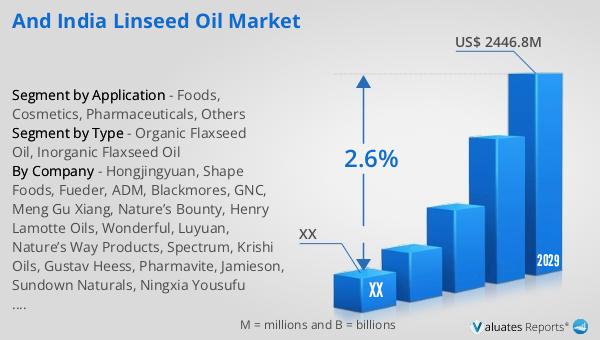
    Figure 5. India Linseed Oil Revenue, (US$ Million), 2018 VS 2022 VS 2029
    Figure 6. India Linseed Oil Market Size 2018-2029 (US$ Million)
    Figure 7. India Linseed Oil Sales 2018-2029 (K MT)
    Figure 8. India Linseed Oil Market Share in Global, in Value (US$ Million) 2018-2029
    Figure 9. India Linseed Oil Market Share in Global, in Volume (K MT) 2018-2029
    Figure 10. Linseed Oil Report Years Considered
    Figure 11. Product Picture of Organic Flaxseed Oil
    Figure 12. Product Picture of Inorganic Flaxseed Oil
    Figure 13. Global Linseed Oil Market Share by Type in 2022 & 2029
    Figure 14. Global Linseed Oil Sales in Value by Type (2018-2029) & (US$ Million)
    Figure 15. Global Linseed Oil Sales Market Share in Value by Type (2018-2029)
    Figure 16. Global Linseed Oil Sales by Type (2018-2029) & (K MT)
    Figure 17. Global Linseed Oil Sales Market Share in Volume by Type (2018-2029)
    Figure 18. Global Linseed Oil Price by Type (2018-2029) & (USD/MT)
    Figure 19. India Linseed Oil Market Share by Type in 2022 & 2029
    Figure 20. India Linseed Oil Sales in Value by Type (2018-2029) & (US$ Million)
    Figure 21. India Linseed Oil Sales Market Share in Value by Type (2018-2029)
    Figure 22. India Linseed Oil Sales by Type (2018-2029) & (K MT)
    Figure 23. India Linseed Oil Sales Market Share in Volume by Type (2018-2029)
    Figure 24. India Linseed Oil Price by Type (2018-2029) & (USD/MT)
    Figure 25. Product Picture of Foods
    Figure 26. Product Picture of Cosmetics
    Figure 27. Product Picture of Pharmaceuticals
    Figure 28. Product Picture of Others
    Figure 29. Global Linseed Oil Market Share by Application in 2022 & 2029
    Figure 30. Global Linseed Oil Sales in Value by Application (2018-2029) & (US$ Million)
    Figure 31. Global Linseed Oil Sales Market Share in Value by Application (2018-2029)
    Figure 32. Global Linseed Oil Sales by Application (2018-2029) & (K MT)
    Figure 33. Global Linseed Oil Sales Market Share in Volume by Application (2018-2029)
    Figure 34. Global Linseed Oil Price by Application (2018-2029) & (USD/MT)
    Figure 35. India Linseed Oil Market Share by Application in 2022 & 2029
    Figure 36. India Linseed Oil Sales in Value by Application (2018-2029) & (US$ Million)
    Figure 37. India Linseed Oil Sales Market Share in Value by Application (2018-2029)
    Figure 38. India Linseed Oil Sales by Application (2018-2029) & (K MT)
    Figure 39. India Linseed Oil Sales Market Share in Volume by Application (2018-2029)
    Figure 40. India Linseed Oil Price by Application (2018-2029) & (USD/MT)
    Figure 41. Americas Linseed Oil Sales in Volume Growth Rate 2018-2029 (K MT)
    Figure 42. Americas Linseed Oil Sales in Value Growth Rate 2018-2029 (US$ Million)
    Figure 43. Americas Linseed Oil Sales by Type (2018-2029) & (K MT)
    Figure 44. Americas Linseed Oil Sales Market Share in Volume by Type (2018-2029)
    Figure 45. Americas Linseed Oil Sales by Application (2018-2029) & (K MT)
    Figure 46. Americas Linseed Oil Sales Market Share in Volume by Application (2018-2029)
    Figure 47. United States Linseed Oil Sales in Value Growth Rate (2018-2029) & (US$ Million)
    Figure 48. Canada Linseed Oil Sales in Value Growth Rate (2018-2029) & (US$ Million)
    Figure 49. Mexico Linseed Oil Sales in Value Growth Rate (2018-2029) & (US$ Million)
    Figure 50. Brazil Linseed Oil Sales in Value Growth Rate (2018-2029) & (US$ Million)
    Figure 51. EMEA Linseed Oil Sales in Volume Growth Rate 2018-2029 (K MT)
    Figure 52. EMEA Linseed Oil Sales in Value Growth Rate 2018-2029 (US$ Million)
    Figure 53. EMEA Linseed Oil Sales by Type (2018-2029) & (K MT)
    Figure 54. EMEA Linseed Oil Sales Market Share in Volume by Type (2018-2029)
    Figure 55. EMEA Linseed Oil Sales by Application (2018-2029) & (K MT)
    Figure 56. EMEA Linseed Oil Sales Market Share in Volume by Application (2018-2029)
    Figure 57. Europe Linseed Oil Sales in Value Growth Rate (2018-2029) & (US$ Million)
    Figure 58. Middle East Linseed Oil Sales in Value Growth Rate (2018-2029) & (US$ Million)
    Figure 59. Africa Linseed Oil Sales in Value Growth Rate (2018-2029) & (US$ Million)
    Figure 60. China Linseed Oil Sales in Volume Growth Rate 2018-2029 (K MT)
    Figure 61. China Linseed Oil Sales in Value Growth Rate 2018-2029 (US$ Million)
    Figure 62. China Linseed Oil Sales by Type (2018-2029) & (K MT)
    Figure 63. China Linseed Oil Sales Market Share in Volume by Type (2018-2029)
    Figure 64. China Linseed Oil Sales by Application (2018-2029) & (K MT)
    Figure 65. China Linseed Oil Sales Market Share in Volume by Application (2018-2029)
    Figure 66. APAC Linseed Oil Sales in Volume Growth Rate 2018-2029 (K MT)
    Figure 67. APAC Linseed Oil Sales in Value Growth Rate 2018-2029 (US$ Million)
    Figure 68. APAC Linseed Oil Sales by Type (2018-2029) & (K MT)
    Figure 69. APAC Linseed Oil Sales Market Share in Volume by Type (2018-2029)
    Figure 70. APAC Linseed Oil Sales by Application (2018-2029) & (K MT)
    Figure 71. APAC Linseed Oil Sales Market Share in Volume by Application (2018-2029)
    Figure 72. Japan Linseed Oil Sales in Value Growth Rate (2018-2029) & (US$ Million)
    Figure 73. South Korea Linseed Oil Sales in Value Growth Rate (2018-2029) & (US$ Million)
    Figure 74. China Taiwan Linseed Oil Sales in Value Growth Rate (2018-2029) & (US$ Million)
    Figure 75. Southeast Asia Linseed Oil Sales in Value Growth Rate (2018-2029) & (US$ Million)
    Figure 76. India Linseed Oil Sales in Value Growth Rate (2018-2029) & (US$ Million)
    Figure 77. Linseed Oil Value Chain
    Figure 78. Linseed Oil Production Process
    Figure 79. Channels of Distribution
    Figure 80. Distributors Profiles
    Figure 81. Bottom-up and Top-down Approaches for This Report
    Figure 82. Data Triangulation
    Figure 83. Key Executives Interviewed
SELECT A FORMAT
Added to Cart
Electronic (PDF)

$4350

This license allows only one user to access the PDF.
Electronic (PDF)

$6525

This license allows 1 - 5 user to access the PDF, license is suitable for small groups of 5 users working together
Electronic (PDF)

$8700

This license allows users/teams in a same Enterprise to use this report, various departments within an enterpise can use this report
Add to Cart
Buy Now (15% Discount)

OUR CUSTOMER

Accenture

SIMILAR REPORTS


RELATED REPORTS

Global Resorcinol Formaldehyde Adhesive Resin Market Research Report 2025

120 Pages
Type: Report
Code: QYRE-Auto-19T20220
Wed Dec 03 00:00:00 UTC 2025

Add to Cart

Global Low-Sludge Phosphating Solution Market Research Report 2025

120 Pages
Type: Report
Code: QYRE-Auto-33H20007
Wed Dec 03 00:00:00 UTC 2025

Add to Cart

Global Linear Alpha-Olefin Market Research Report 2025

120 Pages
Type: Report
Code: QYRE-Auto-5Y6896
Wed Dec 03 00:00:00 UTC 2025

Add to Cart

Global Nodulizer Cored Wire Market Research Report 2025

120 Pages
Type: Report
Code: QYRE-Auto-10G20315
Wed Dec 03 00:00:00 UTC 2025

Add to Cart