0
U.S. (TOLL FREE)
+1 (315) 215-3225
Automative

0
U.S. (TOLL FREE)
+1 (315) 215-3225
Global Artificial Tears Market Research Report 2026
Published Date: 2026-01-23
|
Report Code: QYRE-Auto-18P9261
Home | Market Reports
Global Artificial Tears Market Insights and Forecast to 2028
BUY CHAPTERS

Global Artificial Tears Market Research Report 2026

Code: QYRE-Auto-18P9261
Report
2026-01-23
Pages:147
QYResearch
Buy Now with 15% Discount
DESCRIPTION
TABLE OF CONTENT
TABLES & FIGURES

Artificial Tears Market Size

The global Artificial Tears market was valued at US$ 3544 million in 2025 and is anticipated to reach US$ 5029 million by 2032, at a CAGR of 5.2% from 2026 to 2032.

Artificial Tears Market

Artificial Tears Market

The 2025 U.S. tariff policies introduce profound uncertainty into the global economic landscape. This report critically examines the implications of recent tariff adjustments and international strategic countermeasures on Artificial Tears competitive dynamics, regional economic interdependencies, and supply chain reconfigurations.
Artificial tears are standardized ocular lubricants that supplement the tear film, stabilize the interface between the cornea and eyelids, and relieve symptoms of dryness and irritation. Product forms include water based drops for routine use, oil in water emulsions that reinforce the lipid layer, higher viscosity gels designed to extend residence time, petrolatum based ointments suitable for overnight protection, and eyelid sprays focused on meibomian support. The importance rests on comfort and epithelial protection which in turn preserve consistent visual quality and sustain contact lens tolerance. Because these products sit between consumer health and clinical eye care, they must be biocompatible, shelf stable, and compliant with national labelling and preservative rules. Packaging formats such as unit dose preservative free vials and multi dose bottles with engineered valves have become major drivers of user preference and price ladders.
Upstream supply relies on pharmaceutical grade polymers and excipients including carboxymethylcellulose, hyaluronic acid, povidone, hydroxypropyl methylcellulose, polyethylene glycol, propylene glycol, glycerol, and phospholipids. Tight control of sterile filling capacity and preservative or preservative free system design are typical bottlenecks. Downstream demand concentrates in dry eye disease management, contact lens rewetting, post procedure clinic care, digital eye strain among office workers, and relief for environmental irritation. Procurement mixes retail pharmacy wholesalers, e commerce direct to consumer channels, and clinic linked recommendation. Pricing reflects formulation complexity and brand equity. Emulsions and gels command a premium to basic aqueous drops while unit dose preservative free lines trade higher packaging cost for perceived safety and comfort. Industry gross margins typically sit in the 70% to 85% as a result of regulatory and quality barriers, recurrent purchase behavior, and brand based differentiation.
In the current market global production is around nine hundred and five million Units with an average selling price near3.8 United States dollars per Unit. The top five suppliers control roughly two thirds of revenue, indicating a moderately concentrated structure anchored by a handful of global brands with scale in manufacturing, marketing, and distribution. Demand is strongest in North America and Europe while China and the wider Indo Pacific continue to gain share on rising diagnosis and screen time. Through twenty thirty one growth is supported by ageing populations, wider contact lens adoption in emerging markets, and a structural shift toward preservative free or low risk preserved delivery with improved bottle technology. Key constraints include sterile fill capacity, polymer price volatility, and the need to maintain a clear separation from prescription anti inflammatory therapies in positioning and compliance. Companies that combine robust upstream sourcing, flexible packaging platforms, and clinically credible branding are best placed to extend share across gels, emulsions, and adjunct eyelid care.
This report delivers a comprehensive overview of the global Artificial Tears market, with both quantitative and qualitative analyses, to help readers develop growth strategies, assess the competitive landscape, evaluate their position in the current market, and make informed business decisions regarding Artificial Tears. The Artificial Tears market size, estimates, and forecasts are provided in terms of sales volume (M Units) and revenue (US$ millions), with 2025 as the base year and historical and forecast data for 2021–2032.
The report segments the global Artificial Tears market comprehensively. Regional market sizes by Formulation Type, by Application, by Preservative Attribute, and by company are also provided. For deeper insight, the report profiles the competitive landscape, key competitors, and their respective market rankings, and discusses technological trends and new product developments.
This report will assist Artificial Tears manufacturers, new entrants, and companies across the industry value chain with information on revenues, sales volume, and average prices for the overall market and its sub-segments, by company, by Formulation Type, by Application, and by region.
Market Segmentation

Scope of Artificial Tears Market Report

Report Metric Details
Report Name Artificial Tears Market
Accounted market size in 2025 US$ 3544 million
Forecasted market size in 2032 US$ 5029 million
CAGR 5.2%
Base Year 2025
Forecasted years 2026 - 2032
Segment by Formulation Type
  • Aqueous Drops
  • Emulsion Drops
  • Gel Drops
  • Ointment
  • Eyelid Spray
Segment by Preservative Attribute
  • Preservative Free
  • Low Risk Preserved
  • Conventional Preserved
Segment by Polymer and Active Base
  • Carboxymethylcellulose
  • Hyaluronic Acid
  • PEG and Propylene Glycol
  • Povidone and HPMC
  • Others
by Application
  • Dry Eye Disease Management
  • Contact Lens Wear Support
  • Post operative and Clinical Care
  • Digital Eye Strain and Office Use
  • Environmental Irritation Relief
  • Others
Consumption by Region
  • North America (United States, Canada)
  • Europe (Germany, France, UK, Italy, Russia)
  • Asia-Pacific (China, Japan, South Korea, Taiwan)
  • Southeast Asia (India)
  • Latin America (Mexico, Brazil)
By Company Alcon, AbbVie (Allergan), Bausch + Lomb, Santen Pharmaceutical, Rohto Pharmaceutical, Laboratoires Théa, URSAPHARM Arzneimittel, Bayer Consumer Health, Prestige Consumer Healthcare, Similasan AG, Reckitt (Optrex), AFT Pharmaceuticals, VISUfarma, OCuSOFT, Fidia Farmaceutici, SIFI S.p.A., Avizor, OmniVision Pharma GmbH, Scope Eyecare, Zhenshiming (Jiangxi) Pharmaceutical, Yuanda Pharmaceutical, Qilu Pharmaceutical
Forecast units USD million in value
Report coverage Revenue and volume forecast, company share, competitive landscape, growth factors and trends

Chapter Outline

  • Chapter 1: Defines the scope of the report and presents an executive summary of market segments (by Formulation Type, by Application, by Preservative Attribute, etc.), including the size of each segment and its future growth potential. It offers a high-level view of the current market and its likely evolution in the short, medium, and long term.
  • Chapter 2: Provides a detailed analysis of the competitive landscape for Artificial Tears manufacturers, covering pricing, sales and revenue shares, latest development plans, and mergers and acquisitions.
  • Chapter 3: Examines Artificial Tears sales and revenue at the regional and country levels. It quantifies market size and growth potential for each region and its key countries, and outlines market development, outlook, addressable space, and national market size.
  • Chapter 4: Analyzes segments by Formulation Type, detailing the size and growth potential of each segment to help readers identify “blue ocean” opportunities.
  • Chapter 5: Analyzes market segments by Application, covering the size and growth potential of each segment to help readers identify “blue ocean” opportunities in downstream markets.
  • Chapter 6: Profiles key players, presenting core information on leading companies, including product sales, revenue, pricing, gross margin, product portfolio/introductions, and recent developments.
  • Chapter 7: Reviews the industry value chain, including upstream and downstream segments.
  • Chapter 8: Discusses market dynamics and recent developments, including drivers, restraints, challenges and risks for manufacturers, U.S. Tariffs and relevant policy analysis.
  • Chapter 9: Summarizes the key findings and conclusions of the report.

FAQ for this report

How fast is Artificial Tears Market growing?

Ans: The Artificial Tears Market witnessing a CAGR of 5.2% during the forecast period 2026-2032.

What is the Artificial Tears Market size in 2032?

Ans: The Artificial Tears Market size in 2032 will be US$ 5029 million.

Who are the main players in the Artificial Tears Market report?

Ans: The main players in the Artificial Tears Market are Alcon, AbbVie (Allergan), Bausch + Lomb, Santen Pharmaceutical, Rohto Pharmaceutical, Laboratoires Théa, URSAPHARM Arzneimittel, Bayer Consumer Health, Prestige Consumer Healthcare, Similasan AG, Reckitt (Optrex), AFT Pharmaceuticals, VISUfarma, OCuSOFT, Fidia Farmaceutici, SIFI S.p.A., Avizor, OmniVision Pharma GmbH, Scope Eyecare, Zhenshiming (Jiangxi) Pharmaceutical, Yuanda Pharmaceutical, Qilu Pharmaceutical

What are the Application segmentation covered in the Artificial Tears Market report?

Ans: The Applications covered in the Artificial Tears Market report are Dry Eye Disease Management, Contact Lens Wear Support, Post operative and Clinical Care, Digital Eye Strain and Office Use, Environmental Irritation Relief, Others

What are the Type segmentation covered in the Artificial Tears Market report?

Ans: The Types covered in the Artificial Tears Market report are Aqueous Drops, Emulsion Drops, Gel Drops, Ointment, Eyelid Spray

1 Artificial Tears Market Overview
1.1 Product Definition
1.2 Artificial Tears by Formulation Type
1.2.1 Global Artificial Tears Market Value by Formulation Type: 2025 vs 2032
1.2.2 Aqueous Drops
1.2.3 Emulsion Drops
1.2.4 Gel Drops
1.2.5 Ointment
1.2.6 Eyelid Spray
1.3 Artificial Tears by Preservative Attribute
1.3.1 Global Artificial Tears Market Value by Preservative Attribute: 2025 vs 2032
1.3.2 Preservative Free
1.3.3 Low Risk Preserved
1.3.4 Conventional Preserved
1.4 Artificial Tears by Polymer and Active Base
1.4.1 Global Artificial Tears Market Value by Polymer and Active Base: 2025 vs 2032
1.4.2 Carboxymethylcellulose
1.4.3 Hyaluronic Acid
1.4.4 PEG and Propylene Glycol
1.4.5 Povidone and HPMC
1.4.6 Others
1.5 Artificial Tears by Application
1.5.1 Global Artificial Tears Market Value by Application: 2025 vs 2032
1.5.2 Dry Eye Disease Management
1.5.3 Contact Lens Wear Support
1.5.4 Post operative and Clinical Care
1.5.5 Digital Eye Strain and Office Use
1.5.6 Environmental Irritation Relief
1.5.7 Others
1.6 Global Artificial Tears Market Size Estimates and Forecasts
1.6.1 Global Artificial Tears Revenue 2021–2032
1.6.2 Global Artificial Tears Sales 2021–2032
1.6.3 Global Artificial Tears Market Average Price (2021–2032)
1.7 Assumptions and Limitations
2 Artificial Tears Market Competition by Manufacturers
2.1 Global Artificial Tears Sales Market Share by Manufacturers (2021–2026)
2.2 Global Artificial Tears Revenue Market Share by Manufacturers (2021–2026)
2.3 Global Artificial Tears Average Price by Manufacturers (2021–2026)
2.4 Global Key Players of Artificial Tears, Industry Ranking, 2023 vs 2024 vs 2025
2.5 Global Key Manufacturers of Artificial Tears, Manufacturing Sites and Headquarters
2.6 Global Key Manufacturers of Artificial Tears, Product Types and Applications
2.7 Global Key Manufacturers of Artificial Tears, Date of Entry into the Industry
2.8 Global Artificial Tears Market Competitive Situation and Trends
2.8.1 Global Artificial Tears Market Concentration Rate
2.8.2 The Top 5 and Top 10 Global Artificial Tears Players Market Share by Revenue
2.8.3 Global Artificial Tears Market Share by Company Tier (Tier 1, Tier 2, Tier 3)
2.9 Manufacturers Mergers & Acquisitions, Expansion Plans
3 Global Artificial Tears Market Scenario by Region
3.1 Global Artificial Tears Market Size by Region: 2021 vs 2025 vs 2032
3.2 Global Artificial Tears Sales by Region: 2021–2032
3.2.1 Global Artificial Tears Sales by Region: 2021–2026
3.2.2 Global Artificial Tears Sales by Region: 2027–2032
3.3 Global Artificial Tears Revenue by Region: 2021–2032
3.3.1 Global Artificial Tears Revenue by Region: 2021–2026
3.3.2 Global Artificial Tears Revenue by Region: 2027–2032
3.4 North America Artificial Tears Market Facts & Figures by Country
3.4.1 North America Artificial Tears Market Size by Country: 2021 vs 2025 vs 2032
3.4.2 North America Artificial Tears Sales by Country (2021–2032)
3.4.3 North America Artificial Tears Revenue by Country (2021–2032)
3.4.4 U.S.
3.4.5 Canada
3.5 Europe Artificial Tears Market Facts & Figures by Country
3.5.1 Europe Artificial Tears Market Size by Country: 2021 vs 2025 vs 2032
3.5.2 Europe Artificial Tears Sales by Country (2021–2032)
3.5.3 Europe Artificial Tears Revenue by Country (2021–2032)
3.5.4 Germany
3.5.5 France
3.5.6 U.K.
3.5.7 Italy
3.5.8 Russia
3.6 Asia Pacific Artificial Tears Market Facts & Figures by Region
3.6.1 Asia Pacific Artificial Tears Market Size by Region: 2021 vs 2025 vs 2032
3.6.2 Asia Pacific Artificial Tears Sales by Region (2021–2032)
3.6.3 Asia Pacific Artificial Tears Revenue by Region (2021–2032)
3.6.4 China
3.6.5 Japan
3.6.6 South Korea
3.6.7 India
3.6.8 Australia
3.6.9 Taiwan
3.6.10 Indonesia
3.6.11 Thailand
3.6.12 Malaysia
3.6.13 Philippines
3.7 Latin America Artificial Tears Market Facts & Figures by Country
3.7.1 Latin America Artificial Tears Market Size by Country: 2021 vs 2025 vs 2032
3.7.2 Latin America Artificial Tears Sales by Country (2021–2032)
3.7.3 Latin America Artificial Tears Revenue by Country (2021–2032)
3.7.4 Mexico
3.7.5 Brazil
3.7.6 Argentina
3.8 Middle East and Africa Artificial Tears Market Facts & Figures by Country
3.8.1 Middle East and Africa Artificial Tears Market Size by Country: 2021 vs 2025 vs 2032
3.8.2 Middle East and Africa Artificial Tears Sales by Country (2021–2032)
3.8.3 Middle East and Africa Artificial Tears Revenue by Country (2021–2032)
3.8.4 Turkey
3.8.5 Saudi Arabia
3.8.6 U.A.E
4 Segment by Formulation Type
4.1 Global Artificial Tears Sales by Formulation Type (2021–2032)
4.1.1 Global Artificial Tears Sales by Formulation Type (2021–2026)
4.1.2 Global Artificial Tears Sales by Formulation Type (2027–2032)
4.1.3 Global Artificial Tears Sales Market Share by Formulation Type (2021–2032)
4.2 Global Artificial Tears Revenue by Formulation Type (2021–2032)
4.2.1 Global Artificial Tears Revenue by Formulation Type (2021–2026)
4.2.2 Global Artificial Tears Revenue by Formulation Type (2027–2032)
4.2.3 Global Artificial Tears Revenue Market Share by Formulation Type (2021–2032)
4.3 Global Artificial Tears Price by Formulation Type (2021–2032)
5 Segment by Application
5.1 Global Artificial Tears Sales by Application (2021–2032)
5.1.1 Global Artificial Tears Sales by Application (2021–2026)
5.1.2 Global Artificial Tears Sales by Application (2027–2032)
5.1.3 Global Artificial Tears Sales Market Share by Application (2021–2032)
5.2 Global Artificial Tears Revenue by Application (2021–2032)
5.2.1 Global Artificial Tears Revenue by Application (2021–2026)
5.2.2 Global Artificial Tears Revenue by Application (2027–2032)
5.2.3 Global Artificial Tears Revenue Market Share by Application (2021–2032)
5.3 Global Artificial Tears Price by Application (2021–2032)
6 Key Companies Profiled
6.1 Alcon
6.1.1 Alcon Company Information
6.1.2 Alcon Description and Business Overview
6.1.3 Alcon Artificial Tears Sales, Revenue, and Gross Margin (2021–2026)
6.1.4 Alcon Artificial Tears Product Portfolio
6.1.5 Alcon Recent Developments/Updates
6.2 AbbVie (Allergan)
6.2.1 AbbVie (Allergan) Company Information
6.2.2 AbbVie (Allergan) Description and Business Overview
6.2.3 AbbVie (Allergan) Artificial Tears Sales, Revenue, and Gross Margin (2021–2026)
6.2.4 AbbVie (Allergan) Artificial Tears Product Portfolio
6.2.5 AbbVie (Allergan) Recent Developments/Updates
6.3 Bausch + Lomb
6.3.1 Bausch + Lomb Company Information
6.3.2 Bausch + Lomb Description and Business Overview
6.3.3 Bausch + Lomb Artificial Tears Sales, Revenue, and Gross Margin (2021–2026)
6.3.4 Bausch + Lomb Artificial Tears Product Portfolio
6.3.5 Bausch + Lomb Recent Developments/Updates
6.4 Santen Pharmaceutical
6.4.1 Santen Pharmaceutical Company Information
6.4.2 Santen Pharmaceutical Description and Business Overview
6.4.3 Santen Pharmaceutical Artificial Tears Sales, Revenue, and Gross Margin (2021–2026)
6.4.4 Santen Pharmaceutical Artificial Tears Product Portfolio
6.4.5 Santen Pharmaceutical Recent Developments/Updates
6.5 Rohto Pharmaceutical
6.5.1 Rohto Pharmaceutical Company Information
6.5.2 Rohto Pharmaceutical Description and Business Overview
6.5.3 Rohto Pharmaceutical Artificial Tears Sales, Revenue, and Gross Margin (2021–2026)
6.5.4 Rohto Pharmaceutical Artificial Tears Product Portfolio
6.5.5 Rohto Pharmaceutical Recent Developments/Updates
6.6 Laboratoires Théa
6.6.1 Laboratoires Théa Company Information
6.6.2 Laboratoires Théa Description and Business Overview
6.6.3 Laboratoires Théa Artificial Tears Sales, Revenue, and Gross Margin (2021–2026)
6.6.4 Laboratoires Théa Artificial Tears Product Portfolio
6.6.5 Laboratoires Théa Recent Developments/Updates
6.7 URSAPHARM Arzneimittel
6.7.1 URSAPHARM Arzneimittel Company Information
6.7.2 URSAPHARM Arzneimittel Description and Business Overview
6.7.3 URSAPHARM Arzneimittel Artificial Tears Sales, Revenue, and Gross Margin (2021–2026)
6.7.4 URSAPHARM Arzneimittel Artificial Tears Product Portfolio
6.7.5 URSAPHARM Arzneimittel Recent Developments/Updates
6.8 Bayer Consumer Health
6.8.1 Bayer Consumer Health Company Information
6.8.2 Bayer Consumer Health Description and Business Overview
6.8.3 Bayer Consumer Health Artificial Tears Sales, Revenue, and Gross Margin (2021–2026)
6.8.4 Bayer Consumer Health Artificial Tears Product Portfolio
6.8.5 Bayer Consumer Health Recent Developments/Updates
6.9 Prestige Consumer Healthcare
6.9.1 Prestige Consumer Healthcare Company Information
6.9.2 Prestige Consumer Healthcare Description and Business Overview
6.9.3 Prestige Consumer Healthcare Artificial Tears Sales, Revenue, and Gross Margin (2021–2026)
6.9.4 Prestige Consumer Healthcare Artificial Tears Product Portfolio
6.9.5 Prestige Consumer Healthcare Recent Developments/Updates
6.10 Similasan AG
6.10.1 Similasan AG Company Information
6.10.2 Similasan AG Description and Business Overview
6.10.3 Similasan AG Artificial Tears Sales, Revenue, and Gross Margin (2021–2026)
6.10.4 Similasan AG Artificial Tears Product Portfolio
6.10.5 Similasan AG Recent Developments/Updates
6.11 Reckitt (Optrex)
6.11.1 Reckitt (Optrex) Company Information
6.11.2 Reckitt (Optrex) Description and Business Overview
6.11.3 Reckitt (Optrex) Artificial Tears Sales, Revenue, and Gross Margin (2021–2026)
6.11.4 Reckitt (Optrex) Artificial Tears Product Portfolio
6.11.5 Reckitt (Optrex) Recent Developments/Updates
6.12 AFT Pharmaceuticals
6.12.1 AFT Pharmaceuticals Company Information
6.12.2 AFT Pharmaceuticals Description and Business Overview
6.12.3 AFT Pharmaceuticals Artificial Tears Sales, Revenue, and Gross Margin (2021–2026)
6.12.4 AFT Pharmaceuticals Artificial Tears Product Portfolio
6.12.5 AFT Pharmaceuticals Recent Developments/Updates
6.13 VISUfarma
6.13.1 VISUfarma Company Information
6.13.2 VISUfarma Description and Business Overview
6.13.3 VISUfarma Artificial Tears Sales, Revenue, and Gross Margin (2021–2026)
6.13.4 VISUfarma Artificial Tears Product Portfolio
6.13.5 VISUfarma Recent Developments/Updates
6.14 OCuSOFT
6.14.1 OCuSOFT Company Information
6.14.2 OCuSOFT Description and Business Overview
6.14.3 OCuSOFT Artificial Tears Sales, Revenue, and Gross Margin (2021–2026)
6.14.4 OCuSOFT Artificial Tears Product Portfolio
6.14.5 OCuSOFT Recent Developments/Updates
6.15 Fidia Farmaceutici
6.15.1 Fidia Farmaceutici Company Information
6.15.2 Fidia Farmaceutici Description and Business Overview
6.15.3 Fidia Farmaceutici Artificial Tears Sales, Revenue, and Gross Margin (2021–2026)
6.15.4 Fidia Farmaceutici Artificial Tears Product Portfolio
6.15.5 Fidia Farmaceutici Recent Developments/Updates
6.16 SIFI S.p.A.
6.16.1 SIFI S.p.A. Company Information
6.16.2 SIFI S.p.A. Description and Business Overview
6.16.3 SIFI S.p.A. Artificial Tears Sales, Revenue, and Gross Margin (2021–2026)
6.16.4 SIFI S.p.A. Artificial Tears Product Portfolio
6.16.5 SIFI S.p.A. Recent Developments/Updates
6.17 Avizor
6.17.1 Avizor Company Information
6.17.2 Avizor Description and Business Overview
6.17.3 Avizor Artificial Tears Sales, Revenue, and Gross Margin (2021–2026)
6.17.4 Avizor Artificial Tears Product Portfolio
6.17.5 Avizor Recent Developments/Updates
6.18 OmniVision Pharma GmbH
6.18.1 OmniVision Pharma GmbH Company Information
6.18.2 OmniVision Pharma GmbH Description and Business Overview
6.18.3 OmniVision Pharma GmbH Artificial Tears Sales, Revenue, and Gross Margin (2021–2026)
6.18.4 OmniVision Pharma GmbH Artificial Tears Product Portfolio
6.18.5 OmniVision Pharma GmbH Recent Developments/Updates
6.19 Scope Eyecare
6.19.1 Scope Eyecare Company Information
6.19.2 Scope Eyecare Description and Business Overview
6.19.3 Scope Eyecare Artificial Tears Sales, Revenue, and Gross Margin (2021–2026)
6.19.4 Scope Eyecare Artificial Tears Product Portfolio
6.19.5 Scope Eyecare Recent Developments/Updates
6.20 Zhenshiming (Jiangxi) Pharmaceutical
6.20.1 Zhenshiming (Jiangxi) Pharmaceutical Company Information
6.20.2 Zhenshiming (Jiangxi) Pharmaceutical Description and Business Overview
6.20.3 Zhenshiming (Jiangxi) Pharmaceutical Artificial Tears Sales, Revenue, and Gross Margin (2021–2026)
6.20.4 Zhenshiming (Jiangxi) Pharmaceutical Artificial Tears Product Portfolio
6.20.5 Zhenshiming (Jiangxi) Pharmaceutical Recent Developments/Updates
6.21 Yuanda Pharmaceutical
6.21.1 Yuanda Pharmaceutical Company Information
6.21.2 Yuanda Pharmaceutical Description and Business Overview
6.21.3 Yuanda Pharmaceutical Artificial Tears Sales, Revenue, and Gross Margin (2021–2026)
6.21.4 Yuanda Pharmaceutical Artificial Tears Product Portfolio
6.21.5 Yuanda Pharmaceutical Recent Developments/Updates
6.22 Qilu Pharmaceutical
6.22.1 Qilu Pharmaceutical Company Information
6.22.2 Qilu Pharmaceutical Description and Business Overview
6.22.3 Qilu Pharmaceutical Artificial Tears Sales, Revenue, and Gross Margin (2021–2026)
6.22.4 Qilu Pharmaceutical Artificial Tears Product Portfolio
6.22.5 Qilu Pharmaceutical Recent Developments/Updates
7 Industry Chain and Sales Channels Analysis
7.1 Artificial Tears Industry Chain Analysis
7.2 Artificial Tears Raw Material Supply Analysis
7.2.1 Key Raw Materials
7.2.2 Raw Materials Key Suppliers
7.3 Artificial Tears Production Mode & Process Analysis
7.4 Artificial Tears Sales and Marketing
7.4.1 Artificial Tears Sales Channels
7.4.2 Artificial Tears Distributors
7.5 Artificial Tears Customer Analysis
8 Artificial Tears Market Dynamics
8.1 Artificial Tears Industry Trends
8.2 Artificial Tears Market Drivers
8.3 Artificial Tears Market Challenges
8.4 Artificial Tears Market Restraints
8.5 Impact of U.S. Tariffs
9 Research Findings and Conclusion
10 Methodology and Data Source
10.1 Methodology/Research Approach
10.1.1 Research Programs/Design
10.1.2 Market Size Estimation
10.1.3 Market Breakdown and Data Triangulation
10.2 Data Source
10.2.1 Secondary Sources
10.2.2 Primary Sources
10.3 Author List
10.4 Disclaimer
List of Tables
 Table 1. Global Artificial Tears Market Value by Formulation Type (US$ Million), 2025 vs 2032
 Table 2. Global Artificial Tears Market Value by Preservative Attribute (US$ Million), 2025 vs 2032
 Table 3. Global Artificial Tears Market Value by Polymer and Active Base (US$ Million), 2025 vs 2032
 Table 4. Global Artificial Tears Market Value by Application (US$ Million), 2025 vs 2032
 Table 5. Global Artificial Tears Market Competitive Situation by Manufacturers in 2025
 Table 6. Global Artificial Tears Sales (M Units) of Key Manufacturers (2021–2026)
 Table 7. Global Artificial Tears Sales Market Share by Manufacturers (2021–2026)
 Table 8. Global Artificial Tears Revenue (US$ Million) by Manufacturers (2021–2026)
 Table 9. Global Artificial Tears Revenue Share by Manufacturers (2021–2026)
 Table 10. Global Market Artificial Tears Average Price (US$/Unit) of Key Manufacturers (2021–2026)
 Table 11. Global Key Players of Artificial Tears, Industry Ranking, 2023 vs 2024 vs 2025
 Table 12. Global Key Manufacturers of Artificial Tears, Manufacturing Sites and Headquarters
 Table 13. Global Key Manufacturers of Artificial Tears, Product Types and Applications
 Table 14. Global Key Manufacturers of Artificial Tears, Date of Entry into the Industry
 Table 15. Global Manufacturers Market Concentration Ratio (CR5 and HHI)
 Table 16. Global Artificial Tears Companies by Tier (Tier 1, Tier 2, Tier 3), based on Artificial Tears Revenue, 2025
 Table 17. Manufacturers Mergers & Acquisitions, Expansion Plans
 Table 18. Global Artificial Tears Market Size by Region (US$ Million): 2021 vs 2025 vs 2032
 Table 19. Global Artificial Tears Sales by Region (M Units), 2021–2026
 Table 20. Global Artificial Tears Sales Market Share by Region (2021–2026)
 Table 21. Global Artificial Tears Sales by Region (M Units), 2027–2032
 Table 22. Global Artificial Tears Sales Market Share by Region (2027–2032)
 Table 23. Global Artificial Tears Revenue by Region (US$ Million), 2021–2026
 Table 24. Global Artificial Tears Revenue Market Share by Region (2021–2026)
 Table 25. Global Artificial Tears Revenue by Region (US$ Million), 2027–2032
 Table 26. Global Artificial Tears Revenue Market Share by Region (2027–2032)
 Table 27. North America Artificial Tears Revenue by Country: 2021 vs 2025 vs 2032 (US$ Million)
 Table 28. North America Artificial Tears Sales by Country (M Units), 2021–2026
 Table 29. North America Artificial Tears Sales by Country (M Units), 2027–2032
 Table 30. North America Artificial Tears Revenue by Country (US$ Million), 2021–2026
 Table 31. North America Artificial Tears Revenue by Country (US$ Million), 2027–2032
 Table 32. Europe Artificial Tears Revenue by Country: 2021 vs 2025 vs 2032 (US$ Million)
 Table 33. Europe Artificial Tears Sales by Country (M Units), 2021–2026
 Table 34. Europe Artificial Tears Sales by Country (M Units), 2027–2032
 Table 35. Europe Artificial Tears Revenue by Country (US$ Million), 2021–2026
 Table 36. Europe Artificial Tears Revenue by Country (US$ Million), 2027–2032
 Table 37. Asia Pacific Artificial Tears Revenue by Region: 2021 vs 2025 vs 2032 (US$ Million)
 Table 38. Asia Pacific Artificial Tears Sales by Region (M Units), 2021–2026
 Table 39. Asia Pacific Artificial Tears Sales by Region (M Units), 2027–2032
 Table 40. Asia Pacific Artificial Tears Revenue by Region (US$ Million), 2021–2026
 Table 41. Asia Pacific Artificial Tears Revenue by Region (US$ Million), 2027–2032
 Table 42. Latin America Artificial Tears Revenue by Country: 2021 vs 2025 vs 2032 (US$ Million)
 Table 43. Latin America Artificial Tears Sales by Country (M Units), 2021–2026
 Table 44. Latin America Artificial Tears Sales by Country (M Units), 2027–2032
 Table 45. Latin America Artificial Tears Revenue by Country (US$ Million), 2021–2026
 Table 46. Latin America Artificial Tears Revenue by Country (US$ Million), 2027–2032
 Table 47. Middle East and Africa Artificial Tears Revenue by Country: 2021 vs 2025 vs 2032 (US$ Million)
 Table 48. Middle East and Africa Artificial Tears Sales by Country (M Units), 2021–2026
 Table 49. Middle East and Africa Artificial Tears Sales by Country (M Units), 2027–2032
 Table 50. Middle East and Africa Artificial Tears Revenue by Country (US$ Million), 2021–2026
 Table 51. Middle East and Africa Artificial Tears Revenue by Country (US$ Million), 2027–2032
 Table 52. Global Artificial Tears Sales (M Units) by Formulation Type (2021–2026)
 Table 53. Global Artificial Tears Sales (M Units) by Formulation Type (2027–2032)
 Table 54. Global Artificial Tears Sales Market Share by Formulation Type (2021–2026)
 Table 55. Global Artificial Tears Sales Market Share by Formulation Type (2027–2032)
 Table 56. Global Artificial Tears Revenue (US$ Million) by Formulation Type (2021–2026)
 Table 57. Global Artificial Tears Revenue (US$ Million) by Formulation Type (2027–2032)
 Table 58. Global Artificial Tears Revenue Market Share by Formulation Type (2021–2026)
 Table 59. Global Artificial Tears Revenue Market Share by Formulation Type (2027–2032)
 Table 60. Global Artificial Tears Price (US$/Unit) by Formulation Type (2021–2026)
 Table 61. Global Artificial Tears Price (US$/Unit) by Formulation Type (2027–2032)
 Table 62. Global Artificial Tears Sales (M Units) by Application (2021–2026)
 Table 63. Global Artificial Tears Sales (M Units) by Application (2027–2032)
 Table 64. Global Artificial Tears Sales Market Share by Application (2021–2026)
 Table 65. Global Artificial Tears Sales Market Share by Application (2027–2032)
 Table 66. Global Artificial Tears Revenue (US$ Million) by Application (2021–2026)
 Table 67. Global Artificial Tears Revenue (US$ Million) by Application (2027–2032)
 Table 68. Global Artificial Tears Revenue Market Share by Application (2021–2026)
 Table 69. Global Artificial Tears Revenue Market Share by Application (2027–2032)
 Table 70. Global Artificial Tears Price (US$/Unit) by Application (2021–2026)
 Table 71. Global Artificial Tears Price (US$/Unit) by Application (2027–2032)
 Table 72. Alcon Company Information
 Table 73. Alcon Description and Business Overview
 Table 74. Alcon Artificial Tears Sales (M Units), Revenue (US$ Million), Price (US$/Unit), and Gross Margin (2021–2026)
 Table 75. Alcon Artificial Tears Product
 Table 76. Alcon Recent Developments/Updates
 Table 77. AbbVie (Allergan) Company Information
 Table 78. AbbVie (Allergan) Description and Business Overview
 Table 79. AbbVie (Allergan) Artificial Tears Sales (M Units), Revenue (US$ Million), Price (US$/Unit), and Gross Margin (2021–2026)
 Table 80. AbbVie (Allergan) Artificial Tears Product
 Table 81. AbbVie (Allergan) Recent Developments/Updates
 Table 82. Bausch + Lomb Company Information
 Table 83. Bausch + Lomb Description and Business Overview
 Table 84. Bausch + Lomb Artificial Tears Sales (M Units), Revenue (US$ Million), Price (US$/Unit), and Gross Margin (2021–2026)
 Table 85. Bausch + Lomb Artificial Tears Product
 Table 86. Bausch + Lomb Recent Developments/Updates
 Table 87. Santen Pharmaceutical Company Information
 Table 88. Santen Pharmaceutical Description and Business Overview
 Table 89. Santen Pharmaceutical Artificial Tears Sales (M Units), Revenue (US$ Million), Price (US$/Unit), and Gross Margin (2021–2026)
 Table 90. Santen Pharmaceutical Artificial Tears Product
 Table 91. Santen Pharmaceutical Recent Developments/Updates
 Table 92. Rohto Pharmaceutical Company Information
 Table 93. Rohto Pharmaceutical Description and Business Overview
 Table 94. Rohto Pharmaceutical Artificial Tears Sales (M Units), Revenue (US$ Million), Price (US$/Unit), and Gross Margin (2021–2026)
 Table 95. Rohto Pharmaceutical Artificial Tears Product
 Table 96. Rohto Pharmaceutical Recent Developments/Updates
 Table 97. Laboratoires Théa Company Information
 Table 98. Laboratoires Théa Description and Business Overview
 Table 99. Laboratoires Théa Artificial Tears Sales (M Units), Revenue (US$ Million), Price (US$/Unit), and Gross Margin (2021–2026)
 Table 100. Laboratoires Théa Artificial Tears Product
 Table 101. Laboratoires Théa Recent Developments/Updates
 Table 102. URSAPHARM Arzneimittel Company Information
 Table 103. URSAPHARM Arzneimittel Description and Business Overview
 Table 104. URSAPHARM Arzneimittel Artificial Tears Sales (M Units), Revenue (US$ Million), Price (US$/Unit), and Gross Margin (2021–2026)
 Table 105. URSAPHARM Arzneimittel Artificial Tears Product
 Table 106. URSAPHARM Arzneimittel Recent Developments/Updates
 Table 107. Bayer Consumer Health Company Information
 Table 108. Bayer Consumer Health Description and Business Overview
 Table 109. Bayer Consumer Health Artificial Tears Sales (M Units), Revenue (US$ Million), Price (US$/Unit), and Gross Margin (2021–2026)
 Table 110. Bayer Consumer Health Artificial Tears Product
 Table 111. Bayer Consumer Health Recent Developments/Updates
 Table 112. Prestige Consumer Healthcare Company Information
 Table 113. Prestige Consumer Healthcare Description and Business Overview
 Table 114. Prestige Consumer Healthcare Artificial Tears Sales (M Units), Revenue (US$ Million), Price (US$/Unit), and Gross Margin (2021–2026)
 Table 115. Prestige Consumer Healthcare Artificial Tears Product
 Table 116. Prestige Consumer Healthcare Recent Developments/Updates
 Table 117. Similasan AG Company Information
 Table 118. Similasan AG Description and Business Overview
 Table 119. Similasan AG Artificial Tears Sales (M Units), Revenue (US$ Million), Price (US$/Unit), and Gross Margin (2021–2026)
 Table 120. Similasan AG Artificial Tears Product
 Table 121. Similasan AG Recent Developments/Updates
 Table 122. Reckitt (Optrex) Company Information
 Table 123. Reckitt (Optrex) Description and Business Overview
 Table 124. Reckitt (Optrex) Artificial Tears Sales (M Units), Revenue (US$ Million), Price (US$/Unit), and Gross Margin (2021–2026)
 Table 125. Reckitt (Optrex) Artificial Tears Product
 Table 126. Reckitt (Optrex) Recent Developments/Updates
 Table 127. AFT Pharmaceuticals Company Information
 Table 128. AFT Pharmaceuticals Description and Business Overview
 Table 129. AFT Pharmaceuticals Artificial Tears Sales (M Units), Revenue (US$ Million), Price (US$/Unit), and Gross Margin (2021–2026)
 Table 130. AFT Pharmaceuticals Artificial Tears Product
 Table 131. AFT Pharmaceuticals Recent Developments/Updates
 Table 132. VISUfarma Company Information
 Table 133. VISUfarma Description and Business Overview
 Table 134. VISUfarma Artificial Tears Sales (M Units), Revenue (US$ Million), Price (US$/Unit), and Gross Margin (2021–2026)
 Table 135. VISUfarma Artificial Tears Product
 Table 136. VISUfarma Recent Developments/Updates
 Table 137. OCuSOFT Company Information
 Table 138. OCuSOFT Description and Business Overview
 Table 139. OCuSOFT Artificial Tears Sales (M Units), Revenue (US$ Million), Price (US$/Unit), and Gross Margin (2021–2026)
 Table 140. OCuSOFT Artificial Tears Product
 Table 141. OCuSOFT Recent Developments/Updates
 Table 142. Fidia Farmaceutici Company Information
 Table 143. Fidia Farmaceutici Description and Business Overview
 Table 144. Fidia Farmaceutici Artificial Tears Sales (M Units), Revenue (US$ Million), Price (US$/Unit), and Gross Margin (2021–2026)
 Table 145. Fidia Farmaceutici Artificial Tears Product
 Table 146. Fidia Farmaceutici Recent Developments/Updates
 Table 147. SIFI S.p.A. Company Information
 Table 148. SIFI S.p.A. Description and Business Overview
 Table 149. SIFI S.p.A. Artificial Tears Sales (M Units), Revenue (US$ Million), Price (US$/Unit), and Gross Margin (2021–2026)
 Table 150. SIFI S.p.A. Artificial Tears Product
 Table 151. SIFI S.p.A. Recent Developments/Updates
 Table 152. Avizor Company Information
 Table 153. Avizor Description and Business Overview
 Table 154. Avizor Artificial Tears Sales (M Units), Revenue (US$ Million), Price (US$/Unit), and Gross Margin (2021–2026)
 Table 155. Avizor Artificial Tears Product
 Table 156. Avizor Recent Developments/Updates
 Table 157. OmniVision Pharma GmbH Company Information
 Table 158. OmniVision Pharma GmbH Description and Business Overview
 Table 159. OmniVision Pharma GmbH Artificial Tears Sales (M Units), Revenue (US$ Million), Price (US$/Unit), and Gross Margin (2021–2026)
 Table 160. OmniVision Pharma GmbH Artificial Tears Product
 Table 161. OmniVision Pharma GmbH Recent Developments/Updates
 Table 162. Scope Eyecare Company Information
 Table 163. Scope Eyecare Description and Business Overview
 Table 164. Scope Eyecare Artificial Tears Sales (M Units), Revenue (US$ Million), Price (US$/Unit), and Gross Margin (2021–2026)
 Table 165. Scope Eyecare Artificial Tears Product
 Table 166. Scope Eyecare Recent Developments/Updates
 Table 167. Zhenshiming (Jiangxi) Pharmaceutical Company Information
 Table 168. Zhenshiming (Jiangxi) Pharmaceutical Description and Business Overview
 Table 169. Zhenshiming (Jiangxi) Pharmaceutical Artificial Tears Sales (M Units), Revenue (US$ Million), Price (US$/Unit), and Gross Margin (2021–2026)
 Table 170. Zhenshiming (Jiangxi) Pharmaceutical Artificial Tears Product
 Table 171. Zhenshiming (Jiangxi) Pharmaceutical Recent Developments/Updates
 Table 172. Yuanda Pharmaceutical Company Information
 Table 173. Yuanda Pharmaceutical Description and Business Overview
 Table 174. Yuanda Pharmaceutical Artificial Tears Sales (M Units), Revenue (US$ Million), Price (US$/Unit), and Gross Margin (2021–2026)
 Table 175. Yuanda Pharmaceutical Artificial Tears Product
 Table 176. Yuanda Pharmaceutical Recent Developments/Updates
 Table 177. Qilu Pharmaceutical Company Information
 Table 178. Qilu Pharmaceutical Description and Business Overview
 Table 179. Qilu Pharmaceutical Artificial Tears Sales (M Units), Revenue (US$ Million), Price (US$/Unit), and Gross Margin (2021–2026)
 Table 180. Qilu Pharmaceutical Artificial Tears Product
 Table 181. Qilu Pharmaceutical Recent Developments/Updates
 Table 182. Key Raw Materials Lists
 Table 183. Raw Materials Key Suppliers Lists
 Table 184. Artificial Tears Distributors List
 Table 185. Artificial Tears Customers List
 Table 186. Artificial Tears Market Trends
 Table 187. Artificial Tears Market Drivers
 Table 188. Artificial Tears Market Challenges
 Table 189. Artificial Tears Market Restraints
 Table 190. Research Programs/Design for This Report
 Table 191. Key Data Information from Secondary Sources
 Table 192. Key Data Information from Primary Sources
 Table 193. Authors List of This Report


List of Figures
 Figure 1. Product Picture of Artificial Tears
 Figure 2. Global Artificial Tears Market Value by Formulation Type (US$ Million), 2021–2032
 Figure 3. Global Artificial Tears Market Share by Formulation Type: 2025 & 2032
 Figure 4. Aqueous Drops Product Picture
 Figure 5. Emulsion Drops Product Picture
 Figure 6. Gel Drops Product Picture
 Figure 7. Ointment Product Picture
 Figure 8. Eyelid Spray Product Picture
 Figure 9. Global Artificial Tears Market Value by Preservative Attribute (US$ Million), 2021–2032
 Figure 10. Global Artificial Tears Market Share by Preservative Attribute: 2025 vs 2032
 Figure 11. Preservative Free Product Picture
 Figure 12. Low Risk Preserved Product Picture
 Figure 13. Conventional Preserved Product Picture
 Figure 14. Global Artificial Tears Market Value by Polymer and Active Base (US$ Million), 2021–2032
 Figure 15. Global Artificial Tears Market Share by Polymer and Active Base: 2025 vs 2032
 Figure 16. Carboxymethylcellulose Product Picture
 Figure 17. Hyaluronic Acid Product Picture
 Figure 18. PEG and Propylene Glycol Product Picture
 Figure 19. Povidone and HPMC Product Picture
 Figure 20. Others Product Picture
 Figure 21. Global Artificial Tears Market Value by Application (US$ Million), 2021–2032
 Figure 22. Global Artificial Tears Market Share by Application: 2025 & 2032
 Figure 23. Dry Eye Disease Management
 Figure 24. Contact Lens Wear Support
 Figure 25. Post operative and Clinical Care
 Figure 26. Digital Eye Strain and Office Use
 Figure 27. Environmental Irritation Relief
 Figure 28. Others
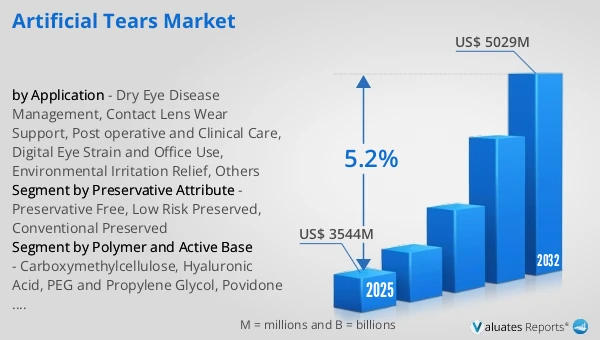
 Figure 29. Global Artificial Tears Revenue, (US$ Million), 2021 vs 2025 vs 2032
 Figure 30. Global Artificial Tears Market Size (US$ Million), 2021–2032
 Figure 31. Global Artificial Tears Sales (M Units), 2021–2032
 Figure 32. Global Artificial Tears Average Price (US$/Unit), 2021–2032
 Figure 33. Artificial Tears Report Years Considered
 Figure 34. Artificial Tears Sales Share by Manufacturers in 2025
 Figure 35. Global Artificial Tears Revenue Share by Manufacturers in 2025
 Figure 36. Top 5 and Top 10 Global Artificial Tears Players: Market Share by Revenue in Artificial Tears in 2025
 Figure 37. Artificial Tears Market Share by Company Type (Tier 1, Tier 2, and Tier 3): 2021 vs 2025
 Figure 38. Global Artificial Tears Market Size by Region (US$ Million): 2021 vs 2025 vs 2032
 Figure 39. North America Artificial Tears Sales Market Share by Country (2021–2032)
 Figure 40. North America Artificial Tears Revenue Market Share by Country (2021–2032)
 Figure 41. U.S. Artificial Tears Revenue Growth Rate (US$ Million), 2021–2032
 Figure 42. Canada Artificial Tears Revenue Growth Rate (US$ Million), 2021–2032
 Figure 43. Europe Artificial Tears Sales Market Share by Country (2021–2032)
 Figure 44. Europe Artificial Tears Revenue Market Share by Country (2021–2032)
 Figure 45. Germany Artificial Tears Revenue Growth Rate (US$ Million), 2021–2032
 Figure 46. France Artificial Tears Revenue Growth Rate (US$ Million), 2021–2032
 Figure 47. U.K. Artificial Tears Revenue Growth Rate (US$ Million), 2021–2032
 Figure 48. Italy Artificial Tears Revenue Growth Rate (US$ Million), 2021–2032
 Figure 49. Russia Artificial Tears Revenue Growth Rate (US$ Million), 2021–2032
 Figure 50. Asia Pacific Artificial Tears Sales Market Share by Region (2021–2032)
 Figure 51. Asia Pacific Artificial Tears Revenue Market Share by Region (2021–2032)
 Figure 52. China Artificial Tears Revenue Growth Rate (US$ Million), 2021–2032
 Figure 53. Japan Artificial Tears Revenue Growth Rate (US$ Million), 2021–2032
 Figure 54. South Korea Artificial Tears Revenue Growth Rate (US$ Million), 2021–2032
 Figure 55. India Artificial Tears Revenue Growth Rate (US$ Million), 2021–2032
 Figure 56. Australia Artificial Tears Revenue Growth Rate (US$ Million), 2021–2032
 Figure 57. Taiwan Artificial Tears Revenue Growth Rate (US$ Million), 2021–2032
 Figure 58. Indonesia Artificial Tears Revenue Growth Rate (US$ Million), 2021–2032
 Figure 59. Thailand Artificial Tears Revenue Growth Rate (US$ Million), 2021–2032
 Figure 60. Malaysia Artificial Tears Revenue Growth Rate (US$ Million), 2021–2032
 Figure 61. Philippines Artificial Tears Revenue Growth Rate (US$ Million), 2021–2032
 Figure 62. Latin America Artificial Tears Sales Market Share by Country (2021–2032)
 Figure 63. Latin America Artificial Tears Revenue Market Share by Country (2021–2032)
 Figure 64. Mexico Artificial Tears Revenue Growth Rate (US$ Million), 2021–2032
 Figure 65. Brazil Artificial Tears Revenue Growth Rate (US$ Million), 2021–2032
 Figure 66. Argentina Artificial Tears Revenue Growth Rate (US$ Million), 2021–2032
 Figure 67. Middle East and Africa Artificial Tears Sales Market Share by Country (2021–2032)
 Figure 68. Middle East and Africa Artificial Tears Revenue Market Share by Country (2021–2032)
 Figure 69. Turkey Artificial Tears Revenue Growth Rate (US$ Million), 2021–2032
 Figure 70. Saudi Arabia Artificial Tears Revenue Growth Rate (US$ Million), 2021–2032
 Figure 71. U.A.E Artificial Tears Revenue Growth Rate (US$ Million), 2021–2032
 Figure 72. Global Sales Market Share of Artificial Tears by Formulation Type (2021–2032)
 Figure 73. Global Revenue Market Share of Artificial Tears by Formulation Type (2021–2032)
 Figure 74. Global Artificial Tears Price (US$/Unit) by Formulation Type (2021–2032)
 Figure 75. Global Sales Market Share of Artificial Tears by Application (2021–2032)
 Figure 76. Global Revenue Market Share of Artificial Tears by Application (2021–2032)
 Figure 77. Global Artificial Tears Price (US$/Unit) by Application (2021–2032)
 Figure 78. Artificial Tears Value Chain
 Figure 79. Channels of Distribution (Direct Vs Distribution)
 Figure 80. Bottom-up and Top-down Approaches for This Report
 Figure 81. Data Triangulation
 Figure 82. Key Executives Interviewed
SELECT A FORMAT
Added to Cart
Electronic

$2900

Single User License
Electronic

$4350

Multi User License
Electronic

$5800

Enterprise License
Add to Cart
Buy Now (15% Discount)

OUR CUSTOMER

Novocure

SIMILAR REPORTS