0
U.S. (TOLL FREE)
+1 (315) 215-3225
Automative

0
U.S. (TOLL FREE)
+1 (315) 215-3225
Global PE Pipe Market Research Report 2026
Published Date: 2026-01-16
|
Report Code: QYRE-Auto-18S633
Home | Market Reports | Business & Industrial| Energy & Utilities
Global PE Pipe Market Insights and Forecast to 2028
BUY CHAPTERS

Global PE Pipe Market Research Report 2026

Code: QYRE-Auto-18S633
Report
2026-01-16
Pages:179
QYResearch
Buy Now with 15% Discount
DESCRIPTION
TABLE OF CONTENT
TABLES & FIGURES

PE Pipe Market Size

The global PE Pipe market was valued at US$ 31447 million in 2025 and is anticipated to reach US$ 40447 million by 2032, at a CAGR of 3.9% from 2026 to 2032.

PE Pipe Market

PE Pipe Market

The 2025 U.S. tariff policies introduce profound uncertainty into the global economic landscape. This report critically examines the implications of recent tariff adjustments and international strategic countermeasures on PE Pipe competitive dynamics, regional economic interdependencies, and supply chain reconfigurations.
PE Pipe is made from polyethylene. PE pipe is extremely strong, durable, flexible, corrosion free and chemical resistant. These features make it perfect for a variety of underground conditions and help it last up to 100 years. PE pipe is used widely in water and natural gas distribution systems.In 2024, global PE Pipe production reached approximately 18663 K MT, with an average global market price of around US$ 1685 per MT.
The PE pipe market is driven first by water and wastewater infrastructure renewal: cities and utilities replace aging metal and concrete lines to reduce leakage, corrosion failures, and maintenance, and they favor PE because it’s lightweight, flexible, and can be heat-fused into long, leak-tight strings that handle ground movement and seismic events better than many rigid materials. A second driver is gas distribution modernization, where utilities continue replacing legacy mains and service lines with PE for safety and reliability; growth also comes from stormwater drainage and land development, agricultural irrigation in water-stressed regions, and telecom/power ducting as fiber buildouts and undergrounding expand. Adoption is further reinforced by installation trends—especially trenchless methods (HDD, pipe bursting, sliplining) that reduce surface disruption and often make PE the most practical choice—plus a steady shift toward higher-performance PE systems (larger diameters, higher pressure classes, and crack-resistant grades) as standards and lifetime expectations rise.
Upstream, the market starts with pipe-grade PE resin supply (HDPE/MDPE grades such as PE80/PE100/PE4710 and related RC grades), whose pricing and availability are closely tied to the ethylene and alpha-olefin comonomer chains and to regional petrochemical economics; resin volatility is usually the biggest cost driver for pipe producers. Next are additives and masterbatches—carbon black/UV stabilizers for outdoor durability, antioxidants for long-term oxidative resistance, and processing aids—that are essential for meeting pressure-pipe lifetime requirements; any change in additive package can affect qualification, so consistent upstream supply matters. Beyond materials, the pipe supply chain depends on extrusion and compounding capacity, tooling, and testing infrastructure (hydrostatic pressure testing, dimensional control, OIT/oxidation tests), and on the parallel upstream for fittings and joining systems (injection-molded or fabricated fittings, electrofusion couplers, fusion machines, and trained installers), because the “system” (pipe + fittings + installation quality) largely determines field performance and acceptance by utilities.
From a profitability standpoint, PE pipe is generally a high-volume, project-driven manufacturing business where margins move with resin pass-through discipline, capacity utilization, mix (pressure pipe vs drainage/duct), and value-added offerings (engineered fittings, fabrication, installation support, proprietary systems), and pricing can tighten or loosen quickly with construction cycles and municipal budgets. In one sentence: the industry’s gross profit margin is typically in the high-teens to mid-20% range, higher for differentiated systems and strong utilization and lower during resin shocks or competitive oversupply.
This report delivers a comprehensive overview of the global PE Pipe market, with both quantitative and qualitative analyses, to help readers develop growth strategies, assess the competitive landscape, evaluate their position in the current market, and make informed business decisions regarding PE Pipe. The PE Pipe market size, estimates, and forecasts are provided in terms of shipments (K MT) and revenue (US$ millions), with 2025 as the base year and historical and forecast data for 2021–2032.
The report segments the global PE Pipe market comprehensively. Regional market sizes by Type, by Application, by Feature, and by company are also provided. For deeper insight, the report profiles the competitive landscape, key competitors, and their respective market rankings, and discusses technological trends and new product developments.
This report will assist PE Pipe manufacturers, new entrants, and companies across the industry value chain with information on revenues, production, and average prices for the overall market and its sub-segments, by company, by Type, by Application, and by region.
Market Segmentation

Scope of PE Pipe Market Report

Report Metric Details
Report Name PE Pipe Market
Accounted market size in 2025 US$ 31447 million
Forecasted market size in 2032 US$ 40447 million
CAGR 3.9%
Base Year 2025
Forecasted years 2026 - 2032
Segment by Type
  • HDPE (High-Density Polyethylene) Pipe
  • MDPE (Medium -Density Polyethylene) Pipe
  • LDPE (Low-Density Polyethylene) Pipe
Segment by Feature
  • Solid Wall Pipe
  • Corrugated Pipe
  • Perforated Pipe
  • Other
Segment by Channel
  • Direct Selling
  • Distribution
by Application
  • Water Supply Pipe
  • Sewage & Drainage Pipe
  • Oil & Gas Pipe
  • Agriculture Pipe
  • Others
Production by Region
  • North America
  • Europe
  • Middle East & Africa
  • Japan
  • China
  • China Taiwan
  • South Korea
  • India
  • Australia
Consumption by Region
  • North America (United States, Canada)
  • Europe (Germany, France, UK, Italy, Russia)
  • Asia-Pacific (China, Japan, South Korea, Taiwan)
  • Southeast Asia (India)
  • Latin America (Mexico, Brazil)
By Company JM Eagle, Chevron Phillips Chemical, WL Plastics Corporation, GPS PE Pipe Systems, System Group, Wavin, Pipelife, Advanced Drainage Systems, Marley Pipe Systems, Fujian Newchoice Pipe, Dura-Line, Hsiung Yeu Enterprise, Blue Diamond Industries, Sekisui Chemical, Nan Ya Plastics Corporation, Kubota-C.I., Tessenderlo Group, Vinidex Pty, Plastic Industries, Cromford Pipe, Sangir Plastics, Shree Darshan Pipes, China Lesso Group, Weixing New Materials, Cangzhou Mingzhu Plastic, Ginde Plastic Pipe Industry, Kangtai Pipe Industry, Chinaust Group, Junxing Pipe Industry, Shandong Shenbon Plastics, Yonggao, Zhejiang Fengye, Goody Technology, Tianjin Botong Plastics, Wuhan Kingbull, Hongyue Plastics, Fujian Aron
Forecast units USD million in value
Report coverage Revenue and volume forecast, company share, competitive landscape, growth factors and trends

Chapter Outline

  • Chapter 1: Defines the scope of the report and presents an executive summary of market segments (by Type, by Application, by Feature, etc.), including the size of each segment and its future growth potential. It offers a high-level view of the current market and its likely evolution in the short, medium, and long term.
  • Chapter 2: Provides a detailed analysis of the competitive landscape for PE Pipe manufacturers, including prices, production, value-based market shares, latest development plans, and information on mergers and acquisitions.
  • Chapter 3: Examines PE Pipe production/output and value by region and country, providing a quantitative assessment of market size and growth potential for each region over the next six years.
  • Chapter 4: Analyzes PE Pipe consumption at the regional and country levels. It quantifies market size and growth potential for each region and its key countries, and outlines market development, outlook, addressable space, and national production.
  • Chapter 5: Analyzes market segments by Type, covering the size and growth potential of each segment to help readers identify “blue ocean” opportunities.
  • Chapter 6: Analyzes market segments by Application, covering the size and growth potential of each segment to help readers identify “blue ocean” opportunities in downstream markets.
  • Chapter 7: Profiles key players, detailing the fundamentals of major companies, including product production/output, value, price, gross margin, product portfolio/introductions, and recent developments.
  • Chapter 8: Reviews the industry value chain, including upstream and downstream segments.
  • Chapter 9: Discusses market dynamics and recent developments, including drivers, restraints, challenges and risks for manufacturers, U.S. Tariffs and relevant policy analysis.
  • Chapter 10: Summarizes the key findings and conclusions of the report.

FAQ for this report

How fast is PE Pipe Market growing?

Ans: The PE Pipe Market witnessing a CAGR of 3.9% during the forecast period 2026-2032.

What is the PE Pipe Market size in 2032?

Ans: The PE Pipe Market size in 2032 will be US$ 40447 million.

Who are the main players in the PE Pipe Market report?

Ans: The main players in the PE Pipe Market are JM Eagle, Chevron Phillips Chemical, WL Plastics Corporation, GPS PE Pipe Systems, System Group, Wavin, Pipelife, Advanced Drainage Systems, Marley Pipe Systems, Fujian Newchoice Pipe, Dura-Line, Hsiung Yeu Enterprise, Blue Diamond Industries, Sekisui Chemical, Nan Ya Plastics Corporation, Kubota-C.I., Tessenderlo Group, Vinidex Pty, Plastic Industries, Cromford Pipe, Sangir Plastics, Shree Darshan Pipes, China Lesso Group, Weixing New Materials, Cangzhou Mingzhu Plastic, Ginde Plastic Pipe Industry, Kangtai Pipe Industry, Chinaust Group, Junxing Pipe Industry, Shandong Shenbon Plastics, Yonggao, Zhejiang Fengye, Goody Technology, Tianjin Botong Plastics, Wuhan Kingbull, Hongyue Plastics, Fujian Aron

What are the Application segmentation covered in the PE Pipe Market report?

Ans: The Applications covered in the PE Pipe Market report are Water Supply Pipe, Sewage & Drainage Pipe, Oil & Gas Pipe, Agriculture Pipe, Others

What are the Type segmentation covered in the PE Pipe Market report?

Ans: The Types covered in the PE Pipe Market report are HDPE (High-Density Polyethylene) Pipe, MDPE (Medium -Density Polyethylene) Pipe, LDPE (Low-Density Polyethylene) Pipe

1 PE Pipe Market Overview
1.1 Product Definition
1.2 PE Pipe by Type
1.2.1 Global PE Pipe Market Value Growth Rate Analysis by Type: 2025 vs 2032
1.2.2 HDPE (High-Density Polyethylene) Pipe
1.2.3 MDPE (Medium -Density Polyethylene) Pipe
1.2.4 LDPE (Low-Density Polyethylene) Pipe
1.3 PE Pipe by Feature
1.3.1 Global PE Pipe Market Value Growth Rate Analysis by Feature: 2025 vs 2032
1.3.2 Solid Wall Pipe
1.3.3 Corrugated Pipe
1.3.4 Perforated Pipe
1.3.5 Other
1.4 PE Pipe by Channel
1.4.1 Global PE Pipe Market Value Growth Rate Analysis by Channel: 2025 vs 2032
1.4.2 Direct Selling
1.4.3 Distribution
1.5 PE Pipe by Application
1.5.1 Global PE Pipe Market Value Growth Rate Analysis by Application: 2025 vs 2032
1.5.2 Water Supply Pipe
1.5.3 Sewage & Drainage Pipe
1.5.4 Oil & Gas Pipe
1.5.5 Agriculture Pipe
1.5.6 Others
1.6 Global Market Growth Prospects
1.6.1 Global PE Pipe Production Value Estimates and Forecasts (2021–2032)
1.6.2 Global PE Pipe Production Capacity Estimates and Forecasts (2021–2032)
1.6.3 Global PE Pipe Production Estimates and Forecasts (2021–2032)
1.6.4 Global PE Pipe Market Average Price Estimates and Forecasts (2021–2032)
1.7 Assumptions and Limitations
2 Market Competition by Manufacturers
2.1 Global PE Pipe Production Market Share by Manufacturers (2021–2026)
2.2 Global PE Pipe Production Value Market Share by Manufacturers (2021–2026)
2.3 Global Key Players of PE Pipe, Industry Ranking, 2024 vs 2025
2.4 Global PE Pipe Market Share by Company Tier (Tier 1, Tier 2, Tier 3)
2.5 Global PE Pipe Average Price by Manufacturers (2021–2026)
2.6 Global Key Manufacturers of PE Pipe, Manufacturing Footprints and Headquarters
2.7 Global Key Manufacturers of PE Pipe, Product Offerings and Applications
2.8 Global Key Manufacturers of PE Pipe, Date of Entry into the Industry
2.9 PE Pipe Market Competitive Situation and Trends
2.9.1 PE Pipe Market Concentration Rate
2.9.2 Top 5 and Top 10 Global PE Pipe Players Market Share by Revenue
2.10 Mergers & Acquisitions and Expansion
3 PE Pipe Production by Region
3.1 Global PE Pipe Production Value Estimates and Forecasts by Region: 2021 vs 2025 vs 2032
3.2 Global PE Pipe Production Value by Region (2021–2032)
3.2.1 Global PE Pipe Production Value by Region (2021–2026)
3.2.2 Global Forecasted Production Value of PE Pipe by Region (2027–2032)
3.3 Global PE Pipe Production Estimates and Forecasts by Region: 2021 vs 2025 vs 2032
3.4 Global PE Pipe Production Volume by Region (2021–2032)
3.4.1 Global PE Pipe Production by Region (2021–2026)
3.4.2 Global Forecasted Production of PE Pipe by Region (2027–2032)
3.5 Global PE Pipe Market Price Analysis by Region (2021–2026)
3.6 Global PE Pipe Production, Value, and Year-over-Year Growth
3.6.1 North America PE Pipe Production Value Estimates and Forecasts (2021–2032)
3.6.2 Europe PE Pipe Production Value Estimates and Forecasts (2021–2032)
3.6.3 Middle East & Africa PE Pipe Production Value Estimates and Forecasts (2021–2032)
3.6.4 Japan PE Pipe Production Value Estimates and Forecasts (2021–2032)
3.6.5 China PE Pipe Production Value Estimates and Forecasts (2021–2032)
3.6.6 China Taiwan PE Pipe Production Value Estimates and Forecasts (2021–2032)
3.6.7 South Korea PE Pipe Production Value Estimates and Forecasts (2021–2032)
3.6.8 India PE Pipe Production Value Estimates and Forecasts (2021–2032)
3.6.9 Australia PE Pipe Production Value Estimates and Forecasts (2021–2032)
4 PE Pipe Consumption by Region
4.1 Global PE Pipe Consumption Estimates and Forecasts by Region: 2021 vs 2025 vs 2032
4.2 Global PE Pipe Consumption by Region (2021–2032)
4.2.1 Global PE Pipe Consumption by Region (2021–2026)
4.2.2 Global PE Pipe Forecasted Consumption by Region (2027–2032)
4.3 North America
4.3.1 North America PE Pipe Consumption Growth Rate by Country: 2021 vs 2025 vs 2032
4.3.2 North America PE Pipe Consumption by Country (2021–2032)
4.3.3 U.S.
4.3.4 Canada
4.4 Europe
4.4.1 Europe PE Pipe Consumption Growth Rate by Country: 2021 vs 2025 vs 2032
4.4.2 Europe PE Pipe Consumption by Country (2021–2032)
4.4.3 Germany
4.4.4 France
4.4.5 U.K.
4.4.6 Italy
4.4.7 Russia
4.5 Asia Pacific
4.5.1 Asia Pacific PE Pipe Consumption Growth Rate by Region: 2021 vs 2025 vs 2032
4.5.2 Asia Pacific PE Pipe Consumption by Region (2021–2032)
4.5.3 China
4.5.4 Japan
4.5.5 South Korea
4.5.6 China Taiwan
4.5.7 Southeast Asia
4.5.8 India
4.6 Latin America, Middle East & Africa
4.6.1 Latin America, Middle East & Africa PE Pipe Consumption Growth Rate by Country: 2021 vs 2025 vs 2032
4.6.2 Latin America, Middle East & Africa PE Pipe Consumption by Country (2021–2032)
4.6.3 Mexico
4.6.4 Brazil
4.6.5 Turkey
4.6.6 GCC Countries
5 Segment by Type
5.1 Global PE Pipe Production by Type (2021–2032)
5.1.1 Global PE Pipe Production by Type (2021–2026)
5.1.2 Global PE Pipe Production by Type (2027–2032)
5.1.3 Global PE Pipe Production Market Share by Type (2021–2032)
5.2 Global PE Pipe Production Value by Type (2021–2032)
5.2.1 Global PE Pipe Production Value by Type (2021–2026)
5.2.2 Global PE Pipe Production Value by Type (2027–2032)
5.2.3 Global PE Pipe Production Value Market Share by Type (2021–2032)
5.3 Global PE Pipe Price by Type (2021–2032)
6 Segment by Application
6.1 Global PE Pipe Production by Application (2021–2032)
6.1.1 Global PE Pipe Production by Application (2021–2026)
6.1.2 Global PE Pipe Production by Application (2027–2032)
6.1.3 Global PE Pipe Production Market Share by Application (2021–2032)
6.2 Global PE Pipe Production Value by Application (2021–2032)
6.2.1 Global PE Pipe Production Value by Application (2021–2026)
6.2.2 Global PE Pipe Production Value by Application (2027–2032)
6.2.3 Global PE Pipe Production Value Market Share by Application (2021–2032)
6.3 Global PE Pipe Price by Application (2021–2032)
7 Key Companies Profiled
7.1 JM Eagle
7.1.1 JM Eagle PE Pipe Company Information
7.1.2 JM Eagle PE Pipe Product Portfolio
7.1.3 JM Eagle PE Pipe Production, Value, Price, and Gross Margin (2021–2026)
7.1.4 JM Eagle Main Business and Markets Served
7.1.5 JM Eagle Recent Developments/Updates
7.2 Chevron Phillips Chemical
7.2.1 Chevron Phillips Chemical PE Pipe Company Information
7.2.2 Chevron Phillips Chemical PE Pipe Product Portfolio
7.2.3 Chevron Phillips Chemical PE Pipe Production, Value, Price, and Gross Margin (2021–2026)
7.2.4 Chevron Phillips Chemical Main Business and Markets Served
7.2.5 Chevron Phillips Chemical Recent Developments/Updates
7.3 WL Plastics Corporation
7.3.1 WL Plastics Corporation PE Pipe Company Information
7.3.2 WL Plastics Corporation PE Pipe Product Portfolio
7.3.3 WL Plastics Corporation PE Pipe Production, Value, Price, and Gross Margin (2021–2026)
7.3.4 WL Plastics Corporation Main Business and Markets Served
7.3.5 WL Plastics Corporation Recent Developments/Updates
7.4 GPS PE Pipe Systems
7.4.1 GPS PE Pipe Systems PE Pipe Company Information
7.4.2 GPS PE Pipe Systems PE Pipe Product Portfolio
7.4.3 GPS PE Pipe Systems PE Pipe Production, Value, Price, and Gross Margin (2021–2026)
7.4.4 GPS PE Pipe Systems Main Business and Markets Served
7.4.5 GPS PE Pipe Systems Recent Developments/Updates
7.5 System Group
7.5.1 System Group PE Pipe Company Information
7.5.2 System Group PE Pipe Product Portfolio
7.5.3 System Group PE Pipe Production, Value, Price, and Gross Margin (2021–2026)
7.5.4 System Group Main Business and Markets Served
7.5.5 System Group Recent Developments/Updates
7.6 Wavin
7.6.1 Wavin PE Pipe Company Information
7.6.2 Wavin PE Pipe Product Portfolio
7.6.3 Wavin PE Pipe Production, Value, Price, and Gross Margin (2021–2026)
7.6.4 Wavin Main Business and Markets Served
7.6.5 Wavin Recent Developments/Updates
7.7 Pipelife
7.7.1 Pipelife PE Pipe Company Information
7.7.2 Pipelife PE Pipe Product Portfolio
7.7.3 Pipelife PE Pipe Production, Value, Price, and Gross Margin (2021–2026)
7.7.4 Pipelife Main Business and Markets Served
7.7.5 Pipelife Recent Developments/Updates
7.8 Advanced Drainage Systems
7.8.1 Advanced Drainage Systems PE Pipe Company Information
7.8.2 Advanced Drainage Systems PE Pipe Product Portfolio
7.8.3 Advanced Drainage Systems PE Pipe Production, Value, Price, and Gross Margin (2021–2026)
7.8.4 Advanced Drainage Systems Main Business and Markets Served
7.8.5 Advanced Drainage Systems Recent Developments/Updates
7.9 Marley Pipe Systems
7.9.1 Marley Pipe Systems PE Pipe Company Information
7.9.2 Marley Pipe Systems PE Pipe Product Portfolio
7.9.3 Marley Pipe Systems PE Pipe Production, Value, Price, and Gross Margin (2021–2026)
7.9.4 Marley Pipe Systems Main Business and Markets Served
7.9.5 Marley Pipe Systems Recent Developments/Updates
7.10 Fujian Newchoice Pipe
7.10.1 Fujian Newchoice Pipe PE Pipe Company Information
7.10.2 Fujian Newchoice Pipe PE Pipe Product Portfolio
7.10.3 Fujian Newchoice Pipe PE Pipe Production, Value, Price, and Gross Margin (2021–2026)
7.10.4 Fujian Newchoice Pipe Main Business and Markets Served
7.10.5 Fujian Newchoice Pipe Recent Developments/Updates
7.11 Dura-Line
7.11.1 Dura-Line PE Pipe Company Information
7.11.2 Dura-Line PE Pipe Product Portfolio
7.11.3 Dura-Line PE Pipe Production, Value, Price, and Gross Margin (2021–2026)
7.11.4 Dura-Line Main Business and Markets Served
7.11.5 Dura-Line Recent Developments/Updates
7.12 Hsiung Yeu Enterprise
7.12.1 Hsiung Yeu Enterprise PE Pipe Company Information
7.12.2 Hsiung Yeu Enterprise PE Pipe Product Portfolio
7.12.3 Hsiung Yeu Enterprise PE Pipe Production, Value, Price, and Gross Margin (2021–2026)
7.12.4 Hsiung Yeu Enterprise Main Business and Markets Served
7.12.5 Hsiung Yeu Enterprise Recent Developments/Updates
7.13 Blue Diamond Industries
7.13.1 Blue Diamond Industries PE Pipe Company Information
7.13.2 Blue Diamond Industries PE Pipe Product Portfolio
7.13.3 Blue Diamond Industries PE Pipe Production, Value, Price, and Gross Margin (2021–2026)
7.13.4 Blue Diamond Industries Main Business and Markets Served
7.13.5 Blue Diamond Industries Recent Developments/Updates
7.14 Sekisui Chemical
7.14.1 Sekisui Chemical PE Pipe Company Information
7.14.2 Sekisui Chemical PE Pipe Product Portfolio
7.14.3 Sekisui Chemical PE Pipe Production, Value, Price, and Gross Margin (2021–2026)
7.14.4 Sekisui Chemical Main Business and Markets Served
7.14.5 Sekisui Chemical Recent Developments/Updates
7.15 Nan Ya Plastics Corporation
7.15.1 Nan Ya Plastics Corporation PE Pipe Company Information
7.15.2 Nan Ya Plastics Corporation PE Pipe Product Portfolio
7.15.3 Nan Ya Plastics Corporation PE Pipe Production, Value, Price, and Gross Margin (2021–2026)
7.15.4 Nan Ya Plastics Corporation Main Business and Markets Served
7.15.5 Nan Ya Plastics Corporation Recent Developments/Updates
7.16 Kubota-C.I.
7.16.1 Kubota-C.I. PE Pipe Company Information
7.16.2 Kubota-C.I. PE Pipe Product Portfolio
7.16.3 Kubota-C.I. PE Pipe Production, Value, Price, and Gross Margin (2021–2026)
7.16.4 Kubota-C.I. Main Business and Markets Served
7.16.5 Kubota-C.I. Recent Developments/Updates
7.17 Tessenderlo Group
7.17.1 Tessenderlo Group PE Pipe Company Information
7.17.2 Tessenderlo Group PE Pipe Product Portfolio
7.17.3 Tessenderlo Group PE Pipe Production, Value, Price, and Gross Margin (2021–2026)
7.17.4 Tessenderlo Group Main Business and Markets Served
7.17.5 Tessenderlo Group Recent Developments/Updates
7.18 Vinidex Pty
7.18.1 Vinidex Pty PE Pipe Company Information
7.18.2 Vinidex Pty PE Pipe Product Portfolio
7.18.3 Vinidex Pty PE Pipe Production, Value, Price, and Gross Margin (2021–2026)
7.18.4 Vinidex Pty Main Business and Markets Served
7.18.5 Vinidex Pty Recent Developments/Updates
7.19 Plastic Industries
7.19.1 Plastic Industries PE Pipe Company Information
7.19.2 Plastic Industries PE Pipe Product Portfolio
7.19.3 Plastic Industries PE Pipe Production, Value, Price, and Gross Margin (2021–2026)
7.19.4 Plastic Industries Main Business and Markets Served
7.19.5 Plastic Industries Recent Developments/Updates
7.20 Cromford Pipe
7.20.1 Cromford Pipe PE Pipe Company Information
7.20.2 Cromford Pipe PE Pipe Product Portfolio
7.20.3 Cromford Pipe PE Pipe Production, Value, Price, and Gross Margin (2021–2026)
7.20.4 Cromford Pipe Main Business and Markets Served
7.20.5 Cromford Pipe Recent Developments/Updates
7.21 Sangir Plastics
7.21.1 Sangir Plastics PE Pipe Company Information
7.21.2 Sangir Plastics PE Pipe Product Portfolio
7.21.3 Sangir Plastics PE Pipe Production, Value, Price, and Gross Margin (2021–2026)
7.21.4 Sangir Plastics Main Business and Markets Served
7.21.5 Sangir Plastics Recent Developments/Updates
7.22 Shree Darshan Pipes
7.22.1 Shree Darshan Pipes PE Pipe Company Information
7.22.2 Shree Darshan Pipes PE Pipe Product Portfolio
7.22.3 Shree Darshan Pipes PE Pipe Production, Value, Price, and Gross Margin (2021–2026)
7.22.4 Shree Darshan Pipes Main Business and Markets Served
7.22.5 Shree Darshan Pipes Recent Developments/Updates
7.23 China Lesso Group
7.23.1 China Lesso Group PE Pipe Company Information
7.23.2 China Lesso Group PE Pipe Product Portfolio
7.23.3 China Lesso Group PE Pipe Production, Value, Price, and Gross Margin (2021–2026)
7.23.4 China Lesso Group Main Business and Markets Served
7.23.5 China Lesso Group Recent Developments/Updates
7.24 Weixing New Materials
7.24.1 Weixing New Materials PE Pipe Company Information
7.24.2 Weixing New Materials PE Pipe Product Portfolio
7.24.3 Weixing New Materials PE Pipe Production, Value, Price, and Gross Margin (2021–2026)
7.24.4 Weixing New Materials Main Business and Markets Served
7.24.5 Weixing New Materials Recent Developments/Updates
7.25 Fujian Newchoice Pipe
7.25.1 Fujian Newchoice Pipe PE Pipe Company Information
7.25.2 Fujian Newchoice Pipe PE Pipe Product Portfolio
7.25.3 Fujian Newchoice Pipe PE Pipe Production, Value, Price, and Gross Margin (2021–2026)
7.25.4 Fujian Newchoice Pipe Main Business and Markets Served
7.25.5 Fujian Newchoice Pipe Recent Developments/Updates
7.26 Cangzhou Mingzhu Plastic
7.26.1 Cangzhou Mingzhu Plastic PE Pipe Company Information
7.26.2 Cangzhou Mingzhu Plastic PE Pipe Product Portfolio
7.26.3 Cangzhou Mingzhu Plastic PE Pipe Production, Value, Price, and Gross Margin (2021–2026)
7.26.4 Cangzhou Mingzhu Plastic Main Business and Markets Served
7.26.5 Cangzhou Mingzhu Plastic Recent Developments/Updates
7.27 Ginde Plastic Pipe Industry
7.27.1 Ginde Plastic Pipe Industry PE Pipe Company Information
7.27.2 Ginde Plastic Pipe Industry PE Pipe Product Portfolio
7.27.3 Ginde Plastic Pipe Industry PE Pipe Production, Value, Price, and Gross Margin (2021–2026)
7.27.4 Ginde Plastic Pipe Industry Main Business and Markets Served
7.27.5 Ginde Plastic Pipe Industry Recent Developments/Updates
7.28 Kangtai Pipe Industry
7.28.1 Kangtai Pipe Industry PE Pipe Company Information
7.28.2 Kangtai Pipe Industry PE Pipe Product Portfolio
7.28.3 Kangtai Pipe Industry PE Pipe Production, Value, Price, and Gross Margin (2021–2026)
7.28.4 Kangtai Pipe Industry Main Business and Markets Served
7.28.5 Kangtai Pipe Industry Recent Developments/Updates
7.29 Chinaust Group
7.29.1 Chinaust Group PE Pipe Company Information
7.29.2 Chinaust Group PE Pipe Product Portfolio
7.29.3 Chinaust Group PE Pipe Production, Value, Price, and Gross Margin (2021–2026)
7.29.4 Chinaust Group Main Business and Markets Served
7.29.5 Chinaust Group Recent Developments/Updates
7.30 Junxing Pipe Industry
7.30.1 Junxing Pipe Industry PE Pipe Company Information
7.30.2 Junxing Pipe Industry PE Pipe Product Portfolio
7.30.3 Junxing Pipe Industry PE Pipe Production, Value, Price, and Gross Margin (2021–2026)
7.30.4 Junxing Pipe Industry Main Business and Markets Served
7.30.5 Junxing Pipe Industry Recent Developments/Updates
7.31 Shandong Shenbon Plastics
7.31.1 Shandong Shenbon Plastics PE Pipe Company Information
7.31.2 Shandong Shenbon Plastics PE Pipe Product Portfolio
7.31.3 Shandong Shenbon Plastics PE Pipe Production, Value, Price, and Gross Margin (2021–2026)
7.31.4 Shandong Shenbon Plastics Main Business and Markets Served
7.31.5 Shandong Shenbon Plastics Recent Developments/Updates
7.32 Yonggao
7.32.1 Yonggao PE Pipe Company Information
7.32.2 Yonggao PE Pipe Product Portfolio
7.32.3 Yonggao PE Pipe Production, Value, Price, and Gross Margin (2021–2026)
7.32.4 Yonggao Main Business and Markets Served
7.32.5 Yonggao Recent Developments/Updates
7.33 Zhejiang Fengye
7.33.1 Zhejiang Fengye PE Pipe Company Information
7.33.2 Zhejiang Fengye PE Pipe Product Portfolio
7.33.3 Zhejiang Fengye PE Pipe Production, Value, Price, and Gross Margin (2021–2026)
7.33.4 Zhejiang Fengye Main Business and Markets Served
7.33.5 Zhejiang Fengye Recent Developments/Updates
7.34 Goody Technology
7.34.1 Goody Technology PE Pipe Company Information
7.34.2 Goody Technology PE Pipe Product Portfolio
7.34.3 Goody Technology PE Pipe Production, Value, Price, and Gross Margin (2021–2026)
7.34.4 Goody Technology Main Business and Markets Served
7.34.5 Goody Technology Recent Developments/Updates
7.35 Tianjin Botong Plastics
7.35.1 Tianjin Botong Plastics PE Pipe Company Information
7.35.2 Tianjin Botong Plastics PE Pipe Product Portfolio
7.35.3 Tianjin Botong Plastics PE Pipe Production, Value, Price, and Gross Margin (2021–2026)
7.35.4 Tianjin Botong Plastics Main Business and Markets Served
7.35.5 Tianjin Botong Plastics Recent Developments/Updates
7.36 Wuhan Kingbull
7.36.1 Wuhan Kingbull PE Pipe Company Information
7.36.2 Wuhan Kingbull PE Pipe Product Portfolio
7.36.3 Wuhan Kingbull PE Pipe Production, Value, Price, and Gross Margin (2021–2026)
7.36.4 Wuhan Kingbull Main Business and Markets Served
7.36.5 Wuhan Kingbull Recent Developments/Updates
7.37 Hongyue Plastics
7.37.1 Hongyue Plastics PE Pipe Company Information
7.37.2 Hongyue Plastics PE Pipe Product Portfolio
7.37.3 Hongyue Plastics PE Pipe Production, Value, Price, and Gross Margin (2021–2026)
7.37.4 Hongyue Plastics Main Business and Markets Served
7.37.5 Hongyue Plastics Recent Developments/Updates
7.38 Fujian Aron
7.38.1 Fujian Aron PE Pipe Company Information
7.38.2 Fujian Aron PE Pipe Product Portfolio
7.38.3 Fujian Aron PE Pipe Production, Value, Price, and Gross Margin (2021–2026)
7.38.4 Fujian Aron Main Business and Markets Served
7.38.5 Fujian Aron Recent Developments/Updates
8 Industry Chain and Sales Channels Analysis
8.1 PE Pipe Industry Chain Analysis
8.2 PE Pipe Raw Material Supply Analysis
8.2.1 Key Raw Materials
8.2.2 Raw Materials Key Suppliers
8.3 PE Pipe Production Modes and Processes
8.4 PE Pipe Sales and Marketing
8.4.1 PE Pipe Sales Channels
8.4.2 PE Pipe Distributors
8.5 PE Pipe Customer Analysis
9 PE Pipe Market Dynamics
9.1 PE Pipe Industry Trends
9.2 PE Pipe Market Drivers
9.3 PE Pipe Market Challenges
9.4 PE Pipe Market Restraints
9.5 Impact of U.S. Tariffs
10 Research Findings and Conclusion
11 Methodology and Data Source
11.1 Methodology/Research Approach
11.1.1 Research Programs/Design
11.1.2 Market Size Estimation
11.1.3 Market Breakdown and Data Triangulation
11.2 Data Source
11.2.1 Secondary Sources
11.2.2 Primary Sources
11.3 Author List
11.4 Disclaimer
List of Tables
 Table 1. Global PE Pipe Market Value by Type (US$ Million), 2025 vs 2032
 Table 2. Global PE Pipe Market Value by Feature (US$ Million), 2025 vs 2032
 Table 3. Global PE Pipe Market Value by Channel (US$ Million), 2025 vs 2032
 Table 4. Global PE Pipe Market Value by Application (US$ Million), 2025 vs 2032
 Table 5. Global PE Pipe Production Capacity (K MT) by Manufacturers in 2025
 Table 6. Global PE Pipe Production by Manufacturers (K MT), 2021–2026
 Table 7. Global PE Pipe Production Market Share by Manufacturers (2021–2026)
 Table 8. Global PE Pipe Production Value by Manufacturers (US$ Million), 2021–2026
 Table 9. Global PE Pipe Production Value Share by Manufacturers (2021–2026)
 Table 10. Global Key Players of PE Pipe, Industry Ranking, 2024 vs 2025
 Table 11. Classification of Companies by Tier (Tier 1, Tier 2, Tier 3), based on PE Pipe Production Value, 2025
 Table 12. Global Market PE Pipe Average Price by Manufacturers (USD/MT), 2021–2026
 Table 13. Global Key Manufacturers of PE Pipe, Manufacturing Footprints and Headquarters
 Table 14. Global Key Manufacturers of PE Pipe, Product Offerings and Applications
 Table 15. Global Key Manufacturers of PE Pipe, Date of Entry into the Industry
 Table 16. Global PE Pipe Manufacturers Market Concentration Ratio (CR5 and HHI)
 Table 17. Mergers & Acquisitions and Expansion Plans
 Table 18. Global PE Pipe Production Value by Region: 2021 vs 2025 vs 2032 (US$ Million)
 Table 19. Global PE Pipe Production Value (US$ Million) by Region (2021–2026)
 Table 20. Global PE Pipe Production Value Market Share by Region (2021–2026)
 Table 21. Global PE Pipe Production Value (US$ Million) Forecast by Region (2027–2032)
 Table 22. Global PE Pipe Production Value Market Share Forecast by Region (2027–2032)
 Table 23. Global PE Pipe Production Comparison by Region: 2021 vs 2025 vs 2032 (K MT)
 Table 24. Global PE Pipe Production (K MT) by Region (2021–2026)
 Table 25. Global PE Pipe Production Market Share by Region (2021–2026)
 Table 26. Global PE Pipe Production (K MT) Forecast by Region (2027–2032)
 Table 27. Global PE Pipe Production Market Share Forecast by Region (2027–2032)
 Table 28. Global PE Pipe Market Average Price (USD/MT) by Region (2021–2026)
 Table 29. Global PE Pipe Market Average Price (USD/MT) by Region (2027–2032)
 Table 30. Global PE Pipe Consumption Growth Rate by Region: 2021 vs 2025 vs 2032 (K MT)
 Table 31. Global PE Pipe Consumption by Region (K MT), 2021–2026
 Table 32. Global PE Pipe Consumption Market Share by Region (2021–2026)
 Table 33. Global PE Pipe Forecasted Consumption by Region (K MT), 2027–2032
 Table 34. Global PE Pipe Forecasted Consumption Market Share by Region (2027–2032)
 Table 35. North America PE Pipe Consumption Growth Rate by Country: 2021 vs 2025 vs 2032 (K MT)
 Table 36. North America PE Pipe Consumption by Country (K MT), 2021–2026
 Table 37. North America PE Pipe Consumption by Country (K MT), 2027–2032
 Table 38. Europe PE Pipe Consumption Growth Rate by Country: 2021 vs 2025 vs 2032 (K MT)
 Table 39. Europe PE Pipe Consumption by Country (K MT), 2021–2026
 Table 40. Europe PE Pipe Consumption by Country (K MT), 2027–2032
 Table 41. Asia Pacific PE Pipe Consumption Growth Rate by Region: 2021 vs 2025 vs 2032 (K MT)
 Table 42. Asia Pacific PE Pipe Consumption by Region (K MT), 2021–2026
 Table 43. Asia Pacific PE Pipe Consumption by Region (K MT), 2027–2032
 Table 44. Latin America, Middle East & Africa PE Pipe Consumption Growth Rate by Country: 2021 vs 2025 vs 2032 (K MT)
 Table 45. Latin America, Middle East & Africa PE Pipe Consumption by Country (K MT), 2021–2026
 Table 46. Latin America, Middle East & Africa PE Pipe Consumption by Country (K MT), 2027–2032
 Table 47. Global PE Pipe Production (K MT) by Type (2021–2026)
 Table 48. Global PE Pipe Production (K MT) by Type (2027–2032)
 Table 49. Global PE Pipe Production Market Share by Type (2021–2026)
 Table 50. Global PE Pipe Production Market Share by Type (2027–2032)
 Table 51. Global PE Pipe Production Value (US$ Million) by Type (2021–2026)
 Table 52. Global PE Pipe Production Value (US$ Million) by Type (2027–2032)
 Table 53. Global PE Pipe Production Value Market Share by Type (2021–2026)
 Table 54. Global PE Pipe Production Value Market Share by Type (2027–2032)
 Table 55. Global PE Pipe Price (USD/MT) by Type (2021–2026)
 Table 56. Global PE Pipe Price (USD/MT) by Type (2027–2032)
 Table 57. Global PE Pipe Production (K MT) by Application (2021–2026)
 Table 58. Global PE Pipe Production (K MT) by Application (2027–2032)
 Table 59. Global PE Pipe Production Market Share by Application (2021–2026)
 Table 60. Global PE Pipe Production Market Share by Application (2027–2032)
 Table 61. Global PE Pipe Production Value (US$ Million) by Application (2021–2026)
 Table 62. Global PE Pipe Production Value (US$ Million) by Application (2027–2032)
 Table 63. Global PE Pipe Production Value Market Share by Application (2021–2026)
 Table 64. Global PE Pipe Production Value Market Share by Application (2027–2032)
 Table 65. Global PE Pipe Price (USD/MT) by Application (2021–2026)
 Table 66. Global PE Pipe Price (USD/MT) by Application (2027–2032)
 Table 67. JM Eagle PE Pipe Company Information
 Table 68. JM Eagle PE Pipe Specification and Application
 Table 69. JM Eagle PE Pipe Production (K MT), Value (US$ Million), Price (USD/MT) and Gross Margin (2021–2026)
 Table 70. JM Eagle Main Business and Markets Served
 Table 71. JM Eagle Recent Developments/Updates
 Table 72. Chevron Phillips Chemical PE Pipe Company Information
 Table 73. Chevron Phillips Chemical PE Pipe Specification and Application
 Table 74. Chevron Phillips Chemical PE Pipe Production (K MT), Value (US$ Million), Price (USD/MT) and Gross Margin (2021–2026)
 Table 75. Chevron Phillips Chemical Main Business and Markets Served
 Table 76. Chevron Phillips Chemical Recent Developments/Updates
 Table 77. WL Plastics Corporation PE Pipe Company Information
 Table 78. WL Plastics Corporation PE Pipe Specification and Application
 Table 79. WL Plastics Corporation PE Pipe Production (K MT), Value (US$ Million), Price (USD/MT) and Gross Margin (2021–2026)
 Table 80. WL Plastics Corporation Main Business and Markets Served
 Table 81. WL Plastics Corporation Recent Developments/Updates
 Table 82. GPS PE Pipe Systems PE Pipe Company Information
 Table 83. GPS PE Pipe Systems PE Pipe Specification and Application
 Table 84. GPS PE Pipe Systems PE Pipe Production (K MT), Value (US$ Million), Price (USD/MT) and Gross Margin (2021–2026)
 Table 85. GPS PE Pipe Systems Main Business and Markets Served
 Table 86. GPS PE Pipe Systems Recent Developments/Updates
 Table 87. System Group PE Pipe Company Information
 Table 88. System Group PE Pipe Specification and Application
 Table 89. System Group PE Pipe Production (K MT), Value (US$ Million), Price (USD/MT) and Gross Margin (2021–2026)
 Table 90. System Group Main Business and Markets Served
 Table 91. System Group Recent Developments/Updates
 Table 92. Wavin PE Pipe Company Information
 Table 93. Wavin PE Pipe Specification and Application
 Table 94. Wavin PE Pipe Production (K MT), Value (US$ Million), Price (USD/MT) and Gross Margin (2021–2026)
 Table 95. Wavin Main Business and Markets Served
 Table 96. Wavin Recent Developments/Updates
 Table 97. Pipelife PE Pipe Company Information
 Table 98. Pipelife PE Pipe Specification and Application
 Table 99. Pipelife PE Pipe Production (K MT), Value (US$ Million), Price (USD/MT) and Gross Margin (2021–2026)
 Table 100. Pipelife Main Business and Markets Served
 Table 101. Pipelife Recent Developments/Updates
 Table 102. Advanced Drainage Systems PE Pipe Company Information
 Table 103. Advanced Drainage Systems PE Pipe Specification and Application
 Table 104. Advanced Drainage Systems PE Pipe Production (K MT), Value (US$ Million), Price (USD/MT) and Gross Margin (2021–2026)
 Table 105. Advanced Drainage Systems Main Business and Markets Served
 Table 106. Advanced Drainage Systems Recent Developments/Updates
 Table 107. Marley Pipe Systems PE Pipe Company Information
 Table 108. Marley Pipe Systems PE Pipe Specification and Application
 Table 109. Marley Pipe Systems PE Pipe Production (K MT), Value (US$ Million), Price (USD/MT) and Gross Margin (2021–2026)
 Table 110. Marley Pipe Systems Main Business and Markets Served
 Table 111. Marley Pipe Systems Recent Developments/Updates
 Table 112. Fujian Newchoice Pipe PE Pipe Company Information
 Table 113. Fujian Newchoice Pipe PE Pipe Specification and Application
 Table 114. Fujian Newchoice Pipe PE Pipe Production (K MT), Value (US$ Million), Price (USD/MT) and Gross Margin (2021–2026)
 Table 115. Fujian Newchoice Pipe Main Business and Markets Served
 Table 116. Fujian Newchoice Pipe Recent Developments/Updates
 Table 117. Dura-Line PE Pipe Company Information
 Table 118. Dura-Line PE Pipe Specification and Application
 Table 119. Dura-Line PE Pipe Production (K MT), Value (US$ Million), Price (USD/MT) and Gross Margin (2021–2026)
 Table 120. Dura-Line Main Business and Markets Served
 Table 121. Dura-Line Recent Developments/Updates
 Table 122. Hsiung Yeu Enterprise PE Pipe Company Information
 Table 123. Hsiung Yeu Enterprise PE Pipe Specification and Application
 Table 124. Hsiung Yeu Enterprise PE Pipe Production (K MT), Value (US$ Million), Price (USD/MT) and Gross Margin (2021–2026)
 Table 125. Hsiung Yeu Enterprise Main Business and Markets Served
 Table 126. Hsiung Yeu Enterprise Recent Developments/Updates
 Table 127. Blue Diamond Industries PE Pipe Company Information
 Table 128. Blue Diamond Industries PE Pipe Specification and Application
 Table 129. Blue Diamond Industries PE Pipe Production (K MT), Value (US$ Million), Price (USD/MT) and Gross Margin (2021–2026)
 Table 130. Blue Diamond Industries Main Business and Markets Served
 Table 131. Blue Diamond Industries Recent Developments/Updates
 Table 132. Sekisui Chemical PE Pipe Company Information
 Table 133. Sekisui Chemical PE Pipe Specification and Application
 Table 134. Sekisui Chemical PE Pipe Production (K MT), Value (US$ Million), Price (USD/MT) and Gross Margin (2021–2026)
 Table 135. Sekisui Chemical Main Business and Markets Served
 Table 136. Sekisui Chemical Recent Developments/Updates
 Table 137. Nan Ya Plastics Corporation PE Pipe Company Information
 Table 138. Nan Ya Plastics Corporation PE Pipe Specification and Application
 Table 139. Nan Ya Plastics Corporation PE Pipe Production (K MT), Value (US$ Million), Price (USD/MT) and Gross Margin (2021–2026)
 Table 140. Nan Ya Plastics Corporation Main Business and Markets Served
 Table 141. Nan Ya Plastics Corporation Recent Developments/Updates
 Table 142. Kubota-C.I. PE Pipe Company Information
 Table 143. Kubota-C.I. PE Pipe Specification and Application
 Table 144. Kubota-C.I. PE Pipe Production (K MT), Value (US$ Million), Price (USD/MT) and Gross Margin (2021–2026)
 Table 145. Kubota-C.I. Main Business and Markets Served
 Table 146. Kubota-C.I. Recent Developments/Updates
 Table 147. Tessenderlo Group PE Pipe Company Information
 Table 148. Tessenderlo Group PE Pipe Specification and Application
 Table 149. Tessenderlo Group PE Pipe Production (K MT), Value (US$ Million), Price (USD/MT) and Gross Margin (2021–2026)
 Table 150. Tessenderlo Group Main Business and Markets Served
 Table 151. Tessenderlo Group Recent Developments/Updates
 Table 152. Vinidex Pty PE Pipe Company Information
 Table 153. Vinidex Pty PE Pipe Specification and Application
 Table 154. Vinidex Pty PE Pipe Production (K MT), Value (US$ Million), Price (USD/MT) and Gross Margin (2021–2026)
 Table 155. Vinidex Pty Main Business and Markets Served
 Table 156. Vinidex Pty Recent Developments/Updates
 Table 157. Plastic Industries PE Pipe Company Information
 Table 158. Plastic Industries PE Pipe Specification and Application
 Table 159. Plastic Industries PE Pipe Production (K MT), Value (US$ Million), Price (USD/MT) and Gross Margin (2021–2026)
 Table 160. Plastic Industries Main Business and Markets Served
 Table 161. Plastic Industries Recent Developments/Updates
 Table 162. Cromford Pipe PE Pipe Company Information
 Table 163. Cromford Pipe PE Pipe Specification and Application
 Table 164. Cromford Pipe PE Pipe Production (K MT), Value (US$ Million), Price (USD/MT) and Gross Margin (2021–2026)
 Table 165. Cromford Pipe Main Business and Markets Served
 Table 166. Cromford Pipe Recent Developments/Updates
 Table 167. Sangir Plastics PE Pipe Company Information
 Table 168. Sangir Plastics PE Pipe Specification and Application
 Table 169. Sangir Plastics PE Pipe Production (K MT), Value (US$ Million), Price (USD/MT) and Gross Margin (2021–2026)
 Table 170. Sangir Plastics Main Business and Markets Served
 Table 171. Sangir Plastics Recent Developments/Updates
 Table 172. Shree Darshan Pipes PE Pipe Company Information
 Table 173. Shree Darshan Pipes PE Pipe Specification and Application
 Table 174. Shree Darshan Pipes PE Pipe Production (K MT), Value (US$ Million), Price (USD/MT) and Gross Margin (2021–2026)
 Table 175. Shree Darshan Pipes Main Business and Markets Served
 Table 176. Shree Darshan Pipes Recent Developments/Updates
 Table 177. China Lesso Group PE Pipe Company Information
 Table 178. China Lesso Group PE Pipe Specification and Application
 Table 179. China Lesso Group PE Pipe Production (K MT), Value (US$ Million), Price (USD/MT) and Gross Margin (2021–2026)
 Table 180. China Lesso Group Main Business and Markets Served
 Table 181. China Lesso Group Recent Developments/Updates
 Table 182. Weixing New Materials PE Pipe Company Information
 Table 183. Weixing New Materials PE Pipe Specification and Application
 Table 184. Weixing New Materials PE Pipe Production (K MT), Value (US$ Million), Price (USD/MT) and Gross Margin (2021–2026)
 Table 185. Weixing New Materials Main Business and Markets Served
 Table 186. Weixing New Materials Recent Developments/Updates
 Table 187. Fujian Newchoice Pipe PE Pipe Company Information
 Table 188. Fujian Newchoice Pipe PE Pipe Specification and Application
 Table 189. Fujian Newchoice Pipe PE Pipe Production (K MT), Value (US$ Million), Price (USD/MT) and Gross Margin (2021–2026)
 Table 190. Fujian Newchoice Pipe Main Business and Markets Served
 Table 191. Fujian Newchoice Pipe Recent Developments/Updates
 Table 192. Cangzhou Mingzhu Plastic PE Pipe Company Information
 Table 193. Cangzhou Mingzhu Plastic PE Pipe Specification and Application
 Table 194. Cangzhou Mingzhu Plastic PE Pipe Production (K MT), Value (US$ Million), Price (USD/MT) and Gross Margin (2021–2026)
 Table 195. Cangzhou Mingzhu Plastic Main Business and Markets Served
 Table 196. Cangzhou Mingzhu Plastic Recent Developments/Updates
 Table 197. Ginde Plastic Pipe Industry PE Pipe Company Information
 Table 198. Ginde Plastic Pipe Industry PE Pipe Specification and Application
 Table 199. Ginde Plastic Pipe Industry PE Pipe Production (K MT), Value (US$ Million), Price (USD/MT) and Gross Margin (2021–2026)
 Table 200. Ginde Plastic Pipe Industry Main Business and Markets Served
 Table 201. Ginde Plastic Pipe Industry Recent Developments/Updates
 Table 202. Kangtai Pipe Industry PE Pipe Company Information
 Table 203. Kangtai Pipe Industry PE Pipe Specification and Application
 Table 204. Kangtai Pipe Industry PE Pipe Production (K MT), Value (US$ Million), Price (USD/MT) and Gross Margin (2021–2026)
 Table 205. Kangtai Pipe Industry Main Business and Markets Served
 Table 206. Kangtai Pipe Industry Recent Developments/Updates
 Table 207. Chinaust Group PE Pipe Company Information
 Table 208. Chinaust Group PE Pipe Specification and Application
 Table 209. Chinaust Group PE Pipe Production (K MT), Value (US$ Million), Price (USD/MT) and Gross Margin (2021–2026)
 Table 210. Chinaust Group Main Business and Markets Served
 Table 211. Chinaust Group Recent Developments/Updates
 Table 212. Junxing Pipe Industry PE Pipe Company Information
 Table 213. Junxing Pipe Industry PE Pipe Specification and Application
 Table 214. Junxing Pipe Industry PE Pipe Production (K MT), Value (US$ Million), Price (USD/MT) and Gross Margin (2021–2026)
 Table 215. Junxing Pipe Industry Main Business and Markets Served
 Table 216. Junxing Pipe Industry Recent Developments/Updates
 Table 217. Shandong Shenbon Plastics PE Pipe Company Information
 Table 218. Shandong Shenbon Plastics PE Pipe Specification and Application
 Table 219. Shandong Shenbon Plastics PE Pipe Production (K MT), Value (US$ Million), Price (USD/MT) and Gross Margin (2021–2026)
 Table 220. Shandong Shenbon Plastics Main Business and Markets Served
 Table 221. Shandong Shenbon Plastics Recent Developments/Updates
 Table 222. Yonggao PE Pipe Company Information
 Table 223. Yonggao PE Pipe Specification and Application
 Table 224. Yonggao PE Pipe Production (K MT), Value (US$ Million), Price (USD/MT) and Gross Margin (2021–2026)
 Table 225. Yonggao Main Business and Markets Served
 Table 226. Yonggao Recent Developments/Updates
 Table 227. Zhejiang Fengye PE Pipe Company Information
 Table 228. Zhejiang Fengye PE Pipe Specification and Application
 Table 229. Zhejiang Fengye PE Pipe Production (K MT), Value (US$ Million), Price (USD/MT) and Gross Margin (2021–2026)
 Table 230. Zhejiang Fengye Main Business and Markets Served
 Table 231. Zhejiang Fengye Recent Developments/Updates
 Table 232. Goody Technology PE Pipe Company Information
 Table 233. Goody Technology PE Pipe Specification and Application
 Table 234. Goody Technology PE Pipe Production (K MT), Value (US$ Million), Price (USD/MT) and Gross Margin (2021–2026)
 Table 235. Goody Technology Main Business and Markets Served
 Table 236. Goody Technology Recent Developments/Updates
 Table 237. Tianjin Botong Plastics PE Pipe Company Information
 Table 238. Tianjin Botong Plastics PE Pipe Specification and Application
 Table 239. Tianjin Botong Plastics PE Pipe Production (K MT), Value (US$ Million), Price (USD/MT) and Gross Margin (2021–2026)
 Table 240. Tianjin Botong Plastics Main Business and Markets Served
 Table 241. Tianjin Botong Plastics Recent Developments/Updates
 Table 242. Wuhan Kingbull PE Pipe Company Information
 Table 243. Wuhan Kingbull PE Pipe Specification and Application
 Table 244. Wuhan Kingbull PE Pipe Production (K MT), Value (US$ Million), Price (USD/MT) and Gross Margin (2021–2026)
 Table 245. Wuhan Kingbull Main Business and Markets Served
 Table 246. Wuhan Kingbull Recent Developments/Updates
 Table 247. Hongyue Plastics PE Pipe Company Information
 Table 248. Hongyue Plastics PE Pipe Specification and Application
 Table 249. Hongyue Plastics PE Pipe Production (K MT), Value (US$ Million), Price (USD/MT) and Gross Margin (2021–2026)
 Table 250. Hongyue Plastics Main Business and Markets Served
 Table 251. Hongyue Plastics Recent Developments/Updates
 Table 252. Fujian Aron PE Pipe Company Information
 Table 253. Fujian Aron PE Pipe Specification and Application
 Table 254. Fujian Aron PE Pipe Production (K MT), Value (US$ Million), Price (USD/MT) and Gross Margin (2021–2026)
 Table 255. Fujian Aron Main Business and Markets Served
 Table 256. Fujian Aron Recent Developments/Updates
 Table 257. Key Raw Materials Lists
 Table 258. Raw Materials Key Suppliers Lists
 Table 259. PE Pipe Distributors List
 Table 260. PE Pipe Customers List
 Table 261. PE Pipe Market Trends
 Table 262. PE Pipe Market Drivers
 Table 263. PE Pipe Market Challenges
 Table 264. PE Pipe Market Restraints
 Table 265. Research Programs/Design for This Report
 Table 266. Key Data Information from Secondary Sources
 Table 267. Key Data Information from Primary Sources
 Table 268. Authors List of This Report


List of Figures
 Figure 1. Product Picture of PE Pipe
 Figure 2. Global PE Pipe Market Value by Type (US$ Million), 2021–2032
 Figure 3. Global PE Pipe Market Share by Type: 2025 vs 2032
 Figure 4. HDPE (High-Density Polyethylene) Pipe Product Picture
 Figure 5. MDPE (Medium -Density Polyethylene) Pipe Product Picture
 Figure 6. LDPE (Low-Density Polyethylene) Pipe Product Picture
 Figure 7. Global PE Pipe Market Value by Feature (US$ Million), 2021–2032
 Figure 8. Global PE Pipe Market Share by Feature: 2025 vs 2032
 Figure 9. Solid Wall Pipe Product Picture
 Figure 10. Corrugated Pipe Product Picture
 Figure 11. Perforated Pipe Product Picture
 Figure 12. Other Product Picture
 Figure 13. Global PE Pipe Market Value by Channel (US$ Million), 2021–2032
 Figure 14. Global PE Pipe Market Share by Channel: 2025 vs 2032
 Figure 15. Direct Selling Product Picture
 Figure 16. Distribution Product Picture
 Figure 17. Global PE Pipe Market Value by Application (US$ Million), 2021–2032
 Figure 18. Global PE Pipe Market Share by Application: 2025 vs 2032
 Figure 19. Water Supply Pipe
 Figure 20. Sewage & Drainage Pipe
 Figure 21. Oil & Gas Pipe
 Figure 22. Agriculture Pipe
 Figure 23. Others
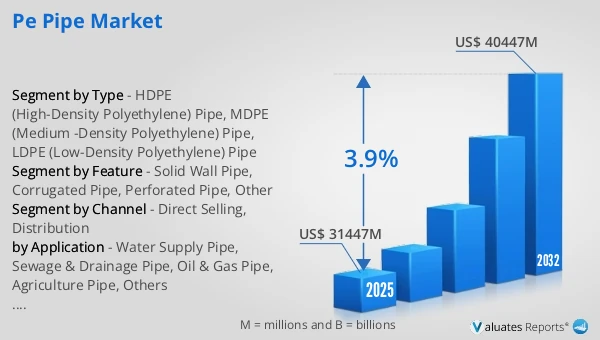
 Figure 24. Global PE Pipe Production Value (US$ Million), 2021 vs 2025 vs 2032
 Figure 25. Global PE Pipe Production Value (US$ Million), 2021–2032
 Figure 26. Global PE Pipe Production Capacity (K MT), 2021–2032
 Figure 27. Global PE Pipe Production (K MT), 2021–2032
 Figure 28. Global PE Pipe Average Price (USD/MT), 2021–2032
 Figure 29. PE Pipe Report Years Considered
 Figure 30. PE Pipe Production Share by Manufacturers in 2025
 Figure 31. Global PE Pipe Production Value Share by Manufacturers (2025)
 Figure 32. PE Pipe Market Share by Company Type (Tier 1, Tier 2, and Tier 3): 2021 vs 2025
 Figure 33. Top 5 and Top 10 Global Players: Market Share by PE Pipe Revenue in 2025
 Figure 34. Global PE Pipe Production Value by Region: 2021 vs 2025 vs 2032 (US$ Million)
 Figure 35. Global PE Pipe Production Value Market Share by Region: 2021 vs 2025 vs 2032
 Figure 36. Global PE Pipe Production Comparison by Region: 2021 vs 2025 vs 2032 (K MT)
 Figure 37. Global PE Pipe Production Market Share by Region: 2021 vs 2025 vs 2032
 Figure 38. North America PE Pipe Production Value (US$ Million) Growth Rate (2021–2032)
 Figure 39. Europe PE Pipe Production Value (US$ Million) Growth Rate (2021–2032)
 Figure 40. Middle East & Africa PE Pipe Production Value (US$ Million) Growth Rate (2021–2032)
 Figure 41. Japan PE Pipe Production Value (US$ Million) Growth Rate (2021–2032)
 Figure 42. China PE Pipe Production Value (US$ Million) Growth Rate (2021–2032)
 Figure 43. China Taiwan PE Pipe Production Value (US$ Million) Growth Rate (2021–2032)
 Figure 44. South Korea PE Pipe Production Value (US$ Million) Growth Rate (2021–2032)
 Figure 45. India PE Pipe Production Value (US$ Million) Growth Rate (2021–2032)
 Figure 46. Australia PE Pipe Production Value (US$ Million) Growth Rate (2021–2032)
 Figure 47. Global PE Pipe Consumption by Region: 2021 vs 2025 vs 2032 (K MT)
 Figure 48. Global PE Pipe Consumption Market Share by Region: 2021 vs 2025 vs 2032
 Figure 49. North America PE Pipe Consumption and Growth Rate (K MT), 2021–2032
 Figure 50. North America PE Pipe Consumption Market Share by Country (2021–2032)
 Figure 51. U.S. PE Pipe Consumption and Growth Rate (K MT), 2021–2032
 Figure 52. Canada PE Pipe Consumption and Growth Rate (K MT), 2021–2032
 Figure 53. Europe PE Pipe Consumption and Growth Rate (K MT), 2021–2032
 Figure 54. Europe PE Pipe Consumption Market Share by Country (2021–2032)
 Figure 55. Germany PE Pipe Consumption and Growth Rate (K MT), 2021–2032
 Figure 56. France PE Pipe Consumption and Growth Rate (K MT), 2021–2032
 Figure 57. U.K. PE Pipe Consumption and Growth Rate (K MT), 2021–2032
 Figure 58. Italy PE Pipe Consumption and Growth Rate (K MT), 2021–2032
 Figure 59. Russia PE Pipe Consumption and Growth Rate (K MT), 2021–2032
 Figure 60. Asia Pacific PE Pipe Consumption and Growth Rate (K MT), 2021–2032
 Figure 61. Asia Pacific PE Pipe Consumption Market Share by Region (2021–2032)
 Figure 62. China PE Pipe Consumption and Growth Rate (K MT), 2021–2032
 Figure 63. Japan PE Pipe Consumption and Growth Rate (K MT), 2021–2032
 Figure 64. South Korea PE Pipe Consumption and Growth Rate (K MT), 2021–2032
 Figure 65. China Taiwan PE Pipe Consumption and Growth Rate (K MT), 2021–2032
 Figure 66. Southeast Asia PE Pipe Consumption and Growth Rate (K MT), 2021–2032
 Figure 67. India PE Pipe Consumption and Growth Rate (K MT), 2021–2032
 Figure 68. Latin America, Middle East & Africa PE Pipe Consumption and Growth Rate (K MT), 2021–2032
 Figure 69. Latin America, Middle East & Africa PE Pipe Consumption Market Share by Country (2021–2032)
 Figure 70. Mexico PE Pipe Consumption and Growth Rate (K MT), 2021–2032
 Figure 71. Brazil PE Pipe Consumption and Growth Rate (K MT), 2021–2032
 Figure 72. Turkey PE Pipe Consumption and Growth Rate (K MT), 2021–2032
 Figure 73. GCC Countries PE Pipe Consumption and Growth Rate (K MT), 2021–2032
 Figure 74. Global Production Market Share of PE Pipe by Type (2021–2032)
 Figure 75. Global Production Value Market Share of PE Pipe by Type (2021–2032)
 Figure 76. Global PE Pipe Price (USD/MT) by Type (2021–2032)
 Figure 77. Global Production Market Share of PE Pipe by Application (2021–2032)
 Figure 78. Global Production Value Market Share of PE Pipe by Application (2021–2032)
 Figure 79. Global PE Pipe Price (USD/MT) by Application (2021–2032)
 Figure 80. PE Pipe Value Chain
 Figure 81. Channels of Distribution (Direct Vs Distribution)
 Figure 82. Bottom-up and Top-down Approaches for This Report
 Figure 83. Data Triangulation
SELECT A FORMAT
Added to Cart
Electronic

$2900

Single User License
Electronic

$4350

Multi User License
Electronic

$5800

Enterprise License
Add to Cart
Buy Now (15% Discount)

OUR CUSTOMER

Nano String