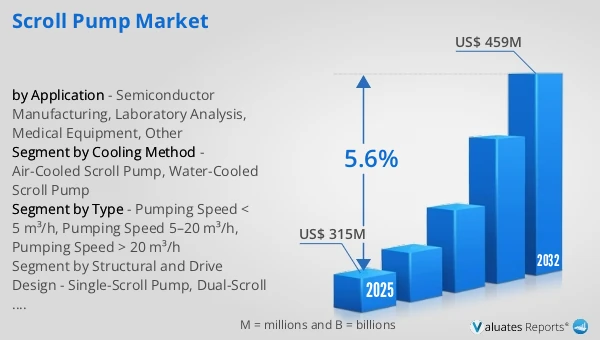
The global Scroll Pump market was valued at US$ 315 million in 2025 and is anticipated to reach US$ 459 million by 2032, at a CAGR of 5.6% from 2026 to 2032.
Scroll Pump Market
The 2025 U.S. tariff policies introduce profound uncertainty into the global economic landscape. This report critically examines the implications of recent tariff adjustments and international strategic countermeasures on Scroll Pump competitive dynamics, regional economic interdependencies, and supply chain reconfigurations.
A Scroll Pump is a positive-displacement vacuum pump that generates vacuum by the relative motion of two interleaved spiral scrolls—one fixed and one orbiting—creating sealed crescent-shaped gas pockets that move continuously from the inlet to the exhaust, offering oil-free or oil-lubricated operation, low vibration, low noise, high reliability, and clean vacuum performance for industrial, scientific, and medical applications.
The scroll pump industry chain starts upstream with suppliers of precision castings, aluminum alloys, steel components, bearings, seals, motors, inverters, electronic control units and surface-treatment materials, continues midstream with scroll pump manufacturers responsible for scroll profile design, precision machining, assembly, testing and quality control, and extends downstream to vacuum system integrators, equipment OEMs, semiconductor fabs, laboratories, medical institutions and industrial end users requiring clean, stable and low-maintenance vacuum solutions.
Projects under construction and planned in the scroll pump sector mainly include expansion of precision vacuum pump manufacturing capacity, construction of automated machining and assembly lines, development of next-generation oil-free and high-efficiency scroll pumps, R&D investment in variable-speed and smart-controlled vacuum systems, localization of production in semiconductor-intensive regions, and strategic cooperation projects between pump manufacturers and semiconductor equipment or analytical instrument OEMs.
2025 Global Market sales Volume: 210,000 units. Average Global Market Price: USD 1,500 per unit. Market Average Gross Profit Margin: 35%.
The scroll pump market is experiencing stable and technology-driven growth, supported by rising demand for clean, oil-free vacuum solutions. Compared with rotary vane pumps, scroll pumps offer lower contamination risk, reduced maintenance, and quieter operation, making them increasingly preferred in sensitive applications. The semiconductor and analytical instrumentation industries are the core demand drivers. Market growth is closely tied to semiconductor capital expenditure cycles and laboratory investment trends. Technical barriers related to precision machining and reliability remain relatively high.
Regionally, Asia-Pacific is the largest and fastest-growing market, driven by semiconductor manufacturing expansion in China, South Korea, Taiwan, and Japan. North America and Europe represent mature markets with strong demand from research institutions, medical equipment, and high-end industrial applications. Emerging regions are gradually adopting scroll pumps as industrial quality standards improve. Regional demand is strongly correlated with semiconductor fab construction and R&D intensity.
Market opportunities include the shift toward oil-free vacuum systems, increasing adoption in medical and life-science equipment, and integration with smart vacuum control systems. Risks involve semiconductor industry cyclicality, high R&D and manufacturing costs, and competition from alternative dry vacuum technologies. Key market trends include higher energy efficiency, variable-speed operation, compact design, and longer maintenance intervals. Competitive characteristics are defined by a limited number of global leaders with strong intellectual property, precision manufacturing capabilities, and long-term OEM relationships, resulting in competition based more on performance, reliability, and service rather than price.
This report delivers a comprehensive overview of the global Scroll Pump market, with both quantitative and qualitative analyses, to help readers develop growth strategies, assess the competitive landscape, evaluate their position in the current market, and make informed business decisions regarding Scroll Pump. The Scroll Pump market size, estimates, and forecasts are provided in terms of output/shipments (Units) and revenue (US$ millions), with 2025 as the base year and historical and forecast data for 2021–2032.
The report segments the global Scroll Pump market comprehensively. Regional market sizes by Type, by Application, by Cooling Method, and by company are also provided. For deeper insight, the report profiles the competitive landscape, key competitors, and their respective market rankings, and discusses technological trends and new product developments.
This report will assist Scroll Pump manufacturers, new entrants, and companies across the industry value chain with information on revenues, production, and average prices for the overall market and its sub-segments, by company, by Type, by Application, and by region.
Market Segmentation
Scope of Scroll Pump Market Report
| Report Metric |
Details |
| Report Name |
Scroll Pump Market |
| Accounted market size in 2025 |
US$ 315 million |
| Forecasted market size in 2032 |
US$ 459 million |
| CAGR |
5.6% |
| Base Year |
2025 |
| Forecasted years |
2026 - 2032 |
| Segment by Type |
- Pumping Speed < 5 m³/h
- Pumping Speed 5–20 m³/h
- Pumping Speed > 20 m³/h
|
| Segment by Cooling Method |
- Air-Cooled Scroll Pump
- Water-Cooled Scroll Pump
|
| Segment by Structural and Drive Design |
- Single-Scroll Pump
- Dual-Scroll Pump
|
| by Application |
- Semiconductor Manufacturing
- Laboratory Analysis
- Medical Equipment
- Other
|
| Production by Region |
- North America
- Europe
- China
- Japan
|
| Consumption by Region |
- North America (United States, Canada)
- Europe (Germany, France, UK, Italy, Russia)
- Asia-Pacific (China, Japan, South Korea, Taiwan)
- Southeast Asia (India)
- Latin America (Mexico, Brazil)
|
| By Company |
Atlas Copco, Edwards Vacuum, Anest Iwata, ULVAC, Air Squared Inc, Leybold, Agilent, Busch, SKY TECHNOLOGY DEVELOPMENT CO.,LTD, GEOWELL VACUUM CO.,LTD, Advanced Scroll Technologies (Hangzhou) Inc, Baosi Group, Labconco |
| Forecast units |
USD million in value |
| Report coverage |
Revenue and volume forecast, company share, competitive landscape, growth factors and trends |
Chapter Outline
- Chapter 1: Defines the scope of the report and presents an executive summary of market segments (by Type, by Application, by Cooling Method, etc.), including the size of each segment and its future growth potential. It offers a high-level view of the current market and its likely evolution in the short, medium, and long term.
- Chapter 2: Provides a detailed analysis of the competitive landscape for Scroll Pump manufacturers, including prices, production, value-based market shares, latest development plans, and information on mergers and acquisitions.
- Chapter 3: Examines Scroll Pump production/output and value by region and country, providing a quantitative assessment of market size and growth potential for each region over the next six years.
- Chapter 4: Analyzes Scroll Pump consumption at the regional and country levels. It quantifies market size and growth potential for each region and its key countries, and outlines market development, outlook, addressable space, and national production.
- Chapter 5: Analyzes market segments by Type, covering the size and growth potential of each segment to help readers identify “blue ocean” opportunities.
- Chapter 6: Analyzes market segments by Application, covering the size and growth potential of each segment to help readers identify “blue ocean” opportunities in downstream markets.
- Chapter 7: Profiles key players, detailing the fundamentals of major companies, including product production/output, value, price, gross margin, product portfolio/introductions, and recent developments.
- Chapter 8: Reviews the industry value chain, including upstream and downstream segments.
- Chapter 9: Discusses market dynamics and recent developments, including drivers, restraints, challenges and risks for manufacturers, U.S. Tariffs and relevant policy analysis.
- Chapter 10: Summarizes the key findings and conclusions of the report.
Ans: The Scroll Pump Market witnessing a CAGR of 5.6% during the forecast period 2026-2032.
Ans: The Scroll Pump Market size in 2032 will be US$ 459 million.
Ans: The main players in the Scroll Pump Market are Atlas Copco, Edwards Vacuum, Anest Iwata, ULVAC, Air Squared Inc, Leybold, Agilent, Busch, SKY TECHNOLOGY DEVELOPMENT CO.,LTD, GEOWELL VACUUM CO.,LTD, Advanced Scroll Technologies (Hangzhou) Inc, Baosi Group, Labconco
Ans: The Applications covered in the Scroll Pump Market report are Semiconductor Manufacturing, Laboratory Analysis, Medical Equipment, Other
Ans: The Types covered in the Scroll Pump Market report are Pumping Speed < 5 m³/h, Pumping Speed 5–20 m³/h, Pumping Speed > 20 m³/h