List of Tables
Table 1. Artificial Vital Organs Market Trends
Table 2. Artificial Vital Organs Market Drivers & Opportunity
Table 3. Artificial Vital Organs Market Challenges
Table 4. Artificial Vital Organs Market Restraints
Table 5. Global Artificial Vital Organs Revenue by Company (2019-2024) & (US$ Million)
Table 6. Global Artificial Vital Organs Revenue Market Share by Company (2019-2024)
Table 7. Key Companies Artificial Vital Organs Manufacturing Base Distribution and Headquarters
Table 8. Key Companies Artificial Vital Organs Product Type
Table 9. Key Companies Time to Begin Mass Production of Artificial Vital Organs
Table 10. Global Artificial Vital Organs Companies Market Concentration Ratio (CR5 and HHI)
Table 11. Global Top Companies Market Share by Company Type (Tier 1, Tier 2, and Tier 3) & (based on the Revenue in Artificial Vital Organs as of 2023)
Table 12. Mergers & Acquisitions, Expansion Plans
Table 13. Global Artificial Vital Organs Sales Value by Type: 2019 VS 2023 VS 2030 (US$ Million)
Table 14. Global Artificial Vital Organs Sales Value by Type (2019-2024) & (US$ Million)
Table 15. Global Artificial Vital Organs Sales Value by Type (2025-2030) & (US$ Million)
Table 16. Global Artificial Vital Organs Sales Market Share in Value by Type (2019-2024) & (%)
Table 17. Global Artificial Vital Organs Sales Market Share in Value by Type (2025-2030) & (%)
Table 18. Global Artificial Vital Organs Sales Value by Application: 2019 VS 2023 VS 2030 (US$ Million)
Table 19. Global Artificial Vital Organs Sales Value by Application (2019-2024) & (US$ Million)
Table 20. Global Artificial Vital Organs Sales Value by Application (2025-2030) & (US$ Million)
Table 21. Global Artificial Vital Organs Sales Market Share in Value by Application (2019-2024) & (%)
Table 22. Global Artificial Vital Organs Sales Market Share in Value by Application (2025-2030) & (%)
Table 23. Global Artificial Vital Organs Sales Value by Region: 2019 VS 2023 VS 2030 (US$ Million)
Table 24. Global Artificial Vital Organs Sales Value by Region (2019-2024) & (US$ Million)
Table 25. Global Artificial Vital Organs Sales Value by Region (2025-2030) & (US$ Million)
Table 26. Global Artificial Vital Organs Sales Value by Region (2019-2024) & (%)
Table 27. Global Artificial Vital Organs Sales Value by Region (2025-2030) & (%)
Table 28. Key Countries/Regions Artificial Vital Organs Sales Value Growth Trends, (US$ Million): 2019 VS 2023 VS 2030
Table 29. Key Countries/Regions Artificial Vital Organs Sales Value, (2019-2024) & (US$ Million)
Table 30. Key Countries/Regions Artificial Vital Organs Sales Value, (2025-2030) & (US$ Million)
Table 31. Edwards Lifesciences Corporation Basic Information List
Table 32. Edwards Lifesciences Corporation Description and Business Overview
Table 33. Edwards Lifesciences Corporation Artificial Vital Organs Products, Services and Solutions
Table 34. Revenue (US$ Million) in Artificial Vital Organs Business of Edwards Lifesciences Corporation (2019-2024)
Table 35. Edwards Lifesciences Corporation Recent Developments
Table 36. Abbott Diabetes Care Basic Information List
Table 37. Abbott Diabetes Care Description and Business Overview
Table 38. Abbott Diabetes Care Artificial Vital Organs Products, Services and Solutions
Table 39. Revenue (US$ Million) in Artificial Vital Organs Business of Abbott Diabetes Care (2019-2024)
Table 40. Abbott Diabetes Care Recent Developments
Table 41. Baxter International Basic Information List
Table 42. Baxter International Description and Business Overview
Table 43. Baxter International Artificial Vital Organs Products, Services and Solutions
Table 44. Revenue (US$ Million) in Artificial Vital Organs Business of Baxter International (2019-2024)
Table 45. Baxter International Recent Developments
Table 46. Ekso Bionics Basic Information List
Table 47. Ekso Bionics Description and Business Overview
Table 48. Ekso Bionics Artificial Vital Organs Products, Services and Solutions
Table 49. Revenue (US$ Million) in Artificial Vital Organs Business of Ekso Bionics (2019-2024)
Table 50. Ekso Bionics Recent Developments
Table 51. Asahi Kasei Medical Basic Information List
Table 52. Asahi Kasei Medical Description and Business Overview
Table 53. Asahi Kasei Medical Artificial Vital Organs Products, Services and Solutions
Table 54. Revenue (US$ Million) in Artificial Vital Organs Business of Asahi Kasei Medical (2019-2024)
Table 55. Asahi Kasei Medical Recent Developments
Table 56. Jarvik Heart Basic Information List
Table 57. Jarvik Heart Description and Business Overview
Table 58. Jarvik Heart Artificial Vital Organs Products, Services and Solutions
Table 59. Revenue (US$ Million) in Artificial Vital Organs Business of Jarvik Heart (2019-2024)
Table 60. Jarvik Heart Recent Developments
Table 61. Ottobock Healthcare Basic Information List
Table 62. Ottobock Healthcare Description and Business Overview
Table 63. Ottobock Healthcare Artificial Vital Organs Products, Services and Solutions
Table 64. Revenue (US$ Million) in Artificial Vital Organs Business of Ottobock Healthcare (2019-2024)
Table 65. Ottobock Healthcare Recent Developments
Table 66. Abiomed Inc Basic Information List
Table 67. Abiomed Inc Description and Business Overview
Table 68. Abiomed Inc Artificial Vital Organs Products, Services and Solutions
Table 69. Revenue (US$ Million) in Artificial Vital Organs Business of Abiomed Inc (2019-2024)
Table 70. Abiomed Inc Recent Developments
Table 71. Boston Scientific Corporation Basic Information List
Table 72. Boston Scientific Corporation Description and Business Overview
Table 73. Boston Scientific Corporation Artificial Vital Organs Products, Services and Solutions
Table 74. Revenue (US$ Million) in Artificial Vital Organs Business of Boston Scientific Corporation (2019-2024)
Table 75. Boston Scientific Corporation Recent Developments
Table 76. Ossur Basic Information List
Table 77. Ossur Description and Business Overview
Table 78. Ossur Artificial Vital Organs Products, Services and Solutions
Table 79. Revenue (US$ Million) in Artificial Vital Organs Business of Ossur (2019-2024)
Table 80. Ossur Recent Developments
Table 81. Medtronic Basic Information List
Table 82. Medtronic Description and Business Overview
Table 83. Medtronic Artificial Vital Organs Products, Services and Solutions
Table 84. Revenue (US$ Million) in Artificial Vital Organs Business of Medtronic (2019-2024)
Table 85. Medtronic Recent Developments
Table 86. Zimmer Biomet Basic Information List
Table 87. Zimmer Biomet Description and Business Overview
Table 88. Zimmer Biomet Artificial Vital Organs Products, Services and Solutions
Table 89. Revenue (US$ Million) in Artificial Vital Organs Business of Zimmer Biomet (2019-2024)
Table 90. Zimmer Biomet Recent Developments
Table 91. Heartware International, Inc Basic Information List
Table 92. Heartware International, Inc Description and Business Overview
Table 93. Heartware International, Inc Artificial Vital Organs Products, Services and Solutions
Table 94. Revenue (US$ Million) in Artificial Vital Organs Business of Heartware International, Inc (2019-2024)
Table 95. Heartware International, Inc Recent Developments
Table 96. SynCardia Systems, LLC. Basic Information List
Table 97. SynCardia Systems, LLC. Description and Business Overview
Table 98. SynCardia Systems, LLC. Artificial Vital Organs Products, Services and Solutions
Table 99. Revenue (US$ Million) in Artificial Vital Organs Business of SynCardia Systems, LLC. (2019-2024)
Table 100. SynCardia Systems, LLC. Recent Developments
Table 101. Iwalk, Inc. Basic Information List
Table 102. Iwalk, Inc. Description and Business Overview
Table 103. Iwalk, Inc. Artificial Vital Organs Products, Services and Solutions
Table 104. Revenue (US$ Million) in Artificial Vital Organs Business of Iwalk, Inc. (2019-2024)
Table 105. Iwalk, Inc. Recent Developments
Table 106. Berlin Heart Gmbh Basic Information List
Table 107. Berlin Heart Gmbh Description and Business Overview
Table 108. Berlin Heart Gmbh Artificial Vital Organs Products, Services and Solutions
Table 109. Revenue (US$ Million) in Artificial Vital Organs Business of Berlin Heart Gmbh (2019-2024)
Table 110. Berlin Heart Gmbh Recent Developments
Table 111. Biomet, Inc Basic Information List
Table 112. Biomet, Inc Description and Business Overview
Table 113. Biomet, Inc Artificial Vital Organs Products, Services and Solutions
Table 114. Revenue (US$ Million) in Artificial Vital Organs Business of Biomet, Inc (2019-2024)
Table 115. Biomet, Inc Recent Developments
Table 116. CARMAT Basic Information List
Table 117. CARMAT Description and Business Overview
Table 118. CARMAT Artificial Vital Organs Products, Services and Solutions
Table 119. Revenue (US$ Million) in Artificial Vital Organs Business of CARMAT (2019-2024)
Table 120. CARMAT Recent Developments
Table 121. Cleveland Heart Basic Information List
Table 122. Cleveland Heart Description and Business Overview
Table 123. Cleveland Heart Artificial Vital Organs Products, Services and Solutions
Table 124. Revenue (US$ Million) in Artificial Vital Organs Business of Cleveland Heart (2019-2024)
Table 125. Cleveland Heart Recent Developments
Table 126. MyLVAD Basic Information List
Table 127. MyLVAD Description and Business Overview
Table 128. MyLVAD Artificial Vital Organs Products, Services and Solutions
Table 129. Revenue (US$ Million) in Artificial Vital Organs Business of MyLVAD (2019-2024)
Table 130. MyLVAD Recent Developments
Table 131. Cirtec Medical Systems Basic Information List
Table 132. Cirtec Medical Systems Description and Business Overview
Table 133. Cirtec Medical Systems Artificial Vital Organs Products, Services and Solutions
Table 134. Revenue (US$ Million) in Artificial Vital Organs Business of Cirtec Medical Systems (2019-2024)
Table 135. Cirtec Medical Systems Recent Developments
Table 136. Thoratec Corporation Basic Information List
Table 137. Thoratec Corporation Description and Business Overview
Table 138. Thoratec Corporation Artificial Vital Organs Products, Services and Solutions
Table 139. Revenue (US$ Million) in Artificial Vital Organs Business of Thoratec Corporation (2019-2024)
Table 140. Thoratec Corporation Recent Developments
Table 141. Fresenius Medical Care AG & Co. KGaA Basic Information List
Table 142. Fresenius Medical Care AG & Co. KGaA Description and Business Overview
Table 143. Fresenius Medical Care AG & Co. KGaA Artificial Vital Organs Products, Services and Solutions
Table 144. Revenue (US$ Million) in Artificial Vital Organs Business of Fresenius Medical Care AG & Co. KGaA (2019-2024)
Table 145. Fresenius Medical Care AG & Co. KGaA Recent Developments
Table 146. Cyberonics, Inc Basic Information List
Table 147. Cyberonics, Inc Description and Business Overview
Table 148. Cyberonics, Inc Artificial Vital Organs Products, Services and Solutions
Table 149. Revenue (US$ Million) in Artificial Vital Organs Business of Cyberonics, Inc (2019-2024)
Table 150. Cyberonics, Inc Recent Developments
Table 151. F. Hoffmann-La Roche Ltd Basic Information List
Table 152. F. Hoffmann-La Roche Ltd Description and Business Overview
Table 153. F. Hoffmann-La Roche Ltd Artificial Vital Organs Products, Services and Solutions
Table 154. Revenue (US$ Million) in Artificial Vital Organs Business of F. Hoffmann-La Roche Ltd (2019-2024)
Table 155. F. Hoffmann-La Roche Ltd Recent Developments
Table 156. BiVACOR Basic Information List
Table 157. BiVACOR Description and Business Overview
Table 158. BiVACOR Artificial Vital Organs Products, Services and Solutions
Table 159. Revenue (US$ Million) in Artificial Vital Organs Business of BiVACOR (2019-2024)
Table 160. BiVACOR Recent Developments
Table 161. Key Raw Materials Lists
Table 162. Raw Materials Key Suppliers Lists
Table 163. Artificial Vital Organs Downstream Customers
Table 164. Artificial Vital Organs Distributors List
Table 165. Research Programs/Design for This Report
Table 166. Key Data Information from Secondary Sources
Table 167. Key Data Information from Primary Sources
Table 168. Business Unit and Senior & Team Lead Analysts
List of Figures
Figure 1. Artificial Vital Organs Product Picture
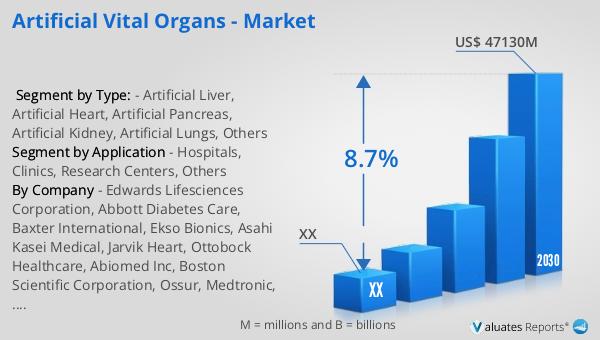
Figure 2. Global Artificial Vital Organs Sales Value, 2019 VS 2023 VS 2030 (US$ Million)
Figure 3. Global Artificial Vital Organs Sales Value (2019-2030) & (US$ Million)
Figure 4. Artificial Vital Organs Report Years Considered
Figure 5. Global Artificial Vital Organs Players Revenue Ranking (2023) & (US$ Million)
Figure 6. The 5 and 10 Largest Manufacturers in the World: Market Share by Artificial Vital Organs Revenue in 2023
Figure 7. Artificial Vital Organs Market Share by Company Type (Tier 1, Tier 2, and Tier 3): 2019 VS 2023
Figure 8. Artificial Liver Picture
Figure 9. Artificial Heart Picture
Figure 10. Artificial Pancreas Picture
Figure 11. Artificial Kidney Picture
Figure 12. Artificial Lungs Picture
Figure 13. Others Picture
Figure 14. Global Artificial Vital Organs Sales Value by Type (2019 VS 2023 VS 2030) & (US$ Million)
Figure 15. Global Artificial Vital Organs Sales Value Market Share by Type, 2023 & 2030
Figure 16. Product Picture of Hospitals
Figure 17. Product Picture of Clinics
Figure 18. Product Picture of Research Centers
Figure 19. Product Picture of Others
Figure 20. Global Artificial Vital Organs Sales Value by Application (2019 VS 2023 VS 2030) & (US$ Million)
Figure 21. Global Artificial Vital Organs Sales Value Market Share by Application, 2023 & 2030
Figure 22. North America Artificial Vital Organs Sales Value (2019-2030) & (US$ Million)
Figure 23. North America Artificial Vital Organs Sales Value by Country (%), 2023 VS 2030
Figure 24. Europe Artificial Vital Organs Sales Value (2019-2030) & (US$ Million)
Figure 25. Europe Artificial Vital Organs Sales Value by Country (%), 2023 VS 2030
Figure 26. Asia Pacific Artificial Vital Organs Sales Value (2019-2030) & (US$ Million)
Figure 27. Asia Pacific Artificial Vital Organs Sales Value by Country (%), 2023 VS 2030
Figure 28. South America Artificial Vital Organs Sales Value (2019-2030) & (US$ Million)
Figure 29. South America Artificial Vital Organs Sales Value by Country (%), 2023 VS 2030
Figure 30. Middle East & Africa Artificial Vital Organs Sales Value (2019-2030) & (US$ Million)
Figure 31. Middle East & Africa Artificial Vital Organs Sales Value by Country (%), 2023 VS 2030
Figure 32. Key Countries/Regions Artificial Vital Organs Sales Value (%), (2019-2030)
Figure 33. United States Artificial Vital Organs Sales Value, (2019-2030) & (US$ Million)
Figure 34. United States Artificial Vital Organs Sales Value by Type (%), 2023 VS 2030
Figure 35. United States Artificial Vital Organs Sales Value by Application (%), 2023 VS 2030
Figure 36. Europe Artificial Vital Organs Sales Value, (2019-2030) & (US$ Million)
Figure 37. Europe Artificial Vital Organs Sales Value by Type (%), 2023 VS 2030
Figure 38. Europe Artificial Vital Organs Sales Value by Application (%), 2023 VS 2030
Figure 39. China Artificial Vital Organs Sales Value, (2019-2030) & (US$ Million)
Figure 40. China Artificial Vital Organs Sales Value by Type (%), 2023 VS 2030
Figure 41. China Artificial Vital Organs Sales Value by Application (%), 2023 VS 2030
Figure 42. Japan Artificial Vital Organs Sales Value, (2019-2030) & (US$ Million)
Figure 43. Japan Artificial Vital Organs Sales Value by Type (%), 2023 VS 2030
Figure 44. Japan Artificial Vital Organs Sales Value by Application (%), 2023 VS 2030
Figure 45. South Korea Artificial Vital Organs Sales Value, (2019-2030) & (US$ Million)
Figure 46. South Korea Artificial Vital Organs Sales Value by Type (%), 2023 VS 2030
Figure 47. South Korea Artificial Vital Organs Sales Value by Application (%), 2023 VS 2030
Figure 48. Southeast Asia Artificial Vital Organs Sales Value, (2019-2030) & (US$ Million)
Figure 49. Southeast Asia Artificial Vital Organs Sales Value by Type (%), 2023 VS 2030
Figure 50. Southeast Asia Artificial Vital Organs Sales Value by Application (%), 2023 VS 2030
Figure 51. India Artificial Vital Organs Sales Value, (2019-2030) & (US$ Million)
Figure 52. India Artificial Vital Organs Sales Value by Type (%), 2023 VS 2030
Figure 53. India Artificial Vital Organs Sales Value by Application (%), 2023 VS 2030
Figure 54. Artificial Vital Organs Industrial Chain
Figure 55. Artificial Vital Organs Manufacturing Cost Structure
Figure 56. Channels of Distribution (Direct Sales, and Distribution)
Figure 57. Bottom-up and Top-down Approaches for This Report
Figure 58. Data Triangulation