0
U.S. (TOLL FREE)
+1 (315) 215-3225
Automative

0
U.S. (TOLL FREE)
+1 (315) 215-3225
Global N-Butyl Acetate Market Insights and Forecast to 2028
Published Date: May 2019
|
Report Code: QYRE-Auto-1983
Home | Market Reports | Business & Industrial| Chemicals Industry
Global N Butyl Acetate Market Insights Forecast to 2025
BUY CHAPTERS

Global N-Butyl Acetate Market Insights and Forecast to 2028

Code: QYRE-Auto-1983
Report
May 2019
Pages:127
QYResearch
Buy Now with 15% Discount
DESCRIPTION
TABLE OF CONTENT
TABLES & FIGURES

N-Butyl Acetate Market Size 

Due to the COVID-19 pandemic, the global N-Butyl Acetate market size is estimated to be worth USD 1797.1 Million in 2022 and is forecast to a readjusted size of USD 2183.5 Million by 2028 with a CAGR of 3.3% during the review period. 

N-Butyl acetate market

N-Butyl acetate is a limpid colorless liquid with a fruity odor. It is prepared by heating and distillation of n-butyl alcohol and acetic acid, in presence of sulphuric acid which acts as a catalyst. It is generally used as a solvent, during the production of lacquers, natural gums and synthetic resins.

N-Butanol and acetic acid are the main raw materials. Most manufacturers obtain raw materials by themselves. N-Butyl acetate are mainly applied in paints & coatings industry, chemical & pharmaceutical industry, perfumes & flavor industry, of which paints & coatings industry occupy the largest share.

N-Butyl Acetate Market Share

The world n-butyl acetate consuming market will still has a certain amount of growth. The growth rate will increase at a growth rate of about 4.50%. Global consuming market will still has a certain amount of growth and the main consumption region will be in China, USA, Europe and Japan. In the future, the market in developed countries will have some growth and the market in developing countries will have a faster growth rate.

This report researches the worldwide N-Butyl Acetate market size (value, capacity, production and consumption) in key regions like United States, Europe, Asia Pacific (China, Japan) and other regions.

This study categorizes the global N-Butyl Acetate breakdown data by manufacturers, region, type and application, also analyzes the market status, market share, growth rate, future trends, market drivers, opportunities and challenges, risks and entry barriers, sales channels, distributors and Porter's Five Forces Analysis. 

Key Players

  • OXEA
  • BASF
  • Ineos Oxide
  • DOW
  • PETRONAS
  • Eastman
  • KH Neochem
  • Celanese Corporation
  • Carbohim
  • Korea Alcohol Industrial
  • Baichuan
  • Handsome
  • Yankuang
  • Jinyinmeng
  • Sanmu
  • Chang Chun Petrochemical
  • Longtian
  • Shiny Chemical
  • Jidong Solvent

By Type

  • Superior Grade
  • First Grade
  • Qualified Grade

By Application

  • Paints & Coatings Industry
  • Chemical & Pharmaceutical Industry
  • Perfumes & Flavor Industry
  • Others

Production By Region

  • United States
  • Europe
  • China
  • Japan
  • Other Regions

Consumption By Region

  • North America
  • United States
  • Canada
  • Mexico
  • Asia-Pacific
  • China
  • India
  • Japan
  • South Korea
  • Australia
  • Indonesia
  • Malaysia
  • Philippines
  • Thailand
  • Vietnam
  • Europe
  • Germany
  • France
  • UK
  • Italy
  • Russia
  • Rest of Europe
  • Central & South America
  • Brazil
  • Rest of South America
  • Middle East & Africa
  • GCC Countries
  • Turkey
  • Egypt
  • South Africa
  • Rest of Middle East & Africa

Scope of N-Butyl Acetate Market Report

Report Metric Details
Report Name N-Buty Acetate Market
The market size in 2022 USD 1797.1 Million
The revenue forecast in 2028 USD 2183.5 Million
Growth Rate CAGR of 3.3%
Market size available for years 2023-2028
Forecast units Value (USD)
Segments covered Type, Application, Industry, Regions
Report coverage Revenue & volume forecast, company share, competitive landscape, growth factors, and trends
Geographic regions covered North America, Europe, Asia Pacific, Latin America, Middle East & Africa

Frequently Asked Questions About This Report 

1. How big is the N-Butyl Acetate Market?

Ans. Due to the COVID-19 pandemic, the global N-Butyl Acetate market size is estimated to be worth US$ 1797.1 million in 2022 and is forecast to a readjusted size of US$ 2183.5 million by 2028 with a CAGR of 3.3% during the review period.

2. Who are the key players available in the N-Butyl Acetate Industry?

Ans. Some of the major companies are Occidental Chemical Corporation, Solvay, Tangshan Sanyou Group, TETRA Technologies, Tiger Calcium Services, Qingdao Huadong Calcium Producing, Ward Chemical, Weifang Haibin Chemical, Zirax.

3. Does the report provides covid-19 impact analysis?

Ans. The major players in global N-Butyl Acetate market include OXEA, Baichuan, Handsome, etc. The top 3 players occupy about 25% shares of the global market.

4. Which region holds largest market share in the N-Butyl Acetate?

Ans. China and Europe are main markets, they occupy about 50% of the global market.

Table of Contents

Global N-Butyl Acetate Market Research Report 2019-2025, by Manufacturers, Regions, Types and Applications
1 Study Coverage
    1.1 N-Butyl Acetate Product
    1.2 Key Market Segments in This Study
    1.3 Key Manufacturers Covered
    1.4 Market by Type
        1.4.1 Global N-Butyl Acetate Market Size Growth Rate by Type
        1.4.2 Superior Grade
        1.4.3 First Grade
        1.4.4 Qualified Grade
    1.5 Market by Application
        1.5.1 Global N-Butyl Acetate Market Size Growth Rate by Application
        1.5.2 Paints & Coatings Industry
        1.5.3 Chemical & Pharmaceutical Industry
        1.5.4 Perfumes & Flavor Industry
        1.5.5 Others
    1.6 Study Objectives
    1.7 Years Considered

2 Executive Summary
    2.1 Global N-Butyl Acetate Production
        2.1.1 Global N-Butyl Acetate Revenue 2014-2025
        2.1.2 Global N-Butyl Acetate Production 2014-2025
        2.1.3 Global N-Butyl Acetate Capacity 2014-2025
        2.1.4 Global N-Butyl Acetate Marketing Pricing and Trends
    2.2 N-Butyl Acetate Growth Rate (CAGR) 2019-2025
    2.3 Analysis of Competitive Landscape
        2.3.1 Manufacturers Market Concentration Ratio (CR5 and HHI)
        2.3.2 Key N-Butyl Acetate Manufacturers
    2.4 Market Drivers, Trends and Issues
    2.5 Macroscopic Indicator
        2.5.1 GDP for Major Regions
        2.5.2 Price of Raw Materials in Dollars: Evolution

3 Market Size by Manufacturers
    3.1 N-Butyl Acetate Production by Manufacturers
        3.1.1 N-Butyl Acetate Production by Manufacturers
        3.1.2 N-Butyl Acetate Production Market Share by Manufacturers
    3.2 N-Butyl Acetate Revenue by Manufacturers
        3.2.1 N-Butyl Acetate Revenue by Manufacturers (2014-2019)
        3.2.2 N-Butyl Acetate Revenue Share by Manufacturers (2014-2019)
    3.3 N-Butyl Acetate Price by Manufacturers
    3.4 Mergers & Acquisitions, Expansion Plans

4 N-Butyl Acetate Production by Regions
    4.1 Global N-Butyl Acetate Production by Regions
        4.1.1 Global N-Butyl Acetate Production Market Share by Regions
        4.1.2 Global N-Butyl Acetate Revenue Market Share by Regions
    4.2 United States
        4.2.1 United States N-Butyl Acetate Production
        4.2.2 United States N-Butyl Acetate Revenue
        4.2.3 Key Players in United States
        4.2.4 United States N-Butyl Acetate Import & Export
    4.3 Europe
        4.3.1 Europe N-Butyl Acetate Production
        4.3.2 Europe N-Butyl Acetate Revenue
        4.3.3 Key Players in Europe
        4.3.4 Europe N-Butyl Acetate Import & Export
    4.4 China
        4.4.1 China N-Butyl Acetate Production
        4.4.2 China N-Butyl Acetate Revenue
        4.4.3 Key Players in China
        4.4.4 China N-Butyl Acetate Import & Export
    4.5 Japan
        4.5.1 Japan N-Butyl Acetate Production
        4.5.2 Japan N-Butyl Acetate Revenue
        4.5.3 Key Players in Japan
        4.5.4 Japan N-Butyl Acetate Import & Export
    4.6 Other Regions
        4.6.1 South Korea
        4.6.2 India
        4.6.3 Southeast Asia

5 N-Butyl Acetate Consumption by Regions
    5.1 Global N-Butyl Acetate Consumption by Regions
        5.1.1 Global N-Butyl Acetate Consumption by Regions
        5.1.2 Global N-Butyl Acetate Consumption Market Share by Regions
    5.2 North America
        5.2.1 North America N-Butyl Acetate Consumption by Application
        5.2.2 North America N-Butyl Acetate Consumption by Countries
        5.2.3 United States
        5.2.4 Canada
        5.2.5 Mexico
    5.3 Europe
        5.3.1 Europe N-Butyl Acetate Consumption by Application
        5.3.2 Europe N-Butyl Acetate Consumption by Countries
        5.3.3 Germany
        5.3.4 France
        5.3.5 UK
        5.3.6 Italy
        5.3.7 Russia
    5.4 Asia Pacific
        5.4.1 Asia Pacific N-Butyl Acetate Consumption by Application
        5.4.2 Asia Pacific N-Butyl Acetate Consumption by Countries
        5.4.3 China
        5.4.4 Japan
        5.4.5 South Korea
        5.4.6 India
        5.4.7 Australia
        5.4.8 Indonesia
        5.4.9 Thailand
        5.4.10 Malaysia
        5.4.11 Philippines
        5.4.12 Vietnam
    5.5 Central & South America
        5.5.1 Central & South America N-Butyl Acetate Consumption by Application
        5.5.2 Central & South America N-Butyl Acetate Consumption by Countries
        5.5.3 Brazil
    5.6 Middle East and Africa
        5.6.1 Middle East and Africa N-Butyl Acetate Consumption by Application
        5.6.2 Middle East and Africa N-Butyl Acetate Consumption by Countries
        5.6.3 Turkey
        5.6.4 GCC Countries
        5.6.5 Egypt
        5.6.6 South Africa

6 Market Size by Type
    6.1 Global N-Butyl Acetate Breakdown Dada by Type
    6.2 Global N-Butyl Acetate Revenue by Type
    6.3 N-Butyl Acetate Price by Type

7 Market Size by Application
    7.1 Overview
    7.2 Global N-Butyl Acetate Breakdown Dada by Application
        7.2.1 Global N-Butyl Acetate Consumption by Application
        7.2.2 Global N-Butyl Acetate Consumption Market Share by Application (2014-2019)

8 Manufacturers Profiles
    8.1 OXEA
        8.1.1 OXEA Company Details
        8.1.2 Company Description
        8.1.3 Capacity, Production and Value of N-Butyl Acetate
        8.1.4 N-Butyl Acetate Product Description
        8.1.5 SWOT Analysis
    8.2 BASF
        8.2.1 BASF Company Details
        8.2.2 Company Description
        8.2.3 Capacity, Production and Value of N-Butyl Acetate
        8.2.4 N-Butyl Acetate Product Description
        8.2.5 SWOT Analysis
    8.3 Ineos Oxide
        8.3.1 Ineos Oxide Company Details
        8.3.2 Company Description
        8.3.3 Capacity, Production and Value of N-Butyl Acetate
        8.3.4 N-Butyl Acetate Product Description
        8.3.5 SWOT Analysis
    8.4 DOW
        8.4.1 DOW Company Details
        8.4.2 Company Description
        8.4.3 Capacity, Production and Value of N-Butyl Acetate
        8.4.4 N-Butyl Acetate Product Description
        8.4.5 SWOT Analysis
    8.5 PETRONAS
        8.5.1 PETRONAS Company Details
        8.5.2 Company Description
        8.5.3 Capacity, Production and Value of N-Butyl Acetate
        8.5.4 N-Butyl Acetate Product Description
        8.5.5 SWOT Analysis
    8.6 Eastman
        8.6.1 Eastman Company Details
        8.6.2 Company Description
        8.6.3 Capacity, Production and Value of N-Butyl Acetate
        8.6.4 N-Butyl Acetate Product Description
        8.6.5 SWOT Analysis
    8.7 KH Neochem
        8.7.1 KH Neochem Company Details
        8.7.2 Company Description
        8.7.3 Capacity, Production and Value of N-Butyl Acetate
        8.7.4 N-Butyl Acetate Product Description
        8.7.5 SWOT Analysis
    8.8 Celanese Corporation
        8.8.1 Celanese Corporation Company Details
        8.8.2 Company Description
        8.8.3 Capacity, Production and Value of N-Butyl Acetate
        8.8.4 N-Butyl Acetate Product Description
        8.8.5 SWOT Analysis
    8.9 Carbohim
        8.9.1 Carbohim Company Details
        8.9.2 Company Description
        8.9.3 Capacity, Production and Value of N-Butyl Acetate
        8.9.4 N-Butyl Acetate Product Description
        8.9.5 SWOT Analysis
    8.10 Korea Alcohol Industrial
        8.10.1 Korea Alcohol Industrial Company Details
        8.10.2 Company Description
        8.10.3 Capacity, Production and Value of N-Butyl Acetate
        8.10.4 N-Butyl Acetate Product Description
        8.10.5 SWOT Analysis
    8.11 Baichuan
    8.12 Handsome
    8.13 Yankuang
    8.14 Jinyinmeng
    8.15 Sanmu
    8.16 Chang Chun Petrochemical
    8.17 Longtian
    8.18 Shiny Chemical
    8.19 Jidong Solvent

9 Production Forecasts
    9.1 N-Butyl Acetate Production and Revenue Forecast
        9.1.1 Global N-Butyl Acetate Production Forecast 2019-2025
        9.1.2 Global N-Butyl Acetate Revenue Forecast 2019-2025
    9.2 N-Butyl Acetate Production and Revenue Forecast by Regions
        9.2.1 Global N-Butyl Acetate Revenue Forecast by Regions
        9.2.2 Global N-Butyl Acetate Production Forecast by Regions
    9.3 N-Butyl Acetate Key Producers Forecast
        9.3.1 United States
        9.3.2 Europe
        9.3.3 China
        9.3.4 Japan
    9.4 Forecast by Type
        9.4.1 Global N-Butyl Acetate Production Forecast by Type
        9.4.2 Global N-Butyl Acetate Revenue Forecast by Type

10 Consumption Forecast
    10.1 Consumption Forecast by Application
    10.2 N-Butyl Acetate Consumption Forecast by Regions
    10.3 North America Market Consumption Forecast
        10.3.1 North America N-Butyl Acetate Consumption Forecast by Countries 2019-2025
        10.3.2 United States
        10.3.3 Canada
        10.3.4 Mexico
    10.4 Europe Market Consumption Forecast
        10.4.1 Europe N-Butyl Acetate Consumption Forecast by Countries 2019-2025
        10.4.2 Germany
        10.4.3 France
        10.4.4 UK
        10.4.5 Italy
        10.4.6 Russia
    10.5 Asia Pacific Market Consumption Forecast
        10.5.1 Asia Pacific N-Butyl Acetate Consumption Forecast by Countries 2019-2025
        10.5.2 China
        10.5.3 Japan
        10.5.4 Korea
        10.5.5 India
        10.5.6 Australia
        10.5.7 Indonesia
        10.5.8 Thailand
        10.5.9 Malaysia
        10.5.10 Philippines
        10.5.11 Vietnam
    10.6 Central & South America Market Consumption Forecast
        10.6.1 Central & South America N-Butyl Acetate Consumption Forecast by Country 2019-2025
        10.6.2 Brazil
    10.7 Middle East and Africa Market Consumption Forecast
        10.7.1 Middle East and Africa N-Butyl Acetate Consumption Forecast by Countries 2019-2025
        10.7.2 Middle East and Africa
        10.7.3 Turkey
        10.7.4 GCC Countries
        10.7.5 Egypt
        10.7.6 South Africa

11 Upstream, Industry Chain and Downstream Customers Analysis
    11.1 Analysis of N-Butyl Acetate Upstream Market
        11.1.1 N-Butyl Acetate Key Raw Material
        11.1.2 Typical Suppliers of Key N-Butyl Acetate Raw Material
        11.1.3 N-Butyl Acetate Raw Material Market Concentration Rate
    11.2 N-Butyl Acetate Industry Chain Analysis
    11.3 Marketing & Distribution
    11.4 N-Butyl Acetate Distributors
    11.5 N-Butyl Acetate Customers

12 Opportunities & Challenges, Threat and Affecting Factors
    12.1 Market Opportunities
    12.2 Market Challenges
    12.3 Porter's Five Forces Analysis

13 Key Findings

14 Appendix
    14.1 Research Methodology
        14.1.1 Methodology/Research Approach
        14.1.2 Data Source
    14.2 Author Details
    14.3 Disclaimer
List of Tables and Figures

    Figure N-Butyl Acetate Product Picture
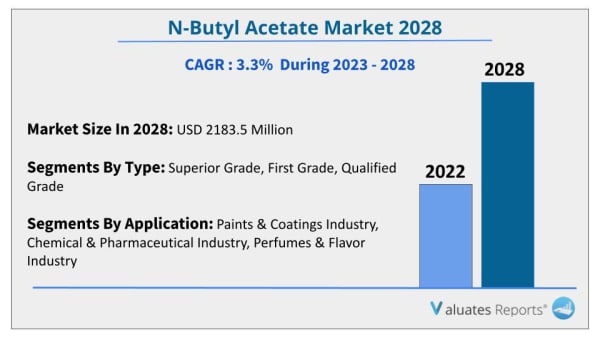
    Table N-Butyl Acetate Key Market Segments in This Study
    Table Key Manufacturers N-Butyl Acetate Covered in This Study
    Table Global N-Butyl Acetate Market Size Growth Rate by Type 2019-2025 (K MT) & (Million US$)
    Figure Global N-Butyl Acetate Production Market Share 2014-2025
    Figure Superior Grade Product Picture
    Table Major Manufacturers of Superior Grade
    Figure First Grade Product Picture
    Table Major Manufacturers of First Grade
    Figure Qualified Grade Product Picture
    Table Major Manufacturers of Qualified Grade
   Table Global N-Butyl Acetate Market Size Growth Rate by Application 2019-2025 (K MT)
    Figure Paints & Coatings Industry
    Figure Chemical & Pharmaceutical Industry
    Figure Perfumes & Flavor Industry
    Figure Others
    Figure N-Butyl Acetate Report Years Considered
    Figure Global N-Butyl Acetate Revenue 2014-2025 (Million US$)
    Figure Global N-Butyl Acetate Production 2014-2025 (K MT)
    Figure Global N-Butyl Acetate Capacity 2014-2025 (K MT)
    Table Key Manufacturers N-Butyl Acetate Capacity (K MT)
    Figure Global N-Butyl Acetate Price 2014-2025 (USD/MT)
    Table Global N-Butyl Acetate Market Size Growth Rate by Regions 2019-2025(K MT) & (Million US$)
    Table Global Manufacturers Market Concentration Ratio (CR5 and HHI)
    Table N-Butyl Acetate Manufacturing Base Distribution and Headquarters
    Table Manufacturers N-Butyl Acetate Product Offered
    Table Date of Manufacturers Enter into N-Butyl Acetate Market
    Table Global N-Butyl Acetate Production by Manufacturers (2014-2019) (K MT)
    Table Global N-Butyl Acetate Production Share by Manufacturers (2014-2019)
    Figure Global N-Butyl Acetate Production Share by Manufacturers in 2018
    Table N-Butyl Acetate Revenue by Manufacturers (2014-2019) (Million US$)
    Table N-Butyl Acetate Revenue Share by Manufacturers (2014-2019)
    Figure N-Butyl Acetate Value Share by Manufacturers in 2018
    Table N-Butyl Acetate Price by Manufacturers 2014-2019 (USD/MT)
    Table Mergers & Acquisitions, Expansion Plans
    Table Global N-Butyl Acetate Production by Regions 2014-2019 (K MT)
    Table Global N-Butyl Acetate Production Market Share by Regions 2014-2019
    Figure Global N-Butyl Acetate Production Market Share by Regions 2014-2019
    Figure Global N-Butyl Acetate Production Market Share by Regions in 2018
    Table Global N-Butyl Acetate Revenue by Regions 2014-2019 (Million US$)
    Table Global N-Butyl Acetate Revenue Market Share by Regions 2014-2019
    Figure Global N-Butyl Acetate Revenue Market Share by Regions 2014-2019
    Figure Global N-Butyl Acetate Revenue Market Share by Regions in 2018
    Figure United States N-Butyl Acetate Production and Growth Rate 2014-2019 (K MT)
    Figure United States N-Butyl Acetate Revenue and Growth Rate 2014-2019 (Million US$)
    Table United States N-Butyl Acetate Import & Export
    Figure Europe N-Butyl Acetate Production and Growth Rate 2014-2019 (K MT)
    Figure Europe N-Butyl Acetate Revenue and Growth Rate 2014-2019 (Million US$)
    Table Europe N-Butyl Acetate Import & Export
    Figure China N-Butyl Acetate Production and Growth Rate 2014-2019 (K MT)
    Figure China N-Butyl Acetate Revenue and Growth Rate 2014-2019 (Million US$)
    Table China N-Butyl Acetate Import & Export
    Figure Japan N-Butyl Acetate Production and Growth Rate 2014-2019 (K MT)
    Figure Japan N-Butyl Acetate Revenue and Growth Rate 2014-2019 (Million US$)
    Table Japan N-Butyl Acetate Import & Export
    Table Global N-Butyl Acetate Consumption by Regions 2014-2019 (K MT)
    Table Global N-Butyl Acetate Consumption Market Share by Regions 2014-2019
    Figure Global N-Butyl Acetate Consumption Market Share by Regions 2014-2019
    Figure Global N-Butyl Acetate Consumption Market Share by Regions in 2018
    Figure North America N-Butyl Acetate Consumption and Growth Rate (2014-2019) (K MT)
    Table North America N-Butyl Acetate Consumption by Application (2014-2019) (K MT)
    Figure 2018 North America N-Butyl Acetate Consumption Market Share by Application
    Table North America N-Butyl Acetate Consumption by Countries (2014-2019) (K MT)
    Figure 2018 North America N-Butyl Acetate Consumption Market Share by Countries
    Figure United States N-Butyl Acetate Consumption and Growth Rate (2014-2019) (K MT)
    Figure Canada N-Butyl Acetate Consumption (K MT) and Growth Rate (2014-2019)
    Figure Mexico N-Butyl Acetate Consumption (K MT) and Growth Rate (2014-2019)
    Figure Europe N-Butyl Acetate Consumption and Growth Rate (2014-2019) (K MT)
    Table Europe N-Butyl Acetate Consumption by Application (2014-2019) (K MT)
    Figure 2018 Europe N-Butyl Acetate Consumption Market Share by Application
    Table Europe N-Butyl Acetate Consumption by Countries (2014-2019) (K MT)
    Figure 2018 Europe N-Butyl Acetate Consumption Market Share by Countries
    Figure Germany N-Butyl Acetate Consumption and Growth Rate (2014-2019) (K MT)
    Figure France N-Butyl Acetate Consumption and Growth Rate (2014-2019) (K MT)
    Figure UK N-Butyl Acetate Consumption and Growth Rate (2014-2019) (K MT)
    Figure Italy N-Butyl Acetate Consumption and Growth Rate (2014-2019) (K MT)
    Figure Russia N-Butyl Acetate Consumption and Growth Rate (2014-2019) (K MT)
    Figure Asia Pacific N-Butyl Acetate Consumption and Growth Rate (2014-2019) (K MT)
    Table Asia Pacific N-Butyl Acetate Consumption by Application (2014-2019) (K MT)
    Table Asia Pacific N-Butyl Acetate Consumption Market Share by Application (2014-2019) (K MT)
    Table Asia Pacific N-Butyl Acetate Consumption by Countries (2014-2019) (K MT)
    Table Asia Pacific N-Butyl Acetate Consumption Market Share by Countries (2014-2019) (K MT)
    Figure China N-Butyl Acetate Consumption and Growth Rate (2014-2019) (K MT)
    Figure Japan N-Butyl Acetate Consumption and Growth Rate (2014-2019) (K MT)
    Figure Korea N-Butyl Acetate Consumption and Growth Rate (2014-2019) (K MT)
    Figure India N-Butyl Acetate Consumption and Growth Rate (2014-2019) (K MT)
    Figure Australia N-Butyl Acetate Consumption and Growth Rate (2014-2019) (K MT)
    Figure Indonesia N-Butyl Acetate Consumption and Growth Rate (2014-2019) (K MT)
    Figure Thailand N-Butyl Acetate Consumption and Growth Rate (2014-2019) (K MT)
    Figure Malaysia N-Butyl Acetate Consumption and Growth Rate (2014-2019) (K MT)
    Figure Philippines N-Butyl Acetate Consumption and Growth Rate (2014-2019) (K MT)
    Figure Vietnam N-Butyl Acetate Consumption and Growth Rate (2014-2019) (K MT)
    Figure Central & South America N-Butyl Acetate Consumption and Growth Rate (K MT)
    Table Central & South America N-Butyl Acetate Consumption by Application (2014-2019) (K MT)
    Figure 2017 Central & South America N-Butyl Acetate Consumption Market Share by Application
    Table Central & South America N-Butyl Acetate Consumption by Countries (2014-2019) (K MT)
    Figure Central & South America N-Butyl Acetate Consumption Market Share by Countries
    Figure Brazil N-Butyl Acetate Consumption and Growth Rate (2014-2019) (K MT)
    Figure Middle East and Africa N-Butyl Acetate Consumption and Growth Rate (K MT)
    Table Middle East and Africa N-Butyl Acetate Consumption by Application (2014-2019) (K MT)
    Figure 2018 Middle East and Africa N-Butyl Acetate Consumption Market Share by Application
    Table Middle East and Africa N-Butyl Acetate Consumption by Countries (2014-2019) (K MT)
    Figure Middle East and Africa N-Butyl Acetate Consumption Market Share by Countries
    Figure Turkey N-Butyl Acetate Consumption and Growth Rate (2014-2019) (K MT)
    Figure GCC Countries N-Butyl Acetate Consumption and Growth Rate (2014-2019) (K MT)
    Figure Egypt N-Butyl Acetate Consumption and Growth Rate (2014-2019) (K MT)
    Figure South Africa N-Butyl Acetate Consumption and Growth Rate (2014-2019) (K MT)
    Table Global N-Butyl Acetate Production by Type (2014-2019) (K MT)
    Table Global N-Butyl Acetate Production Share by Type (2014-2019)
    Figure Global N-Butyl Acetate Production Market Share by Type (2014-2019)
    Figure Global N-Butyl Acetate Production Market Share by Type in 2018
    Table Global N-Butyl Acetate Revenue by Type (2014-2019) (Million US$)
    Table Global N-Butyl Acetate Revenue Share by Type (2014-2019)
    Figure Global N-Butyl Acetate Revenue Market Share by Type (2014-2019)
    Figure Global N-Butyl Acetate Revenue Market Share by Type in 2018
    Table N-Butyl Acetate Price by Type 2014-2019 (USD/MT)
    Table Global N-Butyl Acetate Consumption by Application (2014-2025) (K MT)
    Table Global N-Butyl Acetate Consumption by Application (2014-2019) (K MT)
    Table Global N-Butyl Acetate Consumption Share by Application (2014-2019)
    Figure Global N-Butyl Acetate Consumption Market Share by Application (2014-2019)
    Figure Global N-Butyl Acetate Value (Consumption) Market Share by Application (2014-2019)
    Table OXEA Company Details
    Table OXEA N-Butyl Acetate Capacity, Production (K MT), Revenue (Million US$), Price (USD/MT) and Gross Margin (2014-2019)
    Figure OXEA N-Butyl Acetate Production Growth Rate (2014-2019)
    Figure OXEA N-Butyl Acetate Production Market Share in Global Market
    Table OXEA N-Butyl Acetate SWOT Analysis
    Table BASF Company Details
    Table BASF N-Butyl Acetate Capacity, Production (K MT), Revenue (Million US$), Price (USD/MT) and Gross Margin (2014-2019)
    Figure BASF N-Butyl Acetate Production Growth Rate (2014-2019)
    Figure BASF N-Butyl Acetate Production Market Share in Global Market
    Table BASF N-Butyl Acetate SWOT Analysis
    Table Ineos Oxide Company Details
    Table Ineos Oxide N-Butyl Acetate Capacity, Production (K MT), Revenue (Million US$), Price (USD/MT) and Gross Margin (2014-2019)
    Figure Ineos Oxide N-Butyl Acetate Production Growth Rate (2014-2019)
    Figure Ineos Oxide N-Butyl Acetate Production Market Share in Global Market
    Table Ineos Oxide N-Butyl Acetate SWOT Analysis
    Table DOW Company Details
    Table DOW N-Butyl Acetate Capacity, Production (K MT), Revenue (Million US$), Price (USD/MT) and Gross Margin (2014-2019)
    Figure DOW N-Butyl Acetate Production Growth Rate (2014-2019)
    Figure DOW N-Butyl Acetate Production Market Share in Global Market
    Table DOW N-Butyl Acetate SWOT Analysis
    Table PETRONAS Company Details
    Table PETRONAS N-Butyl Acetate Capacity, Production (K MT), Revenue (Million US$), Price (USD/MT) and Gross Margin (2014-2019)
    Figure PETRONAS N-Butyl Acetate Production Growth Rate (2014-2019)
    Figure PETRONAS N-Butyl Acetate Production Market Share in Global Market
    Table PETRONAS N-Butyl Acetate SWOT Analysis
    Table Eastman Company Details
    Table Eastman N-Butyl Acetate Capacity, Production (K MT), Revenue (Million US$), Price (USD/MT) and Gross Margin (2014-2019)
    Figure Eastman N-Butyl Acetate Production Growth Rate (2014-2019)
    Figure Eastman N-Butyl Acetate Production Market Share in Global Market
    Table Eastman N-Butyl Acetate SWOT Analysis
    Table KH Neochem Company Details
    Table KH Neochem N-Butyl Acetate Capacity, Production (K MT), Revenue (Million US$), Price (USD/MT) and Gross Margin (2014-2019)
    Figure KH Neochem N-Butyl Acetate Production Growth Rate (2014-2019)
    Figure KH Neochem N-Butyl Acetate Production Market Share in Global Market
    Table KH Neochem N-Butyl Acetate SWOT Analysis
    Table Celanese Corporation Company Details
    Table Celanese Corporation N-Butyl Acetate Capacity, Production (K MT), Revenue (Million US$), Price (USD/MT) and Gross Margin (2014-2019)
    Figure Celanese Corporation N-Butyl Acetate Production Growth Rate (2014-2019)
    Figure Celanese Corporation N-Butyl Acetate Production Market Share in Global Market
    Table Celanese Corporation N-Butyl Acetate SWOT Analysis
    Table Carbohim Company Details
    Table Carbohim N-Butyl Acetate Capacity, Production (K MT), Revenue (Million US$), Price (USD/MT) and Gross Margin (2014-2019)
    Figure Carbohim N-Butyl Acetate Production Growth Rate (2014-2019)
    Figure Carbohim N-Butyl Acetate Production Market Share in Global Market
    Table Carbohim N-Butyl Acetate SWOT Analysis
    Table Korea Alcohol Industrial Company Details
    Table Korea Alcohol Industrial N-Butyl Acetate Capacity, Production (K MT), Revenue (Million US$), Price (USD/MT) and Gross Margin (2014-2019)
    Figure Korea Alcohol Industrial N-Butyl Acetate Production Growth Rate (2014-2019)
    Figure Korea Alcohol Industrial N-Butyl Acetate Production Market Share in Global Market
    Table Korea Alcohol Industrial N-Butyl Acetate SWOT Analysis
    Table Baichuan Company Details
    Table Handsome Company Details
    Table Yankuang Company Details
    Table Jinyinmeng Company Details
    Table Sanmu Company Details
    Table Chang Chun Petrochemical Company Details
    Table Longtian Company Details
    Table Shiny Chemical Company Details
    Table Jidong Solvent Company Details
    Figure Global N-Butyl Acetate Production Forecast 2019-2025 (K MT)
    Figure Global N-Butyl Acetate Revenue Forecast 2019-2025 (Million US$)
    Table Global N-Butyl Acetate Revenue Forecast 2019-2025 (Million US$)
    Table Global N-Butyl Acetate Revenue Forecast by Regions 2019-2025 (Million US$)
    Figure Global N-Butyl Acetate Revenue Forecast by Regions 2019-2025 (Million US$)
    Figure Global N-Butyl Acetate Revenue Market Share Forecast by Regions 2019-2025
    Table Global N-Butyl Acetate Production Forecast by Regions 2019-2025 (K MT)
    Figure Global N-Butyl Acetate Production Forecast by Regions 2019-2025 (K MT)
    Figure Global N-Butyl Acetate Production Market Share Forecast by Regions 2019-2025
    Figure United States N-Butyl Acetate Production Forecast 2019-2025 (K MT)
    Figure United States N-Butyl Acetate Revenue Forecast 2019-2025 (Million US$)
    Figure Europe N-Butyl Acetate Production Forecast 2019-2025 (K MT)
    Figure Europe N-Butyl Acetate Revenue Forecast 2019-2025 (Million US$)
    Figure China N-Butyl Acetate Production Forecast 2019-2025 (K MT)
    Figure China N-Butyl Acetate Revenue Forecast 2019-2025 (Million US$)
    Figure Japan N-Butyl Acetate Production Forecast 2019-2025 (K MT)
    Figure Japan N-Butyl Acetate Revenue Forecast 2019-2025 (Million US$)
    Table Global N-Butyl Acetate Production Forecast by Type 2019-2025 (K MT)
    Figure Global N-Butyl Acetate Production Forecast by Type 2019-2025 (K MT)
    Figure Global N-Butyl Acetate Production Market Share Forecast by Type 2019-2025
    Table Global N-Butyl Acetate Revenue Forecast by Type 2019-2025 (Million US$)
    Figure Global N-Butyl Acetate Revenue Forecast by Type 2019-2025 (Million US$)
    Figure Global N-Butyl Acetate Revenue Market Share Forecast by Type 2019-2025
    Table Global N-Butyl Acetate Consumption Forecast by Application 2019-2025 (K MT)
    Figure Global N-Butyl Acetate Consumption Forecast by Application 2019-2025 (K MT)
    Figure Global N-Butyl Acetate Consumption Market Share Forecast by Application 2019-2025
    Table Global N-Butyl Acetate Consumption Forecast by Regions 2019-2025 (K MT)
    Figure Global N-Butyl Acetate Consumption Forecast by Regions 2019-2025 (K MT)
    Figure Global N-Butyl Acetate Consumption Market Share Forecast by Regions 2019-2025
    Table North America N-Butyl Acetate Consumption Forecast by Regions 2019-2025 (K MT)
    Figure United States N-Butyl Acetate Consumption Forecast 2019-2025 (K MT)
    Figure Canada N-Butyl Acetate Consumption Forecast 2019-2025 (K MT)
    Figure MexicoN-Butyl Acetate Consumption Forecast 2019-2025 (K MT)
    Table Europe N-Butyl Acetate Consumption Forecast by Regions 2019-2025 (K MT)
    Figure Germany N-Butyl Acetate Consumption Forecast 2019-2025 (K MT)
    Figure France N-Butyl Acetate Consumption Forecast 2019-2025 (K MT)
    Figure UK N-Butyl Acetate Consumption Forecast 2019-2025 (K MT)
    Figure Italy N-Butyl Acetate Consumption Forecast 2019-2025 (K MT)
    Figure Russia N-Butyl Acetate Consumption Forecast 2019-2025 (K MT)
    Table Asia Pacific N-Butyl Acetate Consumption Forecast by Regions 2019-2025 (K MT)
    Figure China N-Butyl Acetate Consumption Forecast 2019-2025 (K MT)
    Figure Japan N-Butyl Acetate Consumption Forecast 2019-2025 (K MT)
    Figure Korea N-Butyl Acetate Consumption Forecast 2019-2025 (K MT)
    Figure India N-Butyl Acetate Consumption Forecast 2019-2025 (K MT)
    Figure Australia N-Butyl Acetate Consumption Forecast 2019-2025 (K MT)
    Figure Indonesia N-Butyl Acetate Consumption Forecast 2019-2025 (K MT)
    Figure Thailand N-Butyl Acetate Consumption Forecast 2019-2025 (K MT)
    Figure Malaysia N-Butyl Acetate Consumption Forecast 2019-2025 (K MT)
    Figure Philippines N-Butyl Acetate Consumption Forecast 2019-2025 (K MT)
    Figure Vietnam N-Butyl Acetate Consumption Forecast 2019-2025 (K MT)
    Table Central & South America N-Butyl Acetate Consumption Forecast by Regions 2019-2025 (K MT)
    Figure Brazil N-Butyl Acetate Consumption Forecast 2019-2025 (K MT)
    Table Middle East and Africa N-Butyl Acetate Consumption Forecast by Regions 2019-2025 (K MT)
    Figure Middle East and Africa N-Butyl Acetate Consumption Forecast 2019-2025 (K MT)
    Figure Turkey N-Butyl Acetate Consumption Forecast 2019-2025 (K MT)
    Figure GCC Countries N-Butyl Acetate Consumption Forecast 2019-2025 (K MT)
    Figure Egypt N-Butyl Acetate Consumption Forecast 2019-2025 (K MT)
    Figure South Africa N-Butyl Acetate Consumption Forecast 2019-2025 (K MT)
    Table N-Butyl Acetate Key Raw Material
    Table Typical Suppliers of Key N-Butyl Acetate Raw Material
    Figure N-Butyl Acetate Industry Chain
    Table Distributors/Traders List
    Table N-Butyl Acetate Customers List
    Table Porter’s Five Forces Analysis
    Table Research Programs/Design for This Report
    Figure Bottom-up and Top-down Approaches for This Report
    Figure Data Triangulation
    Table Key Data Information from Secondary Sources
    Table Key Data Information from Primary Sources
SELECT A FORMAT
Added to Cart
Electronic (PDF)

$4900

This license allows only one user to access the PDF.
Electronic (PDF)

$9800

This license allows users/teams in a same Enterprise to use this report, various departments within an enterpise can use this report
Add to Cart
Buy Now (15% Discount)

OUR CUSTOMER

Seventh Sense AI

RELATED REPORTS

Global PVD Coating Material Market Research Report 2024

120 Pages
Type: Report
Code: QYRE-Auto-32N8296
Wed Apr 17 00:00:00 UTC 2024

Add to Cart

Global Poly(tetramethylene ether)glycol Market Research Report 2024

120 Pages
Type: Report
Code: QYRE-Auto-34S13095
Wed Apr 17 00:00:00 UTC 2024

Add to Cart

Global PTFE Products Market Research Report 2024

120 Pages
Type: Report
Code: QYRE-Auto-39B8269
Wed Apr 17 00:00:00 UTC 2024

Add to Cart

Global Formaldehyde Analyzer Market Research Report 2024

120 Pages
Type: Report
Code: QYRE-Auto-10G8465
Wed Apr 17 00:00:00 UTC 2024

Add to Cart