
A mattress is a large pad for supporting the reclining body, used as or on a bed. Mattresses may consist of a quilted or similarly fastened case, usually of heavy cloth, that contains hair, straw, cotton, foam rubber, etc.; a framework of metal springs; or they may be inflatable.
Due to the COVID-19 pandemic, the global Mattresses market size is estimated to be worth USD 25560 Million in 2022 and is forecast to a readjusted size of USD 34640 Million by 2028 with a CAGR of 5.2% during the review period. As a result of expanding product demand from the real estate sector to satisfy the needs of the residential market, sales of mattresses, pillows, and other home furnishings have increased.
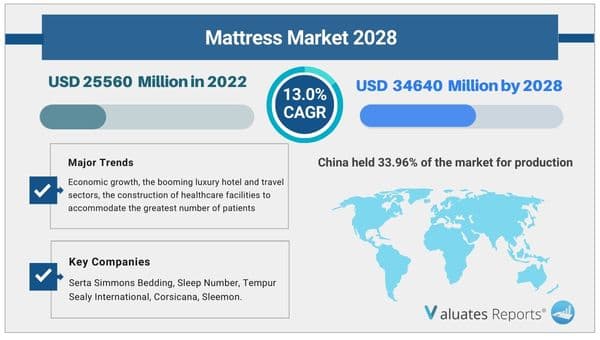
The construction of healthcare facilities to house the highest num ber of patients, economic expansion, the rising luxury hotel and travel sectors, and other reasons are predicted to accelerate the growth of the Mattresses market.
Consumer willingness to spend money on sleep solutions has changed significantly across the globe, not just in major cities but also in smaller cities and villages. People's desire to conduct in-depth research, weigh prices, and make thoughtful decisions when purchasing mattresses and other sleep solutions has dramatically increased with growing knowledge. This element is anticipated to fuel the mattress market's expansion.
Custom-made and customisable goods will affect the expansion of the mattress market. Customizable mattresses have grown in popularity over the past 10 years. Customers who buy these devices can choose from a large selection of pre-set choices, including design, height, firmness, and toppings. Leading industry players have recently introduced cutting-edge items to strengthen their brand names. Other important industry players are predicted to tap into the market potential in this sector as demand for custom/customizable products increases across the globe.
The global housing construction boom and rising consumer spending on bedding and home furnishings are both major drivers of the mattress market. Due to the rise in single-occupancy homes and nuclear families worldwide, each family member needs their own room, which drives rising demand for the product.
The increase in the number of luxury hotels in the United States is also projected to have a significant impact on Mattress Market Growth because of the higher caliber of the bedding utilized in these hotels. It is anticipated that the price differential between these items and traditional bedding will benefit the mattress business.
China accounted for 33.96% of global production in 2017. The next two regions, North America and Europe, account for around 24.60% and 16.42% of the global industry, respectively. Other countries have less manufacturing. Geographically, North America and China accounted for around 26.69% and 26.65% of the total volume of worldwide consumption, respectively, in 2017.
The authors of this study have enlightened the readers on the rise and effect of the Covid-19 outbreak on the development. They have investigated the changes brought about in the demand/supply side, consumption, supply chain, and sales/manufacturing. The readers will get familiar with the measures that have helped the key players to bring the Mattresses market back to the pre-covid levels.
In this segment of the report, the specialists have delved into the key growth opportunities that are likely to emerge. This will aid the key players to simplify complex issues related to business and frame future strategies to compete in this competitive environment. This section will certainly assist the players to boldly position their business.
|
Report Metric |
Details |
|
Report Name |
Mattress Market |
|
Market size value in 2022 |
USD 25560 Million |
|
Revenue forecast in 2028 |
USD 34640 Million |
|
Growth Rate |
CAGR 5.2% |
|
Base year considered |
2022 |
|
Forecast Period |
2023-2028 |
|
By Type |
Foam Mattress, Latex Mattress, Innerspring Mattress |
|
By Application |
Private Households, Hotels, Hospitals |
|
Report Coverage |
Revenue & volume forecast, company share, competitive landscape, growth factors, and trends |
|
Segments Covered |
By Type, Application, and Region |
|
Geographic Regions Covered |
North America, Europe, Asia Pacific, Latin America, Middle East & Africa |
Ans. Yes, we do provide the option to buy chapters in a report. We also can customize the report based on your specific requirements.
Ans. Due to the COVID-19 pandemic, the global Mattresses market size is estimated to be worth US$ 25560 million in 2022 and is forecast to a readjusted size of US$ 34640 million by 2028 with a CAGR of 5.2% during the review period.
Ans. Yes, the report includes a COVID-19 impact analysis. Also, it is further extended into every individual segment of the report.
List of Tables
Table 1. Global Mattresses Market Size Growth Rate by Type, 2017 VS 2021 VS 2028 (US$ Million)
Table 2. Major Manufacturers of Innerspring Mattress
Table 3. Major Manufacturers of Foam Mattress
Table 4. Major Manufacturers of Latex Mattress
Table 5. Major Manufacturers of Others
Table 6. Global Mattresses Market Size Growth Rate by Application, 2017 VS 2021 VS 2028 (US$ Million)
Table 7. Global Mattresses Revenue by Region: 2017 VS 2021 VS 2028 (US$ Million)
Table 8. Global Mattresses Sales by Region (2017-2022) & (K Units)
Table 9. Global Mattresses Sales Market Share by Region (2017-2022)
Table 10. Global Mattresses Sales by Region (2023-2028) & (K Units)
Table 11. Global Mattresses Sales Market Share by Region (2023-2028)
Table 12. Global Mattresses Revenue by Region (2017-2022) & (US$ Million)
Table 13. Global Mattresses Revenue Market Share by Region (2017-2022)
Table 14. Global Mattresses Revenue by Region (2023-2028) & (US$ Million)
Table 15. Global Mattresses Revenue Market Share by Region (2023-2028)
Table 16. Global Mattresses Sales by Manufacturers (2017-2022) & (K Units)
Table 17. Global Mattresses Sales Share by Manufacturers (2017-2022)
Table 18. Global Mattresses Revenue by Manufacturers (2017-2022) & (US$ Million)
Table 19. Global Mattresses Revenue Share by Manufacturers (2017-2022)
Table 20. Mattresses Price by Manufacturers (2017-2022) &(USD/Unit)
Table 21. Global Mattresses Manufacturers Market Concentration Ratio (CR5 and HHI)
Table 22. Global Mattresses by Company Type (Tier 1, Tier 2, and Tier 3) & (based on the Revenue in Mattresses as of 2021)
Table 23. Mattresses Manufacturing Base Distribution and Headquarters
Table 24. Manufacturers Mattresses Product Offered
Table 25. Date of Manufacturers Enter into Mattresses Market
Table 26. Mergers & Acquisitions, Expansion Plans
Table 27. Global Mattresses Sales by Type (2017-2022) & (K Units)
Table 28. Global Mattresses Sales by Type (2023-2028) & (K Units)
Table 29. Global Mattresses Sales Share by Type (2017-2022)
Table 30. Global Mattresses Sales Share by Type (2023-2028)
Table 31. Global Mattresses Revenue by Type (2017-2022) & (US$ Million)
Table 32. Global Mattresses Revenue by Type (2023-2028) & (US$ Million)
Table 33. Global Mattresses Revenue Share by Type (2017-2022)
Table 34. Global Mattresses Revenue Share by Type (2023-2028)
Table 35. Mattresses Price by Type (2017-2022) & (USD/Unit)
Table 36. Global Mattresses Price Forecast by Type (2023-2028) & (USD/Unit)
Table 37. Global Mattresses Sales by Application (2017-2022) & (K Units)
Table 38. Global Mattresses Sales by Application (2023-2028) & (K Units)
Table 39. Global Mattresses Sales Share by Application (2017-2022)
Table 40. Global Mattresses Sales Share by Application (2023-2028)
Table 41. Global Mattresses Revenue by Application (2017-2022) & (US$ Million)
Table 42. Global Mattresses Revenue by Application (2023-2028) & (US$ Million)
Table 43. Global Mattresses Revenue Share by Application (2017-2022)
Table 44. Global Mattresses Revenue Share by Application (2023-2028)
Table 45. Mattresses Price by Application (2017-2022) & (USD/Unit)
Table 46. Global Mattresses Price Forecast by Application (2023-2028) & (USD/Unit)
Table 47. North America Mattresses Sales by Type (2017-2022) & (K Units)
Table 48. North America Mattresses Sales by Type (2023-2028) & (K Units)
Table 49. North America Mattresses Revenue by Type (2017-2022) & (US$ Million)
Table 50. North America Mattresses Revenue by Type (2023-2028) & (US$ Million)
Table 51. North America Mattresses Sales by Application (2017-2022) & (K Units)
Table 52. North America Mattresses Sales by Application (2023-2028) & (K Units)
Table 53. North America Mattresses Revenue by Application (2017-2022) & (US$ Million)
Table 54. North America Mattresses Revenue by Application (2023-2028) & (US$ Million)
Table 55. North America Mattresses Sales by Country (2017-2022) & (K Units)
Table 56. North America Mattresses Sales by Country (2023-2028) & (K Units)
Table 57. North America Mattresses Revenue by Country (2017-2022) & (US$ Million)
Table 58. North America Mattresses Revenue by Country (2023-2028) & (US$ Million)
Table 59. Europe Mattresses Sales by Type (2017-2022) & (K Units)
Table 60. Europe Mattresses Sales by Type (2023-2028) & (K Units)
Table 61. Europe Mattresses Revenue by Type (2017-2022) & (US$ Million)
Table 62. Europe Mattresses Revenue by Type (2023-2028) & (US$ Million)
Table 63. Europe Mattresses Sales by Application (2017-2022) & (K Units)
Table 64. Europe Mattresses Sales by Application (2023-2028) & (K Units)
Table 65. Europe Mattresses Revenue by Application (2017-2022) & (US$ Million)
Table 66. Europe Mattresses Revenue by Application (2023-2028) & (US$ Million)
Table 67. Europe Mattresses Sales by Country (2017-2022) & (K Units)
Table 68. Europe Mattresses Sales by Country (2023-2028) & (K Units)
Table 69. Europe Mattresses Revenue by Country (2017-2022) & (US$ Million)
Table 70. Europe Mattresses Revenue by Country (2023-2028) & (US$ Million)
Table 71. Asia Pacific Mattresses Sales by Type (2017-2022) & (K Units)
Table 72. Asia Pacific Mattresses Sales by Type (2023-2028) & (K Units)
Table 73. Asia Pacific Mattresses Revenue by Type (2017-2022) & (US$ Million)
Table 74. Asia Pacific Mattresses Revenue by Type (2023-2028) & (US$ Million)
Table 75. Asia Pacific Mattresses Sales by Application (2017-2022) & (K Units)
Table 76. Asia Pacific Mattresses Sales by Application (2023-2028) & (K Units)
Table 77. Asia Pacific Mattresses Revenue by Application (2017-2022) & (US$ Million)
Table 78. Asia Pacific Mattresses Revenue by Application (2023-2028) & (US$ Million)
Table 79. Asia Pacific Mattresses Sales by Region (2017-2022) & (K Units)
Table 80. Asia Pacific Mattresses Sales by Region (2023-2028) & (K Units)
Table 81. Asia Pacific Mattresses Revenue by Region (2017-2022) & (US$ Million)
Table 82. Asia Pacific Mattresses Revenue by Region (2023-2028) & (US$ Million)
Table 83. Latin America Mattresses Sales by Type (2017-2022) & (K Units)
Table 84. Latin America Mattresses Sales by Type (2023-2028) & (K Units)
Table 85. Latin America Mattresses Revenue by Type (2017-2022) & (US$ Million)
Table 86. Latin America Mattresses Revenue by Type (2023-2028) & (US$ Million)
Table 87. Latin America Mattresses Sales by Application (2017-2022) & (K Units)
Table 88. Latin America Mattresses Sales by Application (2023-2028) & (K Units)
Table 89. Latin America Mattresses Revenue by Application (2017-2022) & (US$ Million)
Table 90. Latin America Mattresses Revenue by Application (2023-2028) & (US$ Million)
Table 91. Latin America Mattresses Sales by Country (2017-2022) & (K Units)
Table 92. Latin America Mattresses Sales by Country (2023-2028) & (K Units)
Table 93. Latin America Mattresses Revenue by Country (2017-2022) & (US$ Million)
Table 94. Latin America Mattresses Revenue by Country (2023-2028) & (US$ Million)
Table 95. Middle East and Africa Mattresses Sales by Type (2017-2022) & (K Units)
Table 96. Middle East and Africa Mattresses Sales by Type (2023-2028) & (K Units)
Table 97. Middle East and Africa Mattresses Revenue by Type (2017-2022) & (US$ Million)
Table 98. Middle East and Africa Mattresses Revenue by Type (2023-2028) & (US$ Million)
Table 99. Middle East and Africa Mattresses Sales by Application (2017-2022) & (K Units)
Table 100. Middle East and Africa Mattresses Sales by Application (2023-2028) & (K Units)
Table 101. Middle East and Africa Mattresses Revenue by Application (2017-2022) & (US$ Million)
Table 102. Middle East and Africa Mattresses Revenue by Application (2023-2028) & (US$ Million)
Table 103. Middle East and Africa Mattresses Sales by Country (2017-2022) & (K Units)
Table 104. Middle East and Africa Mattresses Sales by Country (2023-2028) & (K Units)
Table 105. Middle East and Africa Mattresses Revenue by Country (2017-2022) & (US$ Million)
Table 106. Middle East and Africa Mattresses Revenue by Country (2023-2028) & (US$ Million)
Table 107. Serta Simmons Bedding Corporation Information
Table 108. Serta Simmons Bedding Description and Major Businesses
Table 109. Serta Simmons Bedding Mattresses Sales (K Units), Revenue (US$ Million), Price (USD/Unit) and Gross Margin (2017-2022)
Table 110. Serta Simmons Bedding Mattresses Product Model Numbers, Pictures, Descriptions and Specifications
Table 111. Serta Simmons Bedding Recent Developments
Table 112. Tempur Sealy International Corporation Information
Table 113. Tempur Sealy International Description and Major Businesses
Table 114. Tempur Sealy International Mattresses Sales (K Units), Revenue (US$ Million), Price (USD/Unit) and Gross Margin (2017-2022)
Table 115. Tempur Sealy International Mattresses Product Model Numbers, Pictures, Descriptions and Specifications
Table 116. Tempur Sealy International Recent Developments
Table 117. Sleep Number Corporation Information
Table 118. Sleep Number Description and Major Businesses
Table 119. Sleep Number Mattresses Sales (K Units), Revenue (US$ Million), Price (USD/Unit) and Gross Margin (2017-2022)
Table 120. Sleep Number Mattresses Product Model Numbers, Pictures, Descriptions and Specifications
Table 121. Sleep Number Recent Developments
Table 122. Hilding Anders Corporation Information
Table 123. Hilding Anders Description and Major Businesses
Table 124. Hilding Anders Mattresses Sales (K Units), Revenue (US$ Million), Price (USD/Unit) and Gross Margin (2017-2022)
Table 125. Hilding Anders Mattresses Product Model Numbers, Pictures, Descriptions and Specifications
Table 126. Hilding Anders Recent Developments
Table 127. Corsicana Corporation Information
Table 128. Corsicana Description and Major Businesses
Table 129. Corsicana Mattresses Sales (K Units), Revenue (US$ Million), Price (USD/Unit) and Gross Margin (2017-2022)
Table 130. Corsicana Mattresses Product Model Numbers, Pictures, Descriptions and Specifications
Table 131. Corsicana Recent Developments
Table 132. Ruf-Betten Corporation Information
Table 133. Ruf-Betten Description and Major Businesses
Table 134. Ruf-Betten Mattresses Sales (K Units), Revenue (US$ Million), Price (USD/Unit) and Gross Margin (2017-2022)
Table 135. Ruf-Betten Mattresses Product Model Numbers, Pictures, Descriptions and Specifications
Table 136. Ruf-Betten Recent Developments
Table 137. Recticel Corporation Information
Table 138. Recticel Description and Major Businesses
Table 139. Recticel Mattresses Sales (K Units), Revenue (US$ Million), Price (USD/Unit) and Gross Margin (2017-2022)
Table 140. Recticel Mattresses Product Model Numbers, Pictures, Descriptions and Specifications
Table 141. Recticel Recent Developments
Table 142. Derucci Corporation Information
Table 143. Derucci Description and Major Businesses
Table 144. Derucci Mattresses Sales (K Units), Revenue (US$ Million), Price (USD/Unit) and Gross Margin (2017-2022)
Table 145. Derucci Mattresses Product Model Numbers, Pictures, Descriptions and Specifications
Table 146. Derucci Recent Developments
Table 147. Sleemon Corporation Information
Table 148. Sleemon Description and Major Businesses
Table 149. Sleemon Mattresses Sales (K Units), Revenue (US$ Million), Price (USD/Unit) and Gross Margin (2017-2022)
Table 150. Sleemon Mattresses Product Model Numbers, Pictures, Descriptions and Specifications
Table 151. Sleemon Recent Developments
Table 152. MLILY Corporation Information
Table 153. MLILY Description and Major Businesses
Table 154. MLILY Mattresses Sales (K Units), Revenue (US$ Million), Price (USD/Unit) and Gross Margin (2017-2022)
Table 155. MLILY Mattresses Product Model Numbers, Pictures, Descriptions and Specifications
Table 156. MLILY Recent Developments
Table 157. Therapedic Corporation Information
Table 158. Therapedic Description and Major Businesses
Table 159. Therapedic Mattresses Sales (K Units), Revenue (US$ Million), Price (USD/Unit) and Gross Margin (2017-2022)
Table 160. Therapedic Mattresses Product Model Numbers, Pictures, Descriptions and Specifications
Table 161. Therapedic Recent Developments
Table 162. Ashley Corporation Information
Table 163. Ashley Description and Major Businesses
Table 164. Ashley Mattresses Sales (K Units), Revenue (US$ Million), Price (USD/Unit) and Gross Margin (2017-2022)
Table 165. Ashley Mattresses Product Model Numbers, Pictures, Descriptions and Specifications
Table 166. Ashley Recent Developments
Table 167. Breckle Corporation Information
Table 168. Breckle Description and Major Businesses
Table 169. Breckle Mattresses Sales (K Units), Revenue (US$ Million), Price (USD/Unit) and Gross Margin (2017-2022)
Table 170. Breckle Mattresses Product Model Numbers, Pictures, Descriptions and Specifications
Table 171. Breckle Recent Developments
Table 172. King Koil Corporation Information
Table 173. King Koil Description and Major Businesses
Table 174. King Koil Mattresses Sales (K Units), Revenue (US$ Million), Price (USD/Unit) and Gross Margin (2017-2022)
Table 175. King Koil Mattresses Product Model Numbers, Pictures, Descriptions and Specifications
Table 176. King Koil Recent Developments
Table 177. Pikolin Corporation Information
Table 178. Pikolin Description and Major Businesses
Table 179. Pikolin Mattresses Sales (K Units), Revenue (US$ Million), Price (USD/Unit) and Gross Margin (2017-2022)
Table 180. Pikolin Mattresses Product Model Numbers, Pictures, Descriptions and Specifications
Table 181. Pikolin Recent Developments
Table 182. Mengshen Corporation Information
Table 183. Mengshen Description and Major Businesses
Table 184. Mengshen Mattresses Sales (K Units), Revenue (US$ Million), Price (USD/Unit) and Gross Margin (2017-2022)
Table 185. Mengshen Mattresses Product Model Numbers, Pictures, Descriptions and Specifications
Table 186. Mengshen Recent Developments
Table 187. Lianle Corporation Information
Table 188. Lianle Description and Major Businesses
Table 189. Lianle Mattresses Sales (K Units), Revenue (US$ Million), Price (USD/Unit) and Gross Margin (2017-2022)
Table 190. Lianle Mattresses Product Model Numbers, Pictures, Descriptions and Specifications
Table 191. Lianle Recent Developments
Table 192. Airland Corporation Information
Table 193. Airland Description and Major Businesses
Table 194. Airland Mattresses Sales (K Units), Revenue (US$ Million), Price (USD/Unit) and Gross Margin (2017-2022)
Table 195. Airland Mattresses Product Model Numbers, Pictures, Descriptions and Specifications
Table 196. Airland Recent Developments
Table 197. Key Raw Materials Lists
Table 198. Raw Materials Key Suppliers Lists
Table 199. Mattresses Distributors List
Table 200. Mattresses Customers List
Table 201. Mattresses Market Trends
Table 202. Mattresses Market Drivers
Table 203. Mattresses Market Challenges
Table 204. Mattresses Market Restraints
Table 205. Research Programs/Design for This Report
Table 206. Key Data Information from Secondary Sources
Table 207. Key Data Information from Primary Sources
List of Figures
Figure 1. Mattresses Product Picture
Figure 3. Global Mattresses Market Share by Type in 2021 & 2028
Figure 3. Innerspring Mattress Product Picture
Figure 4. Foam Mattress Product Picture
Figure 5. Latex Mattress Product Picture
Figure 6. Others Product Picture
Figure 7. Global Mattresses Market Share by Application in 2021 & 2028
Figure 8. Private Households
Figure 9. Hotels
Figure 10. Hospitals
Figure 11. Others
Figure 12. Mattresses Report Years Considered
Figure 13. Global Mattresses Sales 2017-2028 (K Units)
Figure 14. Global Mattresses Revenue, (US$ Million), 2017 VS 2021 VS 2028
Figure 15. Global Mattresses Revenue 2017-2028 (US$ Million)
Figure 16. Global Mattresses Revenue Market Share by Region in Percentage: 2021 Versus 2028
Figure 17. Global Mattresses Sales Market Share by Region (2017-2022)
Figure 18. Global Mattresses Sales Market Share by Region (2023-2028)
Figure 19. North America Mattresses Sales YoY (2017-2028) & (K Units)
Figure 20. North America Mattresses Revenue YoY (2017-2028) & (US$ Million)
Figure 21. Europe Mattresses Sales YoY (2017-2028) & (K Units)
Figure 22. Europe Mattresses Revenue YoY (2017-2028) & (US$ Million)
Figure 23. Asia-Pacific Mattresses Sales YoY (2017-2028) & (K Units)
Figure 24. Asia-Pacific Mattresses Revenue YoY (2017-2028) & (US$ Million)
Figure 25. Latin America Mattresses Sales YoY (2017-2028) & (K Units)
Figure 26. Latin America Mattresses Revenue YoY (2017-2028) & (US$ Million)
Figure 27. Middle East & Africa Mattresses Sales YoY (2017-2028) & (K Units)
Figure 28. Middle East & Africa Mattresses Revenue YoY (2017-2028) & (US$ Million)
Figure 29. The Mattresses Market Share of Top 10 and Top 5 Largest Manufacturers Around the World in 2021
Figure 30. The Top 5 and 10 Largest Manufacturers of Mattresses in the World: Market Share by Mattresses Revenue in 2021
Figure 31. Global Mattresses Market Share by Company Type (Tier 1, Tier 2, and Tier 3): 2017 VS 2021
Figure 32. Global Mattresses Sales Market Share by Type (2017-2028)
Figure 33. Global Mattresses Revenue Market Share by Type (2017-2028)
Figure 34. Global Mattresses Sales Market Share by Application (2017-2028)
Figure 35. Global Mattresses Revenue Market Share by Application (2017-2028)
Figure 36. North America Mattresses Sales Market Share by Type (2017-2028)
Figure 37. North America Mattresses Revenue Market Share by Type (2017-2028)
Figure 38. North America Mattresses Sales Market Share by Application (2017-2028)
Figure 39. North America Mattresses Revenue Market Share by Application (2017-2028)
Figure 40. North America Mattresses Sales Share by Country (2017-2028)
Figure 41. North America Mattresses Revenue Share by Country (2017-2028)
Figure 42. U.S. Mattresses Revenue (2017-2028) & (US$ Million)
Figure 43. Canada Mattresses Revenue (2017-2028) & (US$ Million)
Figure 44. Europe Mattresses Sales Market Share by Type (2017-2028)
Figure 45. Europe Mattresses Revenue Market Share by Type (2017-2028)
Figure 46. Europe Mattresses Sales Market Share by Application (2017-2028)
Figure 47. Europe Mattresses Revenue Market Share by Application (2017-2028)
Figure 48. Europe Mattresses Sales Share by Country (2017-2028)
Figure 49. Europe Mattresses Revenue Share by Country (2017-2028)
Figure 50. Germany Mattresses Revenue (2017-2028) & (US$ Million)
Figure 51. France Mattresses Revenue (2017-2028) & (US$ Million)
Figure 52. U.K. Mattresses Revenue (2017-2028) & (US$ Million)
Figure 53. Italy Mattresses Revenue (2017-2028) & (US$ Million)
Figure 54. Russia Mattresses Revenue (2017-2028) & (US$ Million)
Figure 55. Asia Pacific Mattresses Sales Market Share by Type (2017-2028)
Figure 56. Asia Pacific Mattresses Revenue Market Share by Type (2017-2028)
Figure 57. Asia Pacific Mattresses Sales Market Share by Application (2017-2028)
Figure 58. Asia Pacific Mattresses Revenue Market Share by Application (2017-2028)
Figure 59. Asia Pacific Mattresses Sales Share by Region (2017-2028)
Figure 60. Asia Pacific Mattresses Revenue Share by Region (2017-2028)
Figure 61. China Mattresses Revenue (2017-2028) & (US$ Million)
Figure 62. Japan Mattresses Revenue (2017-2028) & (US$ Million)
Figure 63. South Korea Mattresses Revenue (2017-2028) & (US$ Million)
Figure 64. India Mattresses Revenue (2017-2028) & (US$ Million)
Figure 65. Australia Mattresses Revenue (2017-2028) & (US$ Million)
Figure 66. Taiwan Mattresses Revenue (2017-2028) & (US$ Million)
Figure 67. Indonesia Mattresses Revenue (2017-2028) & (US$ Million)
Figure 68. Thailand Mattresses Revenue (2017-2028) & (US$ Million)
Figure 69. Malaysia Mattresses Revenue (2017-2028) & (US$ Million)
Figure 70. Philippines Mattresses Revenue (2017-2028) & (US$ Million)
Figure 71. Latin America Mattresses Sales Market Share by Type (2017-2028)
Figure 72. Latin America Mattresses Revenue Market Share by Type (2017-2028)
Figure 73. Latin America Mattresses Sales Market Share by Application (2017-2028)
Figure 74. Latin America Mattresses Revenue Market Share by Application (2017-2028)
Figure 75. Latin America Mattresses Sales Share by Country (2017-2028)
Figure 76. Latin America Mattresses Revenue Share by Country (2017-2028)
Figure 77. Mexico Mattresses Revenue (2017-2028) & (US$ Million)
Figure 78. Brazil Mattresses Revenue (2017-2028) & (US$ Million)
Figure 79. Argentina Mattresses Revenue (2017-2028) & (US$ Million)
Figure 80. Middle East and Africa Mattresses Sales Market Share by Type (2017-2028)
Figure 81. Middle East and Africa Mattresses Revenue Market Share by Type (2017-2028)
Figure 82. Middle East and Africa Mattresses Sales Market Share by Application (2017-2028)
Figure 83. Middle East and Africa Mattresses Revenue Market Share by Application (2017-2028)
Figure 84. Middle East and Africa Mattresses Sales Share by Country (2017-2028)
Figure 85. Middle East and Africa Mattresses Revenue Share by Country (2017-2028)
Figure 86. Turkey Mattresses Revenue (2017-2028) & (US$ Million)
Figure 87. Saudi Arabia Mattresses Revenue (2017-2028) & (US$ Million)
Figure 88. U.A.E Mattresses Revenue (2017-2028) & (US$ Million)
Figure 89. Mattresses Value Chain
Figure 90. Mattresses Production Process
Figure 91. Channels of Distribution
Figure 92. Distributors Profiles
Figure 93. Bottom-up and Top-down Approaches for This Report
Figure 94. Data Triangulation
Figure 95. Key Executives Interviewed
$4900
$9800
HAVE A QUERY?
OUR CUSTOMER
