List of Tables
Table 1. Global Agricultural Products E-commerce Trading Platform Market Size Growth Rate by Type (US$ Million): 2021 vs 2025 vs 2032
Table 2. Key Players of Farm-made Snacks, Nuts, Specialties
Table 3. Key Players of Aquatic products, Meat, Fruits and Vegetables
Table 4. Key Players of Grain and Oil, Rice and Flour, Dry Goods
Table 5. Key Players of Others
Table 6. Global Agricultural Products E-commerce Trading Platform Market Size Growth Rate by Transaction Subject Type (US$ Million): 2021 vs 2025 vs 2032
Table 7. Key Players of Business-to-Business (B2B) E-commerce
Table 8. Key Players of Business-to-Consumer (B2C) E-commerce
Table 9. Key Players of Other
Table 10. Global Agricultural Products E-commerce Trading Platform Market Size Growth Rate by Logistics Service Level (US$ Million): 2021 vs 2025 vs 2032
Table 11. Key Players of Cold Chain Logistics-supported Type
Table 12. Key Players of Ordinary Logistics-supported Type
Table 13. Key Players of Others
Table 14. Global Agricultural Products E-commerce Trading Platform Market Size Growth by Application (US$ Million): 2021 vs 2025 vs 2032
Table 15. Global Agricultural Products E-commerce Trading Platform Market Size by Region (US$ Million): 2021 vs 2025 vs 2032
Table 16. Global Agricultural Products E-commerce Trading Platform Market Size by Region (US$ Million), 2021–2026
Table 17. Global Agricultural Products E-commerce Trading Platform Market Share by Region (2021–2026)
Table 18. Global Agricultural Products E-commerce Trading Platform Forecasted Market Size by Region (US$ Million), 2027–2032
Table 19. Global Agricultural Products E-commerce Trading Platform Market Share by Region (2027–2032)
Table 20. Agricultural Products E-commerce Trading Platform Market Trends
Table 21. Agricultural Products E-commerce Trading Platform Market Drivers
Table 22. Agricultural Products E-commerce Trading Platform Market Challenges
Table 23. Agricultural Products E-commerce Trading Platform Market Restraints
Table 24. Global Agricultural Products E-commerce Trading Platform Revenue by Players (US$ Million), 2021–2026
Table 25. Global Agricultural Products E-commerce Trading Platform Market Share by Players (2021–2026)
Table 26. Global Top Agricultural Products E-commerce Trading Platform Players by Tier (Tier 1, Tier 2, and Tier 3), based on Agricultural Products E-commerce Trading Platform Revenue, 2025
Table 27. Ranking of Global Top Agricultural Products E-commerce Trading Platform Companies by Revenue (US$ Million) in 2025
Table 28. Global 5 Largest Players Market Share by Agricultural Products E-commerce Trading Platform Revenue (CR5 and HHI), 2021–2026
Table 29. Global Key Players of Agricultural Products E-commerce Trading Platform, Headquarters and Area Served
Table 30. Global Key Players of Agricultural Products E-commerce Trading Platform, Products and Applications
Table 31. Global Key Players of Agricultural Products E-commerce Trading Platform, Date of General Availability (GA)
Table 32. Mergers and Acquisitions, Expansion Plans
Table 33. Global Agricultural Products E-commerce Trading Platform Market Size by Type (US$ Million), 2021–2026
Table 34. Global Agricultural Products E-commerce Trading Platform Revenue Market Share by Type (2021–2026)
Table 35. Global Agricultural Products E-commerce Trading Platform Forecasted Market Size by Type (US$ Million), 2027–2032
Table 36. Global Agricultural Products E-commerce Trading Platform Revenue Market Share by Type (2027–2032)
Table 37. Global Agricultural Products E-commerce Trading Platform Market Size by Application (US$ Million), 2021–2026
Table 38. Global Agricultural Products E-commerce Trading Platform Revenue Market Share by Application (2021–2026)
Table 39. Global Agricultural Products E-commerce Trading Platform Forecasted Market Size by Application (US$ Million), 2027–2032
Table 40. Global Agricultural Products E-commerce Trading Platform Revenue Market Share by Application (2027–2032)
Table 41. North America Agricultural Products E-commerce Trading Platform Market Size Growth Rate by Country (US$ Million): 2021 vs 2025 vs 2032
Table 42. North America Agricultural Products E-commerce Trading Platform Market Size by Country (US$ Million), 2021–2026
Table 43. North America Agricultural Products E-commerce Trading Platform Market Size by Country (US$ Million), 2027–2032
Table 44. Europe Agricultural Products E-commerce Trading Platform Market Size Growth Rate by Country (US$ Million): 2021 vs 2025 vs 2032
Table 45. Europe Agricultural Products E-commerce Trading Platform Market Size by Country (US$ Million), 2021–2026
Table 46. Europe Agricultural Products E-commerce Trading Platform Market Size by Country (US$ Million), 2027–2032
Table 47. Asia-Pacific Agricultural Products E-commerce Trading Platform Market Size Growth Rate by Region (US$ Million): 2021 vs 2025 vs 2032
Table 48. Asia-Pacific Agricultural Products E-commerce Trading Platform Market Size by Region (US$ Million), 2021–2026
Table 49. Asia-Pacific Agricultural Products E-commerce Trading Platform Market Size by Region (US$ Million), 2027–2032
Table 50. Latin America Agricultural Products E-commerce Trading Platform Market Size Growth Rate by Country (US$ Million): 2021 vs 2025 vs 2032
Table 51. Latin America Agricultural Products E-commerce Trading Platform Market Size by Country (US$ Million), 2021–2026
Table 52. Latin America Agricultural Products E-commerce Trading Platform Market Size by Country (US$ Million), 2027–2032
Table 53. Middle East & Africa Agricultural Products E-commerce Trading Platform Market Size Growth Rate by Country (US$ Million): 2021 vs 2025 vs 2032
Table 54. Middle East & Africa Agricultural Products E-commerce Trading Platform Market Size by Country (US$ Million), 2021–2026
Table 55. Middle East & Africa Agricultural Products E-commerce Trading Platform Market Size by Country (US$ Million), 2027–2032
Table 56. Amazon Company Details
Table 57. Amazon Business Overview
Table 58. Amazon Agricultural Products E-commerce Trading Platform Product
Table 59. Amazon Revenue in Agricultural Products E-commerce Trading Platform Business (US$ Million), 2021–2026
Table 60. Amazon Recent Development
Table 61. Alibaba Group Company Details
Table 62. Alibaba Group Business Overview
Table 63. Alibaba Group Agricultural Products E-commerce Trading Platform Product
Table 64. Alibaba Group Revenue in Agricultural Products E-commerce Trading Platform Business (US$ Million), 2021–2026
Table 65. Alibaba Group Recent Development
Table 66. JD.com Company Company Details
Table 67. JD.com Company Business Overview
Table 68. JD.com Company Agricultural Products E-commerce Trading Platform Product
Table 69. JD.com Company Revenue in Agricultural Products E-commerce Trading Platform Business (US$ Million), 2021–2026
Table 70. JD.com Company Recent Development
Table 71. COFCO Group Company Details
Table 72. COFCO Group Business Overview
Table 73. COFCO Group Agricultural Products E-commerce Trading Platform Product
Table 74. COFCO Group Revenue in Agricultural Products E-commerce Trading Platform Business (US$ Million), 2021–2026
Table 75. COFCO Group Recent Development
Table 76. Benlai Holding Group Company Details
Table 77. Benlai Holding Group Business Overview
Table 78. Benlai Holding Group Agricultural Products E-commerce Trading Platform Product
Table 79. Benlai Holding Group Revenue in Agricultural Products E-commerce Trading Platform Business (US$ Million), 2021–2026
Table 80. Benlai Holding Group Recent Development
Table 81. Natures Basket Limited. Company Details
Table 82. Natures Basket Limited. Business Overview
Table 83. Natures Basket Limited. Agricultural Products E-commerce Trading Platform Product
Table 84. Natures Basket Limited. Revenue in Agricultural Products E-commerce Trading Platform Business (US$ Million), 2021–2026
Table 85. Natures Basket Limited. Recent Development
Table 86. Pinduoduo Company Details
Table 87. Pinduoduo Business Overview
Table 88. Pinduoduo Agricultural Products E-commerce Trading Platform Product
Table 89. Pinduoduo Revenue in Agricultural Products E-commerce Trading Platform Business (US$ Million), 2021–2026
Table 90. Pinduoduo Recent Development
Table 91. Bigbasket Company Details
Table 92. Bigbasket Business Overview
Table 93. Bigbasket Agricultural Products E-commerce Trading Platform Product
Table 94. Bigbasket Revenue in Agricultural Products E-commerce Trading Platform Business (US$ Million), 2021–2026
Table 95. Bigbasket Recent Development
Table 96. Blinkit Company Details
Table 97. Blinkit Business Overview
Table 98. Blinkit Agricultural Products E-commerce Trading Platform Product
Table 99. Blinkit Revenue in Agricultural Products E-commerce Trading Platform Business (US$ Million), 2021–2026
Table 100. Blinkit Recent Development
Table 101. Meituan Company Details
Table 102. Meituan Business Overview
Table 103. Meituan Agricultural Products E-commerce Trading Platform Product
Table 104. Meituan Revenue in Agricultural Products E-commerce Trading Platform Business (US$ Million), 2021–2026
Table 105. Meituan Recent Development
Table 106. Local Line Company Details
Table 107. Local Line Business Overview
Table 108. Local Line Agricultural Products E-commerce Trading Platform Product
Table 109. Local Line Revenue in Agricultural Products E-commerce Trading Platform Business (US$ Million), 2021–2026
Table 110. Local Line Recent Development
Table 111. Walmart Company Details
Table 112. Walmart Business Overview
Table 113. Walmart Agricultural Products E-commerce Trading Platform Product
Table 114. Walmart Revenue in Agricultural Products E-commerce Trading Platform Business (US$ Million), 2021–2026
Table 115. Walmart Recent Development
Table 116. GrazeCart Company Details
Table 117. GrazeCart Business Overview
Table 118. GrazeCart Agricultural Products E-commerce Trading Platform Product
Table 119. GrazeCart Revenue in Agricultural Products E-commerce Trading Platform Business (US$ Million), 2021–2026
Table 120. GrazeCart Recent Development
Table 121. Local Food Marketplace Company Details
Table 122. Local Food Marketplace Business Overview
Table 123. Local Food Marketplace Agricultural Products E-commerce Trading Platform Product
Table 124. Local Food Marketplace Revenue in Agricultural Products E-commerce Trading Platform Business (US$ Million), 2021–2026
Table 125. Local Food Marketplace Recent Development
Table 126. Farmigo Company Details
Table 127. Farmigo Business Overview
Table 128. Farmigo Agricultural Products E-commerce Trading Platform Product
Table 129. Farmigo Revenue in Agricultural Products E-commerce Trading Platform Business (US$ Million), 2021–2026
Table 130. Farmigo Recent Development
Table 131. Tesco Company Details
Table 132. Tesco Business Overview
Table 133. Tesco Agricultural Products E-commerce Trading Platform Product
Table 134. Tesco Revenue in Agricultural Products E-commerce Trading Platform Business (US$ Million), 2021–2026
Table 135. Tesco Recent Development
Table 136. Carrefour Company Details
Table 137. Carrefour Business Overview
Table 138. Carrefour Agricultural Products E-commerce Trading Platform Product
Table 139. Carrefour Revenue in Agricultural Products E-commerce Trading Platform Business (US$ Million), 2021–2026
Table 140. Carrefour Recent Development
Table 141. Instacart Company Details
Table 142. Instacart Business Overview
Table 143. Instacart Agricultural Products E-commerce Trading Platform Product
Table 144. Instacart Revenue in Agricultural Products E-commerce Trading Platform Business (US$ Million), 2021–2026
Table 145. Instacart Recent Development
Table 146. Ocado Group Company Details
Table 147. Ocado Group Business Overview
Table 148. Ocado Group Agricultural Products E-commerce Trading Platform Product
Table 149. Ocado Group Revenue in Agricultural Products E-commerce Trading Platform Business (US$ Million), 2021–2026
Table 150. Ocado Group Recent Development
Table 151. Flipkart Grocery Company Details
Table 152. Flipkart Grocery Business Overview
Table 153. Flipkart Grocery Agricultural Products E-commerce Trading Platform Product
Table 154. Flipkart Grocery Revenue in Agricultural Products E-commerce Trading Platform Business (US$ Million), 2021–2026
Table 155. Flipkart Grocery Recent Development
Table 156. Dingdong Maicai Company Details
Table 157. Dingdong Maicai Business Overview
Table 158. Dingdong Maicai Agricultural Products E-commerce Trading Platform Product
Table 159. Dingdong Maicai Revenue in Agricultural Products E-commerce Trading Platform Business (US$ Million), 2021–2026
Table 160. Dingdong Maicai Recent Development
Table 161. Coupang Company Details
Table 162. Coupang Business Overview
Table 163. Coupang Agricultural Products E-commerce Trading Platform Product
Table 164. Coupang Revenue in Agricultural Products E-commerce Trading Platform Business (US$ Million), 2021–2026
Table 165. Coupang Recent Development
Table 166. Reliance JioMart Company Details
Table 167. Reliance JioMart Business Overview
Table 168. Reliance JioMart Agricultural Products E-commerce Trading Platform Product
Table 169. Reliance JioMart Revenue in Agricultural Products E-commerce Trading Platform Business (US$ Million), 2021–2026
Table 170. Reliance JioMart Recent Development
Table 171. Mercado Libre Company Details
Table 172. Mercado Libre Business Overview
Table 173. Mercado Libre Agricultural Products E-commerce Trading Platform Product
Table 174. Mercado Libre Revenue in Agricultural Products E-commerce Trading Platform Business (US$ Million), 2021–2026
Table 175. Mercado Libre Recent Development
Table 176. Research Programs/Design for This Report
Table 177. Key Data Information from Secondary Sources
Table 178. Key Data Information from Primary Sources
Table 179. Authors List of This Report
List of Figures
Figure 1. Agricultural Products E-commerce Trading Platform Picture
Figure 2. Global Agricultural Products E-commerce Trading Platform Market Size Comparison by Type (US$ Million), 2021–2032
Figure 3. Global Agricultural Products E-commerce Trading Platform Market Share by Type: 2025 vs 2032
Figure 4. Farm-made Snacks, Nuts, Specialties Features
Figure 5. Aquatic products, Meat, Fruits and Vegetables Features
Figure 6. Grain and Oil, Rice and Flour, Dry Goods Features
Figure 7. Others Features
Figure 8. Global Agricultural Products E-commerce Trading Platform Market Size Comparison by Transaction Subject Type (US$ Million), 2021–2032
Figure 9. Business-to-Business (B2B) E-commerce Features
Figure 10. Business-to-Consumer (B2C) E-commerce Features
Figure 11. Other Features
Figure 12. Global Agricultural Products E-commerce Trading Platform Market Size Comparison by Logistics Service Level (US$ Million), 2021–2032
Figure 13. Cold Chain Logistics-supported Type Features
Figure 14. Ordinary Logistics-supported Type Features
Figure 15. Others Features
Figure 16. Global Agricultural Products E-commerce Trading Platform Market Size by Application (US$ Million), 2021–2032
Figure 17. Global Agricultural Products E-commerce Trading Platform Market Share by Application: 2025 vs 2032
Figure 18. Household Case Studies
Figure 19. Hotel Case Studies
Figure 20. Restaurant Case Studies
Figure 21. School Case Studies
Figure 22. Hospital Case Studies
Figure 23. Others Case Studies
Figure 24. Agricultural Products E-commerce Trading Platform Report Years Considered
Figure 25. Global Agricultural Products E-commerce Trading Platform Market Size (US$ Million), Year-over-Year: 2021–2032
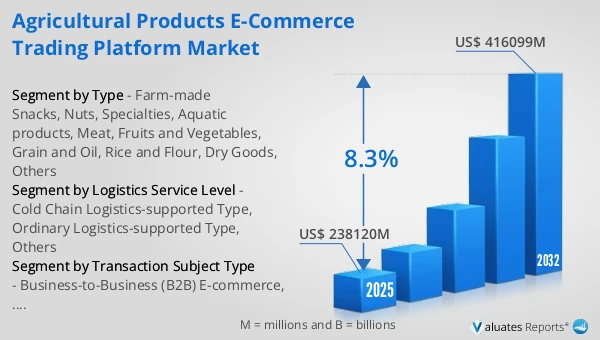
Figure 26. Global Agricultural Products E-commerce Trading Platform Market Size, (US$ Million), 2021 vs 2025 vs 2032
Figure 27. Global Agricultural Products E-commerce Trading Platform Market Share by Region: 2025 vs 2032
Figure 28. Global Agricultural Products E-commerce Trading Platform Market Share by Players in 2025
Figure 29. Global Agricultural Products E-commerce Trading Platform Market Share by Company Type (Tier 1, Tier 2, and Tier 3)
Figure 30. The Top 10 and 5 Players Market Share by Agricultural Products E-commerce Trading Platform Revenue in 2025
Figure 31. North America Agricultural Products E-commerce Trading Platform Market Size YoY Growth (US$ Million), 2021–2032
Figure 32. North America Agricultural Products E-commerce Trading Platform Market Share by Country (2021–2032)
Figure 33. United States Agricultural Products E-commerce Trading Platform Market Size YoY Growth (US$ Million), 2021–2032
Figure 34. Canada Agricultural Products E-commerce Trading Platform Market Size YoY Growth (US$ Million), 2021–2032
Figure 35. Europe Agricultural Products E-commerce Trading Platform Market Size YoY Growth (US$ Million), 2021–2032
Figure 36. Europe Agricultural Products E-commerce Trading Platform Market Share by Country (2021–2032)
Figure 37. Germany Agricultural Products E-commerce Trading Platform Market Size YoY Growth (US$ Million), 2021–2032
Figure 38. France Agricultural Products E-commerce Trading Platform Market Size YoY Growth (US$ Million), 2021–2032
Figure 39. U.K. Agricultural Products E-commerce Trading Platform Market Size YoY Growth (US$ Million), 2021–2032
Figure 40. Italy Agricultural Products E-commerce Trading Platform Market Size YoY Growth (US$ Million), 2021–2032
Figure 41. Russia Agricultural Products E-commerce Trading Platform Market Size YoY Growth (US$ Million), 2021–2032
Figure 42. Ireland Agricultural Products E-commerce Trading Platform Market Size YoY Growth (US$ Million), 2021–2032
Figure 43. Asia-Pacific Agricultural Products E-commerce Trading Platform Market Size YoY Growth (US$ Million), 2021–2032
Figure 44. Asia-Pacific Agricultural Products E-commerce Trading Platform Market Share by Region (2021–2032)
Figure 45. China Agricultural Products E-commerce Trading Platform Market Size YoY Growth (US$ Million), 2021–2032
Figure 46. Japan Agricultural Products E-commerce Trading Platform Market Size YoY Growth (US$ Million), 2021–2032
Figure 47. South Korea Agricultural Products E-commerce Trading Platform Market Size YoY Growth (US$ Million), 2021–2032
Figure 48. Southeast Asia Agricultural Products E-commerce Trading Platform Market Size YoY Growth (US$ Million), 2021–2032
Figure 49. India Agricultural Products E-commerce Trading Platform Market Size YoY Growth (US$ Million), 2021–2032
Figure 50. Australia & New Zealand Agricultural Products E-commerce Trading Platform Market Size YoY Growth (US$ Million), 2021–2032
Figure 51. Latin America Agricultural Products E-commerce Trading Platform Market Size YoY Growth (US$ Million), 2021–2032
Figure 52. Latin America Agricultural Products E-commerce Trading Platform Market Share by Country (2021–2032)
Figure 53. Mexico Agricultural Products E-commerce Trading Platform Market Size YoY Growth (US$ Million), 2021–2032
Figure 54. Brazil Agricultural Products E-commerce Trading Platform Market Size YoY Growth (US$ Million), 2021–2032
Figure 55. Middle East & Africa Agricultural Products E-commerce Trading Platform Market Size YoY Growth (US$ Million), 2021–2032
Figure 56. Middle East & Africa Agricultural Products E-commerce Trading Platform Market Share by Country (2021–2032)
Figure 57. Israel Agricultural Products E-commerce Trading Platform Market Size YoY Growth (US$ Million), 2021–2032
Figure 58. Saudi Arabia Agricultural Products E-commerce Trading Platform Market Size YoY Growth (US$ Million), 2021–2032
Figure 59. UAE Agricultural Products E-commerce Trading Platform Market Size YoY Growth (US$ Million), 2021–2032
Figure 60. Amazon Revenue Growth Rate in Agricultural Products E-commerce Trading Platform Business (2021–2026)
Figure 61. Alibaba Group Revenue Growth Rate in Agricultural Products E-commerce Trading Platform Business (2021–2026)
Figure 62. JD.com Company Revenue Growth Rate in Agricultural Products E-commerce Trading Platform Business (2021–2026)
Figure 63. COFCO Group Revenue Growth Rate in Agricultural Products E-commerce Trading Platform Business (2021–2026)
Figure 64. Benlai Holding Group Revenue Growth Rate in Agricultural Products E-commerce Trading Platform Business (2021–2026)
Figure 65. Natures Basket Limited. Revenue Growth Rate in Agricultural Products E-commerce Trading Platform Business (2021–2026)
Figure 66. Pinduoduo Revenue Growth Rate in Agricultural Products E-commerce Trading Platform Business (2021–2026)
Figure 67. Bigbasket Revenue Growth Rate in Agricultural Products E-commerce Trading Platform Business (2021–2026)
Figure 68. Blinkit Revenue Growth Rate in Agricultural Products E-commerce Trading Platform Business (2021–2026)
Figure 69. Meituan Revenue Growth Rate in Agricultural Products E-commerce Trading Platform Business (2021–2026)
Figure 70. Local Line Revenue Growth Rate in Agricultural Products E-commerce Trading Platform Business (2021–2026)
Figure 71. Walmart Revenue Growth Rate in Agricultural Products E-commerce Trading Platform Business (2021–2026)
Figure 72. GrazeCart Revenue Growth Rate in Agricultural Products E-commerce Trading Platform Business (2021–2026)
Figure 73. Local Food Marketplace Revenue Growth Rate in Agricultural Products E-commerce Trading Platform Business (2021–2026)
Figure 74. Farmigo Revenue Growth Rate in Agricultural Products E-commerce Trading Platform Business (2021–2026)
Figure 75. Tesco Revenue Growth Rate in Agricultural Products E-commerce Trading Platform Business (2021–2026)
Figure 76. Carrefour Revenue Growth Rate in Agricultural Products E-commerce Trading Platform Business (2021–2026)
Figure 77. Instacart Revenue Growth Rate in Agricultural Products E-commerce Trading Platform Business (2021–2026)
Figure 78. Ocado Group Revenue Growth Rate in Agricultural Products E-commerce Trading Platform Business (2021–2026)
Figure 79. Flipkart Grocery Revenue Growth Rate in Agricultural Products E-commerce Trading Platform Business (2021–2026)
Figure 80. Dingdong Maicai Revenue Growth Rate in Agricultural Products E-commerce Trading Platform Business (2021–2026)
Figure 81. Coupang Revenue Growth Rate in Agricultural Products E-commerce Trading Platform Business (2021–2026)
Figure 82. Reliance JioMart Revenue Growth Rate in Agricultural Products E-commerce Trading Platform Business (2021–2026)
Figure 83. Mercado Libre Revenue Growth Rate in Agricultural Products E-commerce Trading Platform Business (2021–2026)
Figure 84. Bottom-up and Top-down Approaches for This Report
Figure 85. Data Triangulation
Figure 86. Key Executives Interviewed