List of Tables
Table 1. Global Exosome Lyophilization Market Size Growth Rate by Protective Agent Strategy (2026-2032) & (US$ Million)
Table 2. Key Players of Single Protective Agent
Table 3. Key Players of Combined Protective Agent
Table 4. Global Exosome Lyophilization Market Size Growth Rate by Production Scale (2026-2032) & (US$ Million)
Table 5. Key Players of Laboratory Pilot/Pilot-scale
Table 6. Key Players of Large-scale Production
Table 7. Global Exosome Lyophilization Market Size Growth by Application (2026-2032) & (US$ Million)
Table 8. Global Exosome Lyophilization Market Size by Region (2026-2032) & (US$ Million)
Table 9. Global Exosome Lyophilization Market Size by Region (2026-2032) & (US$ Million)
Table 10. Global Exosome Lyophilization Market Share by Region (2026-2032)
Table 11. Market Top Trends
Table 12. Market Use Cases
Table 13. Global Exosome Lyophilization Revenue by Players (2026 & 2032) & (US$ Million)
Table 14. Global Exosome Lyophilization Market Share by Players (2026 & 2032)
Table 15. Key Players Headquarters and Area Served
Table 16. Key Players Exosome Lyophilization Product/Solution/Service
Table 17. Date of Enter into Exosome Lyophilization Market
Table 18. Mergers & Acquisitions, Expansion Plans
Table 19. Global Exosome Lyophilization Market Size by Protective Agent Strategy (2026-2032) & (US$ Million)
Table 20. Global Exosome Lyophilization Market Size Share by Protective Agent Strategy (2026-2032)
Table 21. Global Exosome Lyophilization Market Size by Application (2026-2032) & (US$ Million)
Table 22. Global Exosome Lyophilization Market Size Share by Application (2026-2032)
Table 23. North America Key Players Exosome Lyophilization Revenue (2026 & 2032) & (US$ Million)
Table 24. North America Key Players Exosome Lyophilization Market Share (2026 & 2032)
Table 25. North America Exosome Lyophilization Market Size by Protective Agent Strategy (2026-2032) & (US$ Million)
Table 26. North America Exosome Lyophilization Market Share by Protective Agent Strategy (2026-2032)
Table 27. North America Exosome Lyophilization Market Size by Application (2026-2032) & (US$ Million)
Table 28. North America Exosome Lyophilization Market Share by Application (2026-2032)
Table 29. Europe Key Players Exosome Lyophilization Revenue (2026 & 2032) & (US$ Million)
Table 30. Europe Key Players Exosome Lyophilization Market Share (2026 & 2032)
Table 31. Europe Exosome Lyophilization Market Size by Protective Agent Strategy (2026-2032) & (US$ Million)
Table 32. Europe Exosome Lyophilization Market Share by Protective Agent Strategy (2026-2032)
Table 33. Europe Exosome Lyophilization Market Size by Application (2026-2032) & (US$ Million)
Table 34. Europe Exosome Lyophilization Market Share by Application (2026-2032)
Table 35. China Key Players Exosome Lyophilization Revenue (2026 & 2032) & (US$ Million)
Table 36. China Key Players Exosome Lyophilization Market Share (2026 & 2032)
Table 37. China Exosome Lyophilization Market Size by Protective Agent Strategy (2026-2032) & (US$ Million)
Table 38. China Exosome Lyophilization Market Share by Protective Agent Strategy (2026-2032)
Table 39. China Exosome Lyophilization Market Size by Application (2026-2032) & (US$ Million)
Table 40. China Exosome Lyophilization Market Share by Application (2026-2032)
Table 41. Key Players in Japan
Table 42. Key Players in Southeast Asia
Table 43. Key Players in India
Table 44. Key Players in South America
Table 45. MFB Lab Inc. Company Details
Table 46. MFB Lab Inc. Description and Business Overview
Table 47. MFB Lab Inc. Exosome Lyophilization Product
Table 48. MFB Lab Inc. Revenue in Exosome Lyophilization Business: 2026 & 2032
Table 49. MFB Lab Inc. Recent Development
Table 50. AM Biotech Company Details
Table 51. AM Biotech Description and Business Overview
Table 52. AM Biotech Exosome Lyophilization Product
Table 53. AM Biotech Revenue in Exosome Lyophilization Business: 2026 & 2032
Table 54. AM Biotech Recent Development
Table 55. Immunostep Company Details
Table 56. Immunostep Description and Business Overview
Table 57. Immunostep Exosome Lyophilization Product
Table 58. Immunostep Revenue in Exosome Lyophilization Business: 2026 & 2032
Table 59. Immunostep Recent Development
Table 60. Bello Bio Company Details
Table 61. Bello Bio Description and Business Overview
Table 62. Bello Bio Exosome Lyophilization Product
Table 63. Bello Bio Revenue in Exosome Lyophilization Business: 2026 & 2032
Table 64. Bello Bio Recent Development
Table 65. REPROCELL Company Details
Table 66. REPROCELL Description and Business Overview
Table 67. REPROCELL Exosome Lyophilization Product
Table 68. REPROCELL Revenue in Exosome Lyophilization Business: 2026 & 2032
Table 69. REPROCELL Recent Development
Table 70. Lonza Company Details
Table 71. Lonza Description and Business Overview
Table 72. Lonza Exosome Lyophilization Product
Table 73. Lonza Revenue in Exosome Lyophilization Business: 2026 & 2032
Table 74. Lonza Recent Development
Table 75. Cell Guidance Systems Company Details
Table 76. Cell Guidance Systems Description and Business Overview
Table 77. Cell Guidance Systems Exosome Lyophilization Product
Table 78. Cell Guidance Systems Revenue in Exosome Lyophilization Business: 2026 & 2032
Table 79. Cell Guidance Systems Recent Development
Table 80. ExoCoBio Company Details
Table 81. ExoCoBio Description and Business Overview
Table 82. ExoCoBio Exosome Lyophilization Product
Table 83. ExoCoBio Revenue in Exosome Lyophilization Business: 2026 & 2032
Table 84. ExoCoBio Recent Development
Table 85. Echobiotech Company Details
Table 86. Echobiotech Description and Business Overview
Table 87. Echobiotech Exosome Lyophilization Product
Table 88. Echobiotech Revenue in Exosome Lyophilization Business: 2026 & 2032
Table 89. Echobiotech Recent Development
Table 90. Hunan Weitai Company Details
Table 91. Hunan Weitai Description and Business Overview
Table 92. Hunan Weitai Exosome Lyophilization Product
Table 93. Hunan Weitai Revenue in Exosome Lyophilization Business: 2026 & 2032
Table 94. Hunan Weitai Recent Development
Table 95. Exosome Lyophilization Market Trends
Table 96. Exosome Lyophilization Market Drivers
Table 97. Exosome Lyophilization Market Challenges
Table 98. Exosome Lyophilization Market Restraints
Table 99. Research Programs/Design for This Report
Table 100. Key Data Information from Secondary Sources
Table 101. Key Data Information from Primary Sources
List of Figures
Figure 1. Global Exosome Lyophilization Market Share by Protective Agent Strategy in 2026 & 2032
Figure 2. Single Protective Agent Features
Figure 3. Combined Protective Agent Features
Figure 4. Global Exosome Lyophilization Market Share by Production Scale in 2026 & 2032
Figure 5. Laboratory Pilot/Pilot-scale Features
Figure 6. Large-scale Production Features
Figure 7. Global Exosome Lyophilization Market Share by Application in 2026 & 2032
Figure 8. Scientific Research Case Studies
Figure 9. Cosmetics Case Studies
Figure 10. Pharmaceuticals Case Studies
Figure 11. Exosome Lyophilization Report Years Considered
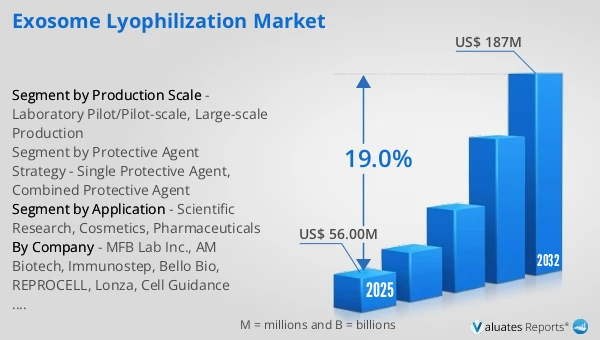
Figure 12. Global Exosome Lyophilization Market Size and Growth Rate 2026-2032 (US$ Million)
Figure 13. Global Exosome Lyophilization Market Share by Region (2026-2032)
Figure 14. Global Exosome Lyophilization Market Size Market Share by Protective Agent Strategy (2026-2032)
Figure 15. North America Exosome Lyophilization Market Size 2026-2032 (US$ Million)
Figure 16. Europe Exosome Lyophilization Market Size 2026-2032 (US$ Million)
Figure 17. China Exosome Lyophilization Market Size 2026-2032 (US$ Million)
Figure 18. Exosome Lyophilization Market Size in Japan (2026-2032) & (US$ Million)
Figure 19. Exosome Lyophilization Market Size in Southeast Asia (2026-2032) & (US$ Million)
Figure 20. Exosome Lyophilization Market Size in India (2026-2032) & (US$ Million)
Figure 21. Exosome Lyophilization Market Size in South America (2026-2032) & (US$ Million)
Figure 22. Bottom-up and Top-down Approaches for This Report
Figure 23. Data Triangulation
Figure 24. Key Executives Interviewed