0
U.S. (TOLL FREE)
+1 (315) 215-3225
Automative

0
U.S. (TOLL FREE)
+1 (315) 215-3225
Cerebral Oxygen Monitor- Global Market Share and Ranking, Overall Sales and Demand Forecast 2026-2032
Published Date: 2026-01-13
|
Report Code: QYRE-Auto-19G14547
Home | Market Reports | Health| Medical Devices & Equipment
Global Cerebral Oxygen Monitor Market Research Report 2023
BUY CHAPTERS

Cerebral Oxygen Monitor- Global Market Share and Ranking, Overall Sales and Demand Forecast 2026-2032

Code: QYRE-Auto-19G14547
Report
2026-01-13
Pages:92
QYResearch
Buy Now with 15% Discount
DESCRIPTION
TABLE OF CONTENT
TABLES & FIGURES

Cerebral Oxygen Monitor- Market Size

The global market for Cerebral Oxygen Monitor was estimated to be worth US$ 949 million in 2025 and is projected to reach US$ 1525 million, growing at a CAGR of 7.0% from 2026 to 2032.

Cerebral Oxygen Monitor- Market

Cerebral Oxygen Monitor- Market

The potential shifts in the 2025 U.S. tariff framework pose substantial volatility risks to global markets. This report provides a comprehensive assessment of recent tariff adjustments and international strategic countermeasures on Cerebral Oxygen Monitor cross-border industrial footprints, capital allocation patterns, regional economic interdependencies, and supply chain reconfigurations.
Brain oximeters are used for non-invasive/minimally invasive continuous monitoring of brain tissue oxygen saturation or blood oxygenation changes. They are mostly based on optical principles such as near-infrared spectroscopy (NIRS), reflecting real-time brain perfusion and oxygen supply and demand, assisting anesthesia, ICU, neurosurgery, and neonatal departments in identifying hypoxia risks.
Upstream: Near-infrared light sources and detectors, fiber optics/probe patches, analog front-ends and main control chips, algorithm software, medical adhesives and consumables. Downstream: Hospital anesthesiology departments, ICUs, neurosurgery departments, neonatal departments, emergency transport, and research institutions.
In 2025, the global unit price of a brain oximeter was US$272,000, with sales of 3,490 units and a global annual production capacity of 3,500 units. The industry profit margin was 20-25%.
Global market future development trends:
First, the increasing demand for brain protection in the perioperative and critical care periods is driving cerebral oxygenation from an optional feature to a more widely accepted standard. Manufacturers will integrate this with multiple parameters such as hemodynamics, EEG, and SpO₂ to create integrated cerebral perfusion and oxygen metabolism monitoring solutions.
Second, algorithm and data-driven upgrades are underway. Enhanced resistance to motion/light interference, personalized baseline calibration, and AI-based early warning systems will improve interpretability and clinical decision-making value. Simultaneously, interconnectivity with monitoring platforms and electronic medical records will support remote consultations and quality control.
Third, business models are deepening towards a "main unit + consumables + services" model. Iterative development of disposable probes and low-allergenic adhesive materials reduces the risk of cross-infection. Expansion into neonatal, stroke, and rehabilitation scenarios, coupled with hospital expansion and improved payment methods in emerging markets, will drive scale growth.
This report provides a comprehensive view of the global market for Cerebral Oxygen Monitor, covering total sales volume, sales revenue, pricing, the market share and ranking of key companies, along with analyses by region & country, by Type, and by Application.
The Cerebral Oxygen Monitor market size, estimations, and forecasts are presented in terms of sales volume (Units) and revenue ($ millions), with 2025 as the base year and historical and forecast data from 2021 to 2032. The report combines quantitative and qualitative analysis to help readers develop growth strategies, assess the competitive landscape, evaluate their position in the current marketplace, and make informed business decisions regarding Cerebral Oxygen Monitor.
Market Segmentation

Scope of Cerebral Oxygen Monitor- Market Report

Report Metric Details
Report Name Cerebral Oxygen Monitor- Market
CAGR 7.0%
Segment by Type
  • Portable Type
  • Wearable Type
Segment by Consumables Configuration
  • Reusable Probe
  • Disposable Patch Probe
Segment by Monitoring Principles
  • NIRS Near-Infrared Spectroscopy
  • Time-Resolved/Frequency-Domain NIRS
  • Others
Segment by Application
  • Hospital
  • Clinic
  • Household
By Region
  • North America (United States, Canada)
  • Europe (Germany, France, UK, Italy, Russia) Rest of Europe
  • Nordic Countries
  • Asia-Pacific (China, Japan, South Korea)
  • Southeast Asia (India, Australia)
  • Rest of Asia
  • Latin America (Mexico, Brazil)
  • Rest of Latin America
  • Middle East & Africa (Turkey, Saudi Arabia, UAE, Rest of MEA)
Consumption by Region
  • North America (United States, Canada)
  • Europe (Germany, France, UK, Italy, Russia)
  • Asia-Pacific (China, Japan, South Korea, Taiwan)
  • Southeast Asia (India)
  • Latin America (Mexico, Brazil)
By Company GE Healthcare, Medtronic, HAMAMATSU, Masimo Corporation, Mespere LifeSciences, Artinis Medical Systems, Nonin Medical, Ornim Medical, CAS Medical Systems, ENGINMED
Forecast units USD million in value
Report coverage Revenue and volume forecast, company share, competitive landscape, growth factors and trends

Chapter Outline

  • Chapter 1: Introduces the scope of the report and the global market size (value, volume, and price). It also summarizes market dynamics and Recent Developments; identifies key drivers and restraints; outlines challenges and risks for manufacturers; reviews relevant industry policies and U.S. tariff implications.
  • Chapter 2: Provides a detailed analysis of the Cerebral Oxygen Monitor manufacturers' competitive landscape—including pricing, sales and revenue shares, Recent Developments plans, and mergers and acquisitions (M&A).
  • Chapter 3: Analyzes market segmentation by Type, presenting the size and growth potential of each segment to help readers identify blue-ocean opportunities.
  • Chapter 4: Analyzes market segmentation by Application, presenting the size and growth potential of each downstream segment to help readers identify blue-ocean opportunities.
  • Chapter 5: Presents Cerebral Oxygen Monitor sales and revenue at the regional level. It offers a quantitative assessment of market size and growth potential by region and summarizes market development, future prospects, addressable space, and country-level market size worldwide.
  • Chapter 6: Presents Cerebral Oxygen Monitor sales and revenue at the country level. It provides segmented data by Type and by Application for each country/region.
  • Chapter 7: Profiles key players, detailing the main companies' product sales, revenue, pricing, gross margin, product portfolios, Recent Developments, etc.
  • Chapter 8: Analyzes the industry value chain, including upstream suppliers and downstream applications/customers.
  • Chapter 9: Conclusion.

FAQ for this report

Who are the main players in the Cerebral Oxygen Monitor- Market report?

Ans: The main players in the Cerebral Oxygen Monitor- Market are GE Healthcare, Medtronic, HAMAMATSU, Masimo Corporation, Mespere LifeSciences, Artinis Medical Systems, Nonin Medical, Ornim Medical, CAS Medical Systems, ENGINMED

What are the Application segmentation covered in the Cerebral Oxygen Monitor- Market report?

Ans: The Applications covered in the Cerebral Oxygen Monitor- Market report are Hospital, Clinic, Household

What are the Type segmentation covered in the Cerebral Oxygen Monitor- Market report?

Ans: The Types covered in the Cerebral Oxygen Monitor- Market report are Portable Type, Wearable Type

1 Market Overview
1.1 Cerebral Oxygen Monitor Product Introduction
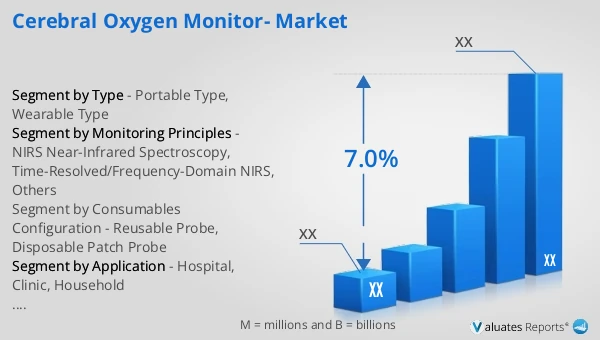
1.2 Global Cerebral Oxygen Monitor Market Size Forecast
1.2.1 Global Cerebral Oxygen Monitor Sales Value (2021–2032)
1.2.2 Global Cerebral Oxygen Monitor Sales Volume (2021–2032)
1.2.3 Global Cerebral Oxygen Monitor Sales Price (2021–2032)
1.3 Cerebral Oxygen Monitor Market Trends & Drivers
1.3.1 Cerebral Oxygen Monitor Industry Trends
1.3.2 Cerebral Oxygen Monitor Market Drivers & Opportunities
1.3.3 Cerebral Oxygen Monitor Market Challenges
1.3.4 Cerebral Oxygen Monitor Market Restraints
1.3.5 Impact of U.S. Tariffs
1.4 Assumptions and Limitations
1.5 Study Objectives
1.6 Years Considered
2 Competitive Analysis by Company
2.1 Global Cerebral Oxygen Monitor Players Revenue Ranking (2025)
2.2 Global Cerebral Oxygen Monitor Revenue by Company (2021–2026)
2.3 Global Cerebral Oxygen Monitor Sales Volume Ranking of Players (2025)
2.4 Global Cerebral Oxygen Monitor Sales Volume by Company (2021–2026)
2.5 Global Cerebral Oxygen Monitor Average Price by Company (2021–2026)
2.6 Key Manufacturers Cerebral Oxygen Monitor Manufacturing Base and Headquarters
2.7 Key Manufacturers Cerebral Oxygen Monitor Product Offerings
2.8 Key Manufacturers Start of Mass Production of Cerebral Oxygen Monitor
2.9 Cerebral Oxygen Monitor Market Competitive Analysis
2.9.1 Cerebral Oxygen Monitor Market Concentration Rate (2021–2026)
2.9.2 Global 5 and 10 Largest Manufacturers by Cerebral Oxygen Monitor Revenue in 2025
2.9.3 Global Companies by Tier (Tier 1, Tier 2, Tier 3), based on Cerebral Oxygen Monitor revenue, 2025
2.10 Mergers & Acquisitions and Expansion
3 Segmentation Cerebral Oxygen Monitor Market Classification
3.1 Introduction by Type
3.1.1 Portable Type
3.1.2 Wearable Type
3.1.3 Global Cerebral Oxygen Monitor Sales Value by Type
3.1.3.1 Global Cerebral Oxygen Monitor Sales Value by Type (2021 vs 2025 vs 2032)
3.1.3.2 Global Cerebral Oxygen Monitor Sales Value, by Type (2021–2032)
3.1.3.3 Global Cerebral Oxygen Monitor Sales Value, by Type (%), 2021–2032
3.1.4 Global Cerebral Oxygen Monitor Sales Volume by Type
3.1.4.1 Global Cerebral Oxygen Monitor Sales Volume by Type (2021 vs 2025 vs 2032)
3.1.4.2 Global Cerebral Oxygen Monitor Sales Volume, by Type (2021–2032)
3.1.4.3 Global Cerebral Oxygen Monitor Sales Volume, by Type (%), 2021–2032
3.1.5 Global Cerebral Oxygen Monitor Average Price by Type (2021–2032)
3.2 Introduction by Consumables Configuration
3.2.1 Reusable Probe
3.2.2 Disposable Patch Probe
3.2.3 Global Cerebral Oxygen Monitor Sales Value by Consumables Configuration
3.2.3.1 Global Cerebral Oxygen Monitor Sales Value by Consumables Configuration (2021 vs 2025 vs 2032)
3.2.3.2 Global Cerebral Oxygen Monitor Sales Value, by Consumables Configuration (2021–2032)
3.2.3.3 Global Cerebral Oxygen Monitor Sales Value, by Consumables Configuration (%), 2021–2032
3.2.4 Global Cerebral Oxygen Monitor Sales Volume by Consumables Configuration
3.2.4.1 Global Cerebral Oxygen Monitor Sales Volume by Consumables Configuration (2021 vs 2025 vs 2032)
3.2.4.2 Global Cerebral Oxygen Monitor Sales Volume, by Consumables Configuration (2021–2032)
3.2.4.3 Global Cerebral Oxygen Monitor Sales Volume, by Consumables Configuration (%), 2021–2032
3.2.5 Global Cerebral Oxygen Monitor Average Price by Consumables Configuration (2021–2032)
3.3 Introduction by Monitoring Principles
3.3.1 NIRS Near-Infrared Spectroscopy
3.3.2 Time-Resolved/Frequency-Domain NIRS
3.3.3 Others
3.3.4 Global Cerebral Oxygen Monitor Sales Value by Monitoring Principles
3.3.4.1 Global Cerebral Oxygen Monitor Sales Value by Monitoring Principles (2021 vs 2025 vs 2032)
3.3.4.2 Global Cerebral Oxygen Monitor Sales Value, by Monitoring Principles (2021–2032)
3.3.4.3 Global Cerebral Oxygen Monitor Sales Value, by Monitoring Principles (%), 2021–2032
3.3.5 Global Cerebral Oxygen Monitor Sales Volume by Monitoring Principles
3.3.5.1 Global Cerebral Oxygen Monitor Sales Volume by Monitoring Principles (2021 vs 2025 vs 2032)
3.3.5.2 Global Cerebral Oxygen Monitor Sales Volume, by Monitoring Principles (2021–2032)
3.3.5.3 Global Cerebral Oxygen Monitor Sales Volume, by Monitoring Principles (%), 2021–2032
3.3.6 Global Cerebral Oxygen Monitor Average Price by Monitoring Principles (2021–2032)
4 Segmentation by Application
4.1 Introduction by Application
4.1.1 Hospital
4.1.2 Clinic
4.1.3 Household
4.2 Global Cerebral Oxygen Monitor Sales Value by Application
4.2.1 Global Cerebral Oxygen Monitor Sales Value by Application (2021 vs 2025 vs 2032)
4.2.2 Global Cerebral Oxygen Monitor Sales Value, by Application (2021–2032)
4.2.3 Global Cerebral Oxygen Monitor Sales Value, by Application (%), 2021–2032
4.3 Global Cerebral Oxygen Monitor Sales Volume by Application
4.3.1 Global Cerebral Oxygen Monitor Sales Volume by Application (2021 vs 2025 vs 2032)
4.3.2 Global Cerebral Oxygen Monitor Sales Volume, by Application (2021–2032)
4.3.3 Global Cerebral Oxygen Monitor Sales Volume, by Application (%), 2021–2032
4.4 Global Cerebral Oxygen Monitor Average Price by Application (2021–2032)
5 Segmentation by Region
5.1 Global Cerebral Oxygen Monitor Sales Value by Region
5.1.1 Global Cerebral Oxygen Monitor Sales Value by Region: 2021 vs 2025 vs 2032
5.1.2 Global Cerebral Oxygen Monitor Sales Value by Region (2021–2026)
5.1.3 Global Cerebral Oxygen Monitor Sales Value by Region (2027–2032)
5.1.4 Global Cerebral Oxygen Monitor Sales Value by Region (%), 2021–2032
5.2 Global Cerebral Oxygen Monitor Sales Volume by Region
5.2.1 Global Cerebral Oxygen Monitor Sales Volume by Region: 2021 vs 2025 vs 2032
5.2.2 Global Cerebral Oxygen Monitor Sales Volume by Region (2021–2026)
5.2.3 Global Cerebral Oxygen Monitor Sales Volume by Region (2027–2032)
5.2.4 Global Cerebral Oxygen Monitor Sales Volume by Region (%), 2021–2032
5.3 Global Cerebral Oxygen Monitor Average Price by Region (2021–2032)
5.4 North America
5.4.1 North America Cerebral Oxygen Monitor Sales Value, 2021–2032
5.4.2 North America Cerebral Oxygen Monitor Sales Value by Country (%), 2025 vs 2032
5.5 Europe
5.5.1 Europe Cerebral Oxygen Monitor Sales Value, 2021–2032
5.5.2 Europe Cerebral Oxygen Monitor Sales Value by Country (%), 2025 vs 2032
5.6 Asia Pacific
5.6.1 Asia Pacific Cerebral Oxygen Monitor Sales Value, 2021–2032
5.6.2 Asia Pacific Cerebral Oxygen Monitor Sales Value by Region (%), 2025 vs 2032
5.7 South America
5.7.1 South America Cerebral Oxygen Monitor Sales Value, 2021–2032
5.7.2 South America Cerebral Oxygen Monitor Sales Value by Country (%), 2025 vs 2032
5.8 Middle East & Africa
5.8.1 Middle East & Africa Cerebral Oxygen Monitor Sales Value, 2021–2032
5.8.2 Middle East & Africa Cerebral Oxygen Monitor Sales Value by Country (%), 2025 vs 2032
6 Segmentation by Key Countries/Regions
6.1 Key Countries/Regions Cerebral Oxygen Monitor Sales Value Growth Trends, 2021 vs 2025 vs 2032
6.2 Key Countries/Regions Cerebral Oxygen Monitor Sales Value and Sales Volume
6.2.1 Key Countries/Regions Cerebral Oxygen Monitor Sales Value, 2021–2032
6.2.2 Key Countries/Regions Cerebral Oxygen Monitor Sales Volume, 2021–2032
6.3 United States
6.3.1 United States Cerebral Oxygen Monitor Sales Value, 2021–2032
6.3.2 United States Cerebral Oxygen Monitor Sales Value by Type (%), 2025 vs 2032
6.3.3 United States Cerebral Oxygen Monitor Sales Value by Application, 2025 vs 2032
6.4 Europe
6.4.1 Europe Cerebral Oxygen Monitor Sales Value, 2021–2032
6.4.2 Europe Cerebral Oxygen Monitor Sales Value by Type (%), 2025 vs 2032
6.4.3 Europe Cerebral Oxygen Monitor Sales Value by Application, 2025 vs 2032
6.5 China
6.5.1 China Cerebral Oxygen Monitor Sales Value, 2021–2032
6.5.2 China Cerebral Oxygen Monitor Sales Value by Type (%), 2025 vs 2032
6.5.3 China Cerebral Oxygen Monitor Sales Value by Application, 2025 vs 2032
6.6 Japan
6.6.1 Japan Cerebral Oxygen Monitor Sales Value, 2021–2032
6.6.2 Japan Cerebral Oxygen Monitor Sales Value by Type (%), 2025 vs 2032
6.6.3 Japan Cerebral Oxygen Monitor Sales Value by Application, 2025 vs 2032
6.7 South Korea
6.7.1 South Korea Cerebral Oxygen Monitor Sales Value, 2021–2032
6.7.2 South Korea Cerebral Oxygen Monitor Sales Value by Type (%), 2025 vs 2032
6.7.3 South Korea Cerebral Oxygen Monitor Sales Value by Application, 2025 vs 2032
6.8 Southeast Asia
6.8.1 Southeast Asia Cerebral Oxygen Monitor Sales Value, 2021–2032
6.8.2 Southeast Asia Cerebral Oxygen Monitor Sales Value by Type (%), 2025 vs 2032
6.8.3 Southeast Asia Cerebral Oxygen Monitor Sales Value by Application, 2025 vs 2032
6.9 India
6.9.1 India Cerebral Oxygen Monitor Sales Value, 2021–2032
6.9.2 India Cerebral Oxygen Monitor Sales Value by Type (%), 2025 vs 2032
6.9.3 India Cerebral Oxygen Monitor Sales Value by Application, 2025 vs 2032
7 Company Profiles
7.1 GE Healthcare
7.1.1 GE Healthcare Company Information
7.1.2 GE Healthcare Introduction and Business Overview
7.1.3 GE Healthcare Cerebral Oxygen Monitor Sales, Revenue, Price and Gross Margin (2021–2026)
7.1.4 GE Healthcare Cerebral Oxygen Monitor Product Offerings
7.1.5 GE Healthcare Recent Developments
7.2 Medtronic
7.2.1 Medtronic Company Information
7.2.2 Medtronic Introduction and Business Overview
7.2.3 Medtronic Cerebral Oxygen Monitor Sales, Revenue, Price and Gross Margin (2021–2026)
7.2.4 Medtronic Cerebral Oxygen Monitor Product Offerings
7.2.5 Medtronic Recent Developments
7.3 HAMAMATSU
7.3.1 HAMAMATSU Company Information
7.3.2 HAMAMATSU Introduction and Business Overview
7.3.3 HAMAMATSU Cerebral Oxygen Monitor Sales, Revenue, Price and Gross Margin (2021–2026)
7.3.4 HAMAMATSU Cerebral Oxygen Monitor Product Offerings
7.3.5 HAMAMATSU Recent Developments
7.4 Masimo Corporation
7.4.1 Masimo Corporation Company Information
7.4.2 Masimo Corporation Introduction and Business Overview
7.4.3 Masimo Corporation Cerebral Oxygen Monitor Sales, Revenue, Price and Gross Margin (2021–2026)
7.4.4 Masimo Corporation Cerebral Oxygen Monitor Product Offerings
7.4.5 Masimo Corporation Recent Developments
7.5 Mespere LifeSciences
7.5.1 Mespere LifeSciences Company Information
7.5.2 Mespere LifeSciences Introduction and Business Overview
7.5.3 Mespere LifeSciences Cerebral Oxygen Monitor Sales, Revenue, Price and Gross Margin (2021–2026)
7.5.4 Mespere LifeSciences Cerebral Oxygen Monitor Product Offerings
7.5.5 Mespere LifeSciences Recent Developments
7.6 Artinis Medical Systems
7.6.1 Artinis Medical Systems Company Information
7.6.2 Artinis Medical Systems Introduction and Business Overview
7.6.3 Artinis Medical Systems Cerebral Oxygen Monitor Sales, Revenue, Price and Gross Margin (2021–2026)
7.6.4 Artinis Medical Systems Cerebral Oxygen Monitor Product Offerings
7.6.5 Artinis Medical Systems Recent Developments
7.7 Nonin Medical
7.7.1 Nonin Medical Company Information
7.7.2 Nonin Medical Introduction and Business Overview
7.7.3 Nonin Medical Cerebral Oxygen Monitor Sales, Revenue, Price and Gross Margin (2021–2026)
7.7.4 Nonin Medical Cerebral Oxygen Monitor Product Offerings
7.7.5 Nonin Medical Recent Developments
7.8 Ornim Medical
7.8.1 Ornim Medical Company Information
7.8.2 Ornim Medical Introduction and Business Overview
7.8.3 Ornim Medical Cerebral Oxygen Monitor Sales, Revenue, Price and Gross Margin (2021–2026)
7.8.4 Ornim Medical Cerebral Oxygen Monitor Product Offerings
7.8.5 Ornim Medical Recent Developments
7.9 CAS Medical Systems
7.9.1 CAS Medical Systems Company Information
7.9.2 CAS Medical Systems Introduction and Business Overview
7.9.3 CAS Medical Systems Cerebral Oxygen Monitor Sales, Revenue, Price and Gross Margin (2021–2026)
7.9.4 CAS Medical Systems Cerebral Oxygen Monitor Product Offerings
7.9.5 CAS Medical Systems Recent Developments
7.10 ENGINMED
7.10.1 ENGINMED Company Information
7.10.2 ENGINMED Introduction and Business Overview
7.10.3 ENGINMED Cerebral Oxygen Monitor Sales, Revenue, Price and Gross Margin (2021–2026)
7.10.4 ENGINMED Cerebral Oxygen Monitor Product Offerings
7.10.5 ENGINMED Recent Developments
8 Industry Chain Analysis
8.1 Cerebral Oxygen Monitor Industrial Chain
8.2 Cerebral Oxygen Monitor Upstream Analysis
8.2.1 Key Raw Materials
8.2.2 Key Suppliers of Raw Materials
8.2.3 Manufacturing Cost Structure
8.3 Midstream Analysis
8.4 Downstream Analysis (Customer Analysis)
8.5 Sales Model and Sales Channelss
8.5.1 Cerebral Oxygen Monitor Sales Model
8.5.2 Sales Channels
8.5.3 Cerebral Oxygen Monitor Distributors
9 Research Findings and Conclusion
10 Appendix
10.1 Research Methodology
10.1.1 Methodology/Research Approach
10.1.1.1 Research Programs/Design
10.1.1.2 Market Size Estimation
10.1.1.3 Market Breakdown and Data Triangulation
10.1.2 Data Source
10.1.2.1 Secondary Sources
10.1.2.2 Primary Sources
10.2 Author Details
10.3 Disclaimer
List of Tables
 Table 1. Cerebral Oxygen Monitor Market Trends
 Table 2. Cerebral Oxygen Monitor Market Drivers & Opportunities
 Table 3. Cerebral Oxygen Monitor Market Challenges
 Table 4. Cerebral Oxygen Monitor Market Restraints


List of Figures
 Figure 1. Cerebral Oxygen Monitor Product Picture
 Figure 2. Global Cerebral Oxygen Monitor Sales Value, 2021 vs 2025 vs 2032 (US$ Million)
 Figure 3. Global Cerebral Oxygen Monitor Sales Value (US$ Million), 2021–2032
 Figure 4. Global Cerebral Oxygen Monitor Sales Volume (Units), 2021–2032
 Figure 5. Global Cerebral Oxygen Monitor Sales Price (US$/Unit), 2021–2032
 Figure 6. Cerebral Oxygen Monitor Report Years Considered
 Figure 7. Global Cerebral Oxygen Monitor Players Revenue Ranking (US$ Million), 2025
 Figure 8. Global Cerebral Oxygen Monitor Sales Volume Ranking of Players (Units), 2025
 Figure 9. The 5 and 10 Largest Manufacturers in the World: Market Share by Cerebral Oxygen Monitor Revenue in 2025
 Figure 10. Cerebral Oxygen Monitor Market Share by Company Type (Tier 1, Tier 2, and Tier 3): 2021 vs 2025
 Figure 11. Portable Type Picture
 Figure 12. Wearable Type Picture
 Figure 13. Global Cerebral Oxygen Monitor Sales Value by Type (US$ Million), 2021 vs 2025 vs 2032
 Figure 14. Global Cerebral Oxygen Monitor Sales Value Market Share by Type, 2025 & 2032
 Figure 15. Global Cerebral Oxygen Monitor Sales Volume by Type (Units), 2021 vs 2025 vs 2032
 Figure 16. Global Cerebral Oxygen Monitor Sales Volume Market Share by Type, 2025 & 2032
 Figure 17. Global Cerebral Oxygen Monitor Price by Type (US$/Unit), 2021–2032
 Figure 18. Reusable Probe Picture
 Figure 19. Disposable Patch Probe Picture
 Figure 20. Global Cerebral Oxygen Monitor Sales Value by Consumables Configuration (US$ Million), 2021 vs 2025 vs 2032
 Figure 21. Global Cerebral Oxygen Monitor Sales Value Market Share by Consumables Configuration, 2025 & 2032
 Figure 22. Global Cerebral Oxygen Monitor Sales Volume by Consumables Configuration (Units), 2021 vs 2025 vs 2032
 Figure 23. Global Cerebral Oxygen Monitor Sales Volume Market Share by Consumables Configuration, 2025 & 2032
 Figure 24. Global Cerebral Oxygen Monitor Price by Consumables Configuration (US$/Unit), 2021–2032
 Figure 25. NIRS Near-Infrared Spectroscopy Picture
 Figure 26. Time-Resolved/Frequency-Domain NIRS Picture
 Figure 27. Others Picture
 Figure 28. Global Cerebral Oxygen Monitor Sales Value by Monitoring Principles (US$ Million), 2021 vs 2025 vs 2032
 Figure 29. Global Cerebral Oxygen Monitor Sales Value Market Share by Monitoring Principles, 2025 & 2032
 Figure 30. Global Cerebral Oxygen Monitor Sales Volume by Monitoring Principles (Units), 2021 vs 2025 vs 2032
 Figure 31. Global Cerebral Oxygen Monitor Sales Volume Market Share by Monitoring Principles, 2025 & 2032
 Figure 32. Global Cerebral Oxygen Monitor Price by Monitoring Principles (US$/Unit), 2021–2032
 Figure 33. Product Picture of Hospital
 Figure 34. Product Picture of Clinic
 Figure 35. Product Picture of Household
 Figure 36. Global Cerebral Oxygen Monitor Sales Value by Application (US$ Million), 2021 vs 2025 vs 2032
 Figure 37. Global Cerebral Oxygen Monitor Sales Value Market Share by Application, 2025 & 2032
 Figure 38. Global Cerebral Oxygen Monitor Sales Volume by Application (Units), 2021 vs 2025 vs 2032
 Figure 39. Global Cerebral Oxygen Monitor Sales Volume Market Share by Application, 2025 & 2032
 Figure 40. Global Cerebral Oxygen Monitor Price by Application (US$/Unit), 2021–2032
 Figure 41. North America Cerebral Oxygen Monitor Sales Value (US$ Million), 2021–2032
 Figure 42. North America Cerebral Oxygen Monitor Sales Value by Country (%), 2025 vs 2032
 Figure 43. Europe Cerebral Oxygen Monitor Sales Value (US$ Million), 2021–2032
 Figure 44. Europe Cerebral Oxygen Monitor Sales Value by Country (%), 2025 vs 2032
 Figure 45. Asia Pacific Cerebral Oxygen Monitor Sales Value (US$ Million), 2021–2032
 Figure 46. Asia Pacific Cerebral Oxygen Monitor Sales Value by Region (%), 2025 vs 2032
 Figure 47. South America Cerebral Oxygen Monitor Sales Value (US$ Million), 2021–2032
 Figure 48. South America Cerebral Oxygen Monitor Sales Value by Country (%), 2025 vs 2032
 Figure 49. Middle East & Africa Cerebral Oxygen Monitor Sales Value (US$ Million), 2021–2032
 Figure 50. Middle East & Africa Cerebral Oxygen Monitor Sales Value by Country (%), 2025 vs 2032
 Figure 51. Key Countries/Regions Cerebral Oxygen Monitor Sales Value (%), 2021–2032
 Figure 52. Key Countries/Regions Cerebral Oxygen Monitor Sales Volume (%), 2021–2032
 Figure 53. United States Cerebral Oxygen Monitor Sales Value (US$ Million), 2021–2032
 Figure 54. United States Cerebral Oxygen Monitor Sales Value by Type (%), 2025 vs 2032
 Figure 55. United States Cerebral Oxygen Monitor Sales Value by Application (%), 2025 vs 2032
 Figure 56. Europe Cerebral Oxygen Monitor Sales Value (US$ Million), 2021–2032
 Figure 57. Europe Cerebral Oxygen Monitor Sales Value by Type (%), 2025 vs 2032
 Figure 58. Europe Cerebral Oxygen Monitor Sales Value by Application (%), 2025 vs 2032
 Figure 59. China Cerebral Oxygen Monitor Sales Value (US$ Million), 2021–2032
 Figure 60. China Cerebral Oxygen Monitor Sales Value by Type (%), 2025 vs 2032
 Figure 61. China Cerebral Oxygen Monitor Sales Value by Application (%), 2025 vs 2032
 Figure 62. Japan Cerebral Oxygen Monitor Sales Value (US$ Million), 2021–2032
 Figure 63. Japan Cerebral Oxygen Monitor Sales Value by Type (%), 2025 vs 2032
 Figure 64. Japan Cerebral Oxygen Monitor Sales Value by Application (%), 2025 vs 2032
 Figure 65. South Korea Cerebral Oxygen Monitor Sales Value (US$ Million), 2021–2032
 Figure 66. South Korea Cerebral Oxygen Monitor Sales Value by Type (%), 2025 vs 2032
 Figure 67. South Korea Cerebral Oxygen Monitor Sales Value by Application (%), 2025 vs 2032
 Figure 68. Southeast Asia Cerebral Oxygen Monitor Sales Value (US$ Million), 2021–2032
 Figure 69. Southeast Asia Cerebral Oxygen Monitor Sales Value by Type (%), 2025 vs 2032
 Figure 70. Southeast Asia Cerebral Oxygen Monitor Sales Value by Application (%), 2025 vs 2032
 Figure 71. India Cerebral Oxygen Monitor Sales Value (US$ Million), 2021–2032
 Figure 72. India Cerebral Oxygen Monitor Sales Value by Type (%), 2025 vs 2032
 Figure 73. India Cerebral Oxygen Monitor Sales Value by Application (%), 2025 vs 2032
 Figure 74. Cerebral Oxygen Monitor Industrial Chain
 Figure 75. Cerebral Oxygen Monitor Manufacturing Cost Structure
 Figure 76. Channels of Distribution (Direct Sales, and Distribution)
 Figure 77. Bottom-up and Top-down Approaches for This Report
 Figure 78. Data Triangulation
 Figure 79. Key Executives Interviewed
SELECT A FORMAT
Added to Cart
Electronic

$3950

Single User License
Electronic

$5925

Multi User License
Electronic

$7900

Enterprise License
Add to Cart
Buy Now (15% Discount)

OUR CUSTOMER

Nano String

SIMILAR REPORTS