List of Tables
Table 1. Global Engineering Plastic Market Size Growth Rate by Type (US$ Million): 2021 vs 2025 vs 2032
Table 2. Key Players of Acrylonitrile butadiene styrene (ABS)
Table 3. Key Players of Polyamides (PA)
Table 4. Key Players of Polycarbonate (PC)
Table 5. Key Players of Thermoplastic Polyester Elastomer (TPEE)
Table 6. Key Players of Polyacetals (POM)
Table 7. Key Players of Polybutylene terephthalate (PBT)
Table 8. Key Players of Polymethyl Methacrylate (PMMA)
Table 9. Global Engineering Plastic Market Size Growth Rate by Performance (US$ Million): 2021 vs 2025 vs 2032
Table 10. Key Players of General Engineering Plastics
Table 11. Key Players of High-Performance / Specialty Engineering Plastics
Table 12. Global Engineering Plastic Market Size Growth Rate by Crystallinity (US$ Million): 2021 vs 2025 vs 2032
Table 13. Key Players of Amorphous Engineering Plastics
Table 14. Key Players of Semi-Crystalline Engineering Plastics
Table 15. Global Engineering Plastic Market Size Growth by Application (US$ Million): 2021 vs 2025 vs 2032
Table 16. Global Engineering Plastic Market Size by Region (US$ Million): 2021 vs 2025 vs 2032
Table 17. Global Engineering Plastic Market Size by Region (US$ Million), 2021–2026
Table 18. Global Engineering Plastic Market Share by Region (2021–2026)
Table 19. Global Engineering Plastic Forecasted Market Size by Region (US$ Million), 2027–2032
Table 20. Global Engineering Plastic Market Share by Region (2027–2032)
Table 21. Engineering Plastic Market Trends
Table 22. Engineering Plastic Market Drivers
Table 23. Engineering Plastic Market Challenges
Table 24. Engineering Plastic Market Restraints
Table 25. Global Engineering Plastic Revenue by Players (US$ Million), 2021–2026
Table 26. Global Engineering Plastic Market Share by Players (2021–2026)
Table 27. Global Top Engineering Plastic Players by Tier (Tier 1, Tier 2, and Tier 3), based on Engineering Plastic Revenue, 2025
Table 28. Ranking of Global Top Engineering Plastic Companies by Revenue (US$ Million) in 2025
Table 29. Global 5 Largest Players Market Share by Engineering Plastic Revenue (CR5 and HHI), 2021–2026
Table 30. Global Key Players of Engineering Plastic, Headquarters and Area Served
Table 31. Global Key Players of Engineering Plastic, Products and Applications
Table 32. Global Key Players of Engineering Plastic, Date of General Availability (GA)
Table 33. Mergers and Acquisitions, Expansion Plans
Table 34. Global Engineering Plastic Market Size by Type (US$ Million), 2021–2026
Table 35. Global Engineering Plastic Revenue Market Share by Type (2021–2026)
Table 36. Global Engineering Plastic Forecasted Market Size by Type (US$ Million), 2027–2032
Table 37. Global Engineering Plastic Revenue Market Share by Type (2027–2032)
Table 38. Global Engineering Plastic Market Size by Application (US$ Million), 2021–2026
Table 39. Global Engineering Plastic Revenue Market Share by Application (2021–2026)
Table 40. Global Engineering Plastic Forecasted Market Size by Application (US$ Million), 2027–2032
Table 41. Global Engineering Plastic Revenue Market Share by Application (2027–2032)
Table 42. North America Engineering Plastic Market Size Growth Rate by Country (US$ Million): 2021 vs 2025 vs 2032
Table 43. North America Engineering Plastic Market Size by Country (US$ Million), 2021–2026
Table 44. North America Engineering Plastic Market Size by Country (US$ Million), 2027–2032
Table 45. Europe Engineering Plastic Market Size Growth Rate by Country (US$ Million): 2021 vs 2025 vs 2032
Table 46. Europe Engineering Plastic Market Size by Country (US$ Million), 2021–2026
Table 47. Europe Engineering Plastic Market Size by Country (US$ Million), 2027–2032
Table 48. Asia-Pacific Engineering Plastic Market Size Growth Rate by Region (US$ Million): 2021 vs 2025 vs 2032
Table 49. Asia-Pacific Engineering Plastic Market Size by Region (US$ Million), 2021–2026
Table 50. Asia-Pacific Engineering Plastic Market Size by Region (US$ Million), 2027–2032
Table 51. Latin America Engineering Plastic Market Size Growth Rate by Country (US$ Million): 2021 vs 2025 vs 2032
Table 52. Latin America Engineering Plastic Market Size by Country (US$ Million), 2021–2026
Table 53. Latin America Engineering Plastic Market Size by Country (US$ Million), 2027–2032
Table 54. Middle East & Africa Engineering Plastic Market Size Growth Rate by Country (US$ Million): 2021 vs 2025 vs 2032
Table 55. Middle East & Africa Engineering Plastic Market Size by Country (US$ Million), 2021–2026
Table 56. Middle East & Africa Engineering Plastic Market Size by Country (US$ Million), 2027–2032
Table 57. Ineos Company Details
Table 58. Ineos Business Overview
Table 59. Ineos Engineering Plastic Product
Table 60. Ineos Revenue in Engineering Plastic Business (US$ Million), 2021–2026
Table 61. Ineos Recent Development
Table 62. Covestro Company Details
Table 63. Covestro Business Overview
Table 64. Covestro Engineering Plastic Product
Table 65. Covestro Revenue in Engineering Plastic Business (US$ Million), 2021–2026
Table 66. Covestro Recent Development
Table 67. SABIC Company Details
Table 68. SABIC Business Overview
Table 69. SABIC Engineering Plastic Product
Table 70. SABIC Revenue in Engineering Plastic Business (US$ Million), 2021–2026
Table 71. SABIC Recent Development
Table 72. Mitsubishi Chemical Company Details
Table 73. Mitsubishi Chemical Business Overview
Table 74. Mitsubishi Chemical Engineering Plastic Product
Table 75. Mitsubishi Chemical Revenue in Engineering Plastic Business (US$ Million), 2021–2026
Table 76. Mitsubishi Chemical Recent Development
Table 77. BASF Company Details
Table 78. BASF Business Overview
Table 79. BASF Engineering Plastic Product
Table 80. BASF Revenue in Engineering Plastic Business (US$ Million), 2021–2026
Table 81. BASF Recent Development
Table 82. Toray Company Details
Table 83. Toray Business Overview
Table 84. Toray Engineering Plastic Product
Table 85. Toray Revenue in Engineering Plastic Business (US$ Million), 2021–2026
Table 86. Toray Recent Development
Table 87. Envalior Company Details
Table 88. Envalior Business Overview
Table 89. Envalior Engineering Plastic Product
Table 90. Envalior Revenue in Engineering Plastic Business (US$ Million), 2021–2026
Table 91. Envalior Recent Development
Table 92. Celanese Company Details
Table 93. Celanese Business Overview
Table 94. Celanese Engineering Plastic Product
Table 95. Celanese Revenue in Engineering Plastic Business (US$ Million), 2021–2026
Table 96. Celanese Recent Development
Table 97. Sumitomo Chemical Company Details
Table 98. Sumitomo Chemical Business Overview
Table 99. Sumitomo Chemical Engineering Plastic Product
Table 100. Sumitomo Chemical Revenue in Engineering Plastic Business (US$ Million), 2021–2026
Table 101. Sumitomo Chemical Recent Development
Table 102. Syensqo Company Details
Table 103. Syensqo Business Overview
Table 104. Syensqo Engineering Plastic Product
Table 105. Syensqo Revenue in Engineering Plastic Business (US$ Million), 2021–2026
Table 106. Syensqo Recent Development
Table 107. Evonik Company Details
Table 108. Evonik Business Overview
Table 109. Evonik Engineering Plastic Product
Table 110. Evonik Revenue in Engineering Plastic Business (US$ Million), 2021–2026
Table 111. Evonik Recent Development
Table 112. Arkema Company Details
Table 113. Arkema Business Overview
Table 114. Arkema Engineering Plastic Product
Table 115. Arkema Revenue in Engineering Plastic Business (US$ Million), 2021–2026
Table 116. Arkema Recent Development
Table 117. AdvanSix Company Details
Table 118. AdvanSix Business Overview
Table 119. AdvanSix Engineering Plastic Product
Table 120. AdvanSix Revenue in Engineering Plastic Business (US$ Million), 2021–2026
Table 121. AdvanSix Recent Development
Table 122. Lotte Chemical Company Details
Table 123. Lotte Chemical Business Overview
Table 124. Lotte Chemical Engineering Plastic Product
Table 125. Lotte Chemical Revenue in Engineering Plastic Business (US$ Million), 2021–2026
Table 126. Lotte Chemical Recent Development
Table 127. Victrex Company Details
Table 128. Victrex Business Overview
Table 129. Victrex Engineering Plastic Product
Table 130. Victrex Revenue in Engineering Plastic Business (US$ Million), 2021–2026
Table 131. Victrex Recent Development
Table 132. UBE Corporation Company Details
Table 133. UBE Corporation Business Overview
Table 134. UBE Corporation Engineering Plastic Product
Table 135. UBE Corporation Revenue in Engineering Plastic Business (US$ Million), 2021–2026
Table 136. UBE Corporation Recent Development
Table 137. Avient Company Details
Table 138. Avient Business Overview
Table 139. Avient Engineering Plastic Product
Table 140. Avient Revenue in Engineering Plastic Business (US$ Million), 2021–2026
Table 141. Avient Recent Development
Table 142. Asahi Kasei Company Details
Table 143. Asahi Kasei Business Overview
Table 144. Asahi Kasei Engineering Plastic Product
Table 145. Asahi Kasei Revenue in Engineering Plastic Business (US$ Million), 2021–2026
Table 146. Asahi Kasei Recent Development
Table 147. CHIMEI Company Details
Table 148. CHIMEI Business Overview
Table 149. CHIMEI Engineering Plastic Product
Table 150. CHIMEI Revenue in Engineering Plastic Business (US$ Million), 2021–2026
Table 151. CHIMEI Recent Development
Table 152. LG Chem Company Details
Table 153. LG Chem Business Overview
Table 154. LG Chem Engineering Plastic Product
Table 155. LG Chem Revenue in Engineering Plastic Business (US$ Million), 2021–2026
Table 156. LG Chem Recent Development
Table 157. Trinseo Company Details
Table 158. Trinseo Business Overview
Table 159. Trinseo Engineering Plastic Product
Table 160. Trinseo Revenue in Engineering Plastic Business (US$ Million), 2021–2026
Table 161. Trinseo Recent Development
Table 162. Ascend Performance Materials Company Details
Table 163. Ascend Performance Materials Business Overview
Table 164. Ascend Performance Materials Engineering Plastic Product
Table 165. Ascend Performance Materials Revenue in Engineering Plastic Business (US$ Million), 2021–2026
Table 166. Ascend Performance Materials Recent Development
Table 167. Kolon Plastics Company Details
Table 168. Kolon Plastics Business Overview
Table 169. Kolon Plastics Engineering Plastic Product
Table 170. Kolon Plastics Revenue in Engineering Plastic Business (US$ Million), 2021–2026
Table 171. Kolon Plastics Recent Development
Table 172. Kuraray Company Details
Table 173. Kuraray Business Overview
Table 174. Kuraray Engineering Plastic Product
Table 175. Kuraray Revenue in Engineering Plastic Business (US$ Million), 2021–2026
Table 176. Kuraray Recent Development
Table 177. Samyang Company Details
Table 178. Samyang Business Overview
Table 179. Samyang Engineering Plastic Product
Table 180. Samyang Revenue in Engineering Plastic Business (US$ Million), 2021–2026
Table 181. Samyang Recent Development
Table 182. EMS-Grivory Company Details
Table 183. EMS-Grivory Business Overview
Table 184. EMS-Grivory Engineering Plastic Product
Table 185. EMS-Grivory Revenue in Engineering Plastic Business (US$ Million), 2021–2026
Table 186. EMS-Grivory Recent Development
Table 187. Unitika Company Details
Table 188. Unitika Business Overview
Table 189. Unitika Engineering Plastic Product
Table 190. Unitika Revenue in Engineering Plastic Business (US$ Million), 2021–2026
Table 191. Unitika Recent Development
Table 192. DOMO Chemicals Company Details
Table 193. DOMO Chemicals Business Overview
Table 194. DOMO Chemicals Engineering Plastic Product
Table 195. DOMO Chemicals Revenue in Engineering Plastic Business (US$ Million), 2021–2026
Table 196. DOMO Chemicals Recent Development
Table 197. Grupa Azoty Company Details
Table 198. Grupa Azoty Business Overview
Table 199. Grupa Azoty Engineering Plastic Product
Table 200. Grupa Azoty Revenue in Engineering Plastic Business (US$ Million), 2021–2026
Table 201. Grupa Azoty Recent Development
Table 202. LyondellBasell Company Details
Table 203. LyondellBasell Business Overview
Table 204. LyondellBasell Engineering Plastic Product
Table 205. LyondellBasell Revenue in Engineering Plastic Business (US$ Million), 2021–2026
Table 206. LyondellBasell Recent Development
Table 207. Sinopec Company Details
Table 208. Sinopec Business Overview
Table 209. Sinopec Engineering Plastic Product
Table 210. Sinopec Revenue in Engineering Plastic Business (US$ Million), 2021–2026
Table 211. Sinopec Recent Development
Table 212. Wanhua Chemical Company Details
Table 213. Wanhua Chemical Business Overview
Table 214. Wanhua Chemical Engineering Plastic Product
Table 215. Wanhua Chemical Revenue in Engineering Plastic Business (US$ Million), 2021–2026
Table 216. Wanhua Chemical Recent Development
Table 217. Kingfa Company Details
Table 218. Kingfa Business Overview
Table 219. Kingfa Engineering Plastic Product
Table 220. Kingfa Revenue in Engineering Plastic Business (US$ Million), 2021–2026
Table 221. Kingfa Recent Development
Table 222. Formosa Company Details
Table 223. Formosa Business Overview
Table 224. Formosa Engineering Plastic Product
Table 225. Formosa Revenue in Engineering Plastic Business (US$ Million), 2021–2026
Table 226. Formosa Recent Development
Table 227. KKPC Company Details
Table 228. KKPC Business Overview
Table 229. KKPC Engineering Plastic Product
Table 230. KKPC Revenue in Engineering Plastic Business (US$ Million), 2021–2026
Table 231. KKPC Recent Development
Table 232. RadiciGroup Company Details
Table 233. RadiciGroup Business Overview
Table 234. RadiciGroup Engineering Plastic Product
Table 235. RadiciGroup Revenue in Engineering Plastic Business (US$ Million), 2021–2026
Table 236. RadiciGroup Recent Development
Table 237. Grand Pacific Petrochemical Company Details
Table 238. Grand Pacific Petrochemical Business Overview
Table 239. Grand Pacific Petrochemical Engineering Plastic Product
Table 240. Grand Pacific Petrochemical Revenue in Engineering Plastic Business (US$ Million), 2021–2026
Table 241. Grand Pacific Petrochemical Recent Development
Table 242. DIC Company Details
Table 243. DIC Business Overview
Table 244. DIC Engineering Plastic Product
Table 245. DIC Revenue in Engineering Plastic Business (US$ Million), 2021–2026
Table 246. DIC Recent Development
Table 247. Kureha Company Details
Table 248. Kureha Business Overview
Table 249. Kureha Engineering Plastic Product
Table 250. Kureha Revenue in Engineering Plastic Business (US$ Million), 2021–2026
Table 251. Kureha Recent Development
Table 252. Polyplastics Company Details
Table 253. Polyplastics Business Overview
Table 254. Polyplastics Engineering Plastic Product
Table 255. Polyplastics Revenue in Engineering Plastic Business (US$ Million), 2021–2026
Table 256. Polyplastics Recent Development
Table 257. Research Programs/Design for This Report
Table 258. Key Data Information from Secondary Sources
Table 259. Key Data Information from Primary Sources
Table 260. Authors List of This Report
List of Figures
Figure 1. Engineering Plastic Picture
Figure 2. Global Engineering Plastic Market Size Comparison by Type (US$ Million), 2021–2032
Figure 3. Global Engineering Plastic Market Share by Type: 2025 vs 2032
Figure 4. Acrylonitrile butadiene styrene (ABS) Features
Figure 5. Polyamides (PA) Features
Figure 6. Polycarbonate (PC) Features
Figure 7. Thermoplastic Polyester Elastomer (TPEE) Features
Figure 8. Polyacetals (POM) Features
Figure 9. Polybutylene terephthalate (PBT) Features
Figure 10. Polymethyl Methacrylate (PMMA) Features
Figure 11. Special Engineering Plastics Features
Figure 12. Others Features
Figure 13. Global Engineering Plastic Market Size Comparison by Performance (US$ Million), 2021–2032
Figure 14. General Engineering Plastics Features
Figure 15. High-Performance / Specialty Engineering Plastics Features
Figure 16. Global Engineering Plastic Market Size Comparison by Crystallinity (US$ Million), 2021–2032
Figure 17. Amorphous Engineering Plastics Features
Figure 18. Semi-Crystalline Engineering Plastics Features
Figure 19. Global Engineering Plastic Market Size by Application (US$ Million), 2021–2032
Figure 20. Global Engineering Plastic Market Share by Application: 2025 vs 2032
Figure 21. Automotive Industry Case Studies
Figure 22. Electronics and Semiconductors Case Studies
Figure 23. Aviation and Aerospace Case Studies
Figure 24. Transportation Case Studies
Figure 25. Medical Equipment Case Studies
Figure 26. Home Appliances and Consumer Electronics Case Studies
Figure 27. Others Case Studies
Figure 28. Engineering Plastic Report Years Considered
Figure 29. Global Engineering Plastic Market Size (US$ Million), Year-over-Year: 2021–2032
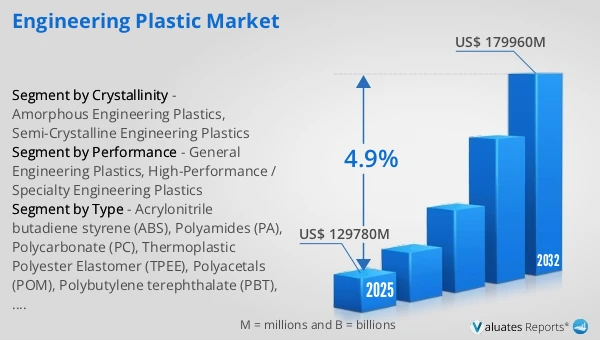
Figure 30. Global Engineering Plastic Market Size, (US$ Million), 2021 vs 2025 vs 2032
Figure 31. Global Engineering Plastic Market Share by Region: 2025 vs 2032
Figure 32. Global Engineering Plastic Market Share by Players in 2025
Figure 33. Global Engineering Plastic Market Share by Company Type (Tier 1, Tier 2, and Tier 3)
Figure 34. The Top 10 and 5 Players Market Share by Engineering Plastic Revenue in 2025
Figure 35. North America Engineering Plastic Market Size YoY Growth (US$ Million), 2021–2032
Figure 36. North America Engineering Plastic Market Share by Country (2021–2032)
Figure 37. United States Engineering Plastic Market Size YoY Growth (US$ Million), 2021–2032
Figure 38. Canada Engineering Plastic Market Size YoY Growth (US$ Million), 2021–2032
Figure 39. Europe Engineering Plastic Market Size YoY Growth (US$ Million), 2021–2032
Figure 40. Europe Engineering Plastic Market Share by Country (2021–2032)
Figure 41. Germany Engineering Plastic Market Size YoY Growth (US$ Million), 2021–2032
Figure 42. France Engineering Plastic Market Size YoY Growth (US$ Million), 2021–2032
Figure 43. U.K. Engineering Plastic Market Size YoY Growth (US$ Million), 2021–2032
Figure 44. Italy Engineering Plastic Market Size YoY Growth (US$ Million), 2021–2032
Figure 45. Russia Engineering Plastic Market Size YoY Growth (US$ Million), 2021–2032
Figure 46. Ireland Engineering Plastic Market Size YoY Growth (US$ Million), 2021–2032
Figure 47. Asia-Pacific Engineering Plastic Market Size YoY Growth (US$ Million), 2021–2032
Figure 48. Asia-Pacific Engineering Plastic Market Share by Region (2021–2032)
Figure 49. China Engineering Plastic Market Size YoY Growth (US$ Million), 2021–2032
Figure 50. Japan Engineering Plastic Market Size YoY Growth (US$ Million), 2021–2032
Figure 51. South Korea Engineering Plastic Market Size YoY Growth (US$ Million), 2021–2032
Figure 52. Southeast Asia Engineering Plastic Market Size YoY Growth (US$ Million), 2021–2032
Figure 53. India Engineering Plastic Market Size YoY Growth (US$ Million), 2021–2032
Figure 54. Australia & New Zealand Engineering Plastic Market Size YoY Growth (US$ Million), 2021–2032
Figure 55. Latin America Engineering Plastic Market Size YoY Growth (US$ Million), 2021–2032
Figure 56. Latin America Engineering Plastic Market Share by Country (2021–2032)
Figure 57. Mexico Engineering Plastic Market Size YoY Growth (US$ Million), 2021–2032
Figure 58. Brazil Engineering Plastic Market Size YoY Growth (US$ Million), 2021–2032
Figure 59. Middle East & Africa Engineering Plastic Market Size YoY Growth (US$ Million), 2021–2032
Figure 60. Middle East & Africa Engineering Plastic Market Share by Country (2021–2032)
Figure 61. Israel Engineering Plastic Market Size YoY Growth (US$ Million), 2021–2032
Figure 62. Saudi Arabia Engineering Plastic Market Size YoY Growth (US$ Million), 2021–2032
Figure 63. UAE Engineering Plastic Market Size YoY Growth (US$ Million), 2021–2032
Figure 64. Ineos Revenue Growth Rate in Engineering Plastic Business (2021–2026)
Figure 65. Covestro Revenue Growth Rate in Engineering Plastic Business (2021–2026)
Figure 66. SABIC Revenue Growth Rate in Engineering Plastic Business (2021–2026)
Figure 67. Mitsubishi Chemical Revenue Growth Rate in Engineering Plastic Business (2021–2026)
Figure 68. BASF Revenue Growth Rate in Engineering Plastic Business (2021–2026)
Figure 69. Toray Revenue Growth Rate in Engineering Plastic Business (2021–2026)
Figure 70. Envalior Revenue Growth Rate in Engineering Plastic Business (2021–2026)
Figure 71. Celanese Revenue Growth Rate in Engineering Plastic Business (2021–2026)
Figure 72. Sumitomo Chemical Revenue Growth Rate in Engineering Plastic Business (2021–2026)
Figure 73. Syensqo Revenue Growth Rate in Engineering Plastic Business (2021–2026)
Figure 74. Evonik Revenue Growth Rate in Engineering Plastic Business (2021–2026)
Figure 75. Arkema Revenue Growth Rate in Engineering Plastic Business (2021–2026)
Figure 76. AdvanSix Revenue Growth Rate in Engineering Plastic Business (2021–2026)
Figure 77. Lotte Chemical Revenue Growth Rate in Engineering Plastic Business (2021–2026)
Figure 78. Victrex Revenue Growth Rate in Engineering Plastic Business (2021–2026)
Figure 79. UBE Corporation Revenue Growth Rate in Engineering Plastic Business (2021–2026)
Figure 80. Avient Revenue Growth Rate in Engineering Plastic Business (2021–2026)
Figure 81. Asahi Kasei Revenue Growth Rate in Engineering Plastic Business (2021–2026)
Figure 82. CHIMEI Revenue Growth Rate in Engineering Plastic Business (2021–2026)
Figure 83. LG Chem Revenue Growth Rate in Engineering Plastic Business (2021–2026)
Figure 84. Trinseo Revenue Growth Rate in Engineering Plastic Business (2021–2026)
Figure 85. Ascend Performance Materials Revenue Growth Rate in Engineering Plastic Business (2021–2026)
Figure 86. Kolon Plastics Revenue Growth Rate in Engineering Plastic Business (2021–2026)
Figure 87. Kuraray Revenue Growth Rate in Engineering Plastic Business (2021–2026)
Figure 88. Samyang Revenue Growth Rate in Engineering Plastic Business (2021–2026)
Figure 89. EMS-Grivory Revenue Growth Rate in Engineering Plastic Business (2021–2026)
Figure 90. Unitika Revenue Growth Rate in Engineering Plastic Business (2021–2026)
Figure 91. DOMO Chemicals Revenue Growth Rate in Engineering Plastic Business (2021–2026)
Figure 92. Grupa Azoty Revenue Growth Rate in Engineering Plastic Business (2021–2026)
Figure 93. LyondellBasell Revenue Growth Rate in Engineering Plastic Business (2021–2026)
Figure 94. Sinopec Revenue Growth Rate in Engineering Plastic Business (2021–2026)
Figure 95. Wanhua Chemical Revenue Growth Rate in Engineering Plastic Business (2021–2026)
Figure 96. Kingfa Revenue Growth Rate in Engineering Plastic Business (2021–2026)
Figure 97. Formosa Revenue Growth Rate in Engineering Plastic Business (2021–2026)
Figure 98. KKPC Revenue Growth Rate in Engineering Plastic Business (2021–2026)
Figure 99. RadiciGroup Revenue Growth Rate in Engineering Plastic Business (2021–2026)
Figure 100. Grand Pacific Petrochemical Revenue Growth Rate in Engineering Plastic Business (2021–2026)
Figure 101. DIC Revenue Growth Rate in Engineering Plastic Business (2021–2026)
Figure 102. Kureha Revenue Growth Rate in Engineering Plastic Business (2021–2026)
Figure 103. Polyplastics Revenue Growth Rate in Engineering Plastic Business (2021–2026)
Figure 104. Bottom-up and Top-down Approaches for This Report
Figure 105. Data Triangulation
Figure 106. Key Executives Interviewed