List of Tables
Table 1. Global Container Leasing Service Market Size Growth Rate by Type (US$ Million): 2021 vs 2025 vs 2032
Table 2. Key Players of Tank Container
Table 3. Key Players of Square Container
Table 4. Key Players of Others
Table 5. Global Container Leasing Service Market Size Growth Rate by Lease Type (US$ Million): 2021 vs 2025 vs 2032
Table 6. Key Players of Long-term Lease
Table 7. Key Players of Medium-term Lease
Table 8. Key Players of Short-term/Spot Lease
Table 9. Key Players of Finance Lease/Lease-to-Own
Table 10. Global Container Leasing Service Market Size Growth Rate by Container Type (US$ Million): 2021 vs 2025 vs 2032
Table 11. Key Players of Standard Dry Containers
Table 12. Key Players of Reefer Containers
Table 13. Key Players of Others
Table 14. Global Container Leasing Service Market Size Growth by Application (US$ Million): 2021 vs 2025 vs 2032
Table 15. Global Container Leasing Service Market Size by Region (US$ Million): 2021 vs 2025 vs 2032
Table 16. Global Container Leasing Service Market Size by Region (US$ Million), 2021–2026
Table 17. Global Container Leasing Service Market Share by Region (2021–2026)
Table 18. Global Container Leasing Service Forecasted Market Size by Region (US$ Million), 2027–2032
Table 19. Global Container Leasing Service Market Share by Region (2027–2032)
Table 20. Container Leasing Service Market Trends
Table 21. Container Leasing Service Market Drivers
Table 22. Container Leasing Service Market Challenges
Table 23. Container Leasing Service Market Restraints
Table 24. Global Container Leasing Service Revenue by Players (US$ Million), 2021–2026
Table 25. Global Container Leasing Service Market Share by Players (2021–2026)
Table 26. Global Top Container Leasing Service Players by Tier (Tier 1, Tier 2, and Tier 3), based on Container Leasing Service Revenue, 2025
Table 27. Ranking of Global Top Container Leasing Service Companies by Revenue (US$ Million) in 2025
Table 28. Global 5 Largest Players Market Share by Container Leasing Service Revenue (CR5 and HHI), 2021–2026
Table 29. Global Key Players of Container Leasing Service, Headquarters and Area Served
Table 30. Global Key Players of Container Leasing Service, Products and Applications
Table 31. Global Key Players of Container Leasing Service, Date of General Availability (GA)
Table 32. Mergers and Acquisitions, Expansion Plans
Table 33. Global Container Leasing Service Market Size by Type (US$ Million), 2021–2026
Table 34. Global Container Leasing Service Revenue Market Share by Type (2021–2026)
Table 35. Global Container Leasing Service Forecasted Market Size by Type (US$ Million), 2027–2032
Table 36. Global Container Leasing Service Revenue Market Share by Type (2027–2032)
Table 37. Global Container Leasing Service Market Size by Application (US$ Million), 2021–2026
Table 38. Global Container Leasing Service Revenue Market Share by Application (2021–2026)
Table 39. Global Container Leasing Service Forecasted Market Size by Application (US$ Million), 2027–2032
Table 40. Global Container Leasing Service Revenue Market Share by Application (2027–2032)
Table 41. North America Container Leasing Service Market Size Growth Rate by Country (US$ Million): 2021 vs 2025 vs 2032
Table 42. North America Container Leasing Service Market Size by Country (US$ Million), 2021–2026
Table 43. North America Container Leasing Service Market Size by Country (US$ Million), 2027–2032
Table 44. Europe Container Leasing Service Market Size Growth Rate by Country (US$ Million): 2021 vs 2025 vs 2032
Table 45. Europe Container Leasing Service Market Size by Country (US$ Million), 2021–2026
Table 46. Europe Container Leasing Service Market Size by Country (US$ Million), 2027–2032
Table 47. Asia-Pacific Container Leasing Service Market Size Growth Rate by Region (US$ Million): 2021 vs 2025 vs 2032
Table 48. Asia-Pacific Container Leasing Service Market Size by Region (US$ Million), 2021–2026
Table 49. Asia-Pacific Container Leasing Service Market Size by Region (US$ Million), 2027–2032
Table 50. Latin America Container Leasing Service Market Size Growth Rate by Country (US$ Million): 2021 vs 2025 vs 2032
Table 51. Latin America Container Leasing Service Market Size by Country (US$ Million), 2021–2026
Table 52. Latin America Container Leasing Service Market Size by Country (US$ Million), 2027–2032
Table 53. Middle East & Africa Container Leasing Service Market Size Growth Rate by Country (US$ Million): 2021 vs 2025 vs 2032
Table 54. Middle East & Africa Container Leasing Service Market Size by Country (US$ Million), 2021–2026
Table 55. Middle East & Africa Container Leasing Service Market Size by Country (US$ Million), 2027–2032
Table 56. MC Containers Company Details
Table 57. MC Containers Business Overview
Table 58. MC Containers Container Leasing Service Product
Table 59. MC Containers Revenue in Container Leasing Service Business (US$ Million), 2021–2026
Table 60. MC Containers Recent Development
Table 61. AB Sea Container Company Details
Table 62. AB Sea Container Business Overview
Table 63. AB Sea Container Container Leasing Service Product
Table 64. AB Sea Container Revenue in Container Leasing Service Business (US$ Million), 2021–2026
Table 65. AB Sea Container Recent Development
Table 66. Triton International Company Details
Table 67. Triton International Business Overview
Table 68. Triton International Container Leasing Service Product
Table 69. Triton International Revenue in Container Leasing Service Business (US$ Million), 2021–2026
Table 70. Triton International Recent Development
Table 71. Florens Company Details
Table 72. Florens Business Overview
Table 73. Florens Container Leasing Service Product
Table 74. Florens Revenue in Container Leasing Service Business (US$ Million), 2021–2026
Table 75. Florens Recent Development
Table 76. Textainer Company Details
Table 77. Textainer Business Overview
Table 78. Textainer Container Leasing Service Product
Table 79. Textainer Revenue in Container Leasing Service Business (US$ Million), 2021–2026
Table 80. Textainer Recent Development
Table 81. Seaco Global Company Details
Table 82. Seaco Global Business Overview
Table 83. Seaco Global Container Leasing Service Product
Table 84. Seaco Global Revenue in Container Leasing Service Business (US$ Million), 2021–2026
Table 85. Seaco Global Recent Development
Table 86. Beacon Intermodal Company Details
Table 87. Beacon Intermodal Business Overview
Table 88. Beacon Intermodal Container Leasing Service Product
Table 89. Beacon Intermodal Revenue in Container Leasing Service Business (US$ Million), 2021–2026
Table 90. Beacon Intermodal Recent Development
Table 91. Seacube Containers Company Details
Table 92. Seacube Containers Business Overview
Table 93. Seacube Containers Container Leasing Service Product
Table 94. Seacube Containers Revenue in Container Leasing Service Business (US$ Million), 2021–2026
Table 95. Seacube Containers Recent Development
Table 96. CAI Company Details
Table 97. CAI Business Overview
Table 98. CAI Container Leasing Service Product
Table 99. CAI Revenue in Container Leasing Service Business (US$ Million), 2021–2026
Table 100. CAI Recent Development
Table 101. Touax Company Details
Table 102. Touax Business Overview
Table 103. Touax Container Leasing Service Product
Table 104. Touax Revenue in Container Leasing Service Business (US$ Million), 2021–2026
Table 105. Touax Recent Development
Table 106. Blue Sky Intermodal Company Details
Table 107. Blue Sky Intermodal Business Overview
Table 108. Blue Sky Intermodal Container Leasing Service Product
Table 109. Blue Sky Intermodal Revenue in Container Leasing Service Business (US$ Million), 2021–2026
Table 110. Blue Sky Intermodal Recent Development
Table 111. CARU Containers Company Details
Table 112. CARU Containers Business Overview
Table 113. CARU Containers Container Leasing Service Product
Table 114. CARU Containers Revenue in Container Leasing Service Business (US$ Million), 2021–2026
Table 115. CARU Containers Recent Development
Table 116. Raffles Lease Company Details
Table 117. Raffles Lease Business Overview
Table 118. Raffles Lease Container Leasing Service Product
Table 119. Raffles Lease Revenue in Container Leasing Service Business (US$ Million), 2021–2026
Table 120. Raffles Lease Recent Development
Table 121. Trident Company Details
Table 122. Trident Business Overview
Table 123. Trident Container Leasing Service Product
Table 124. Trident Revenue in Container Leasing Service Business (US$ Million), 2021–2026
Table 125. Trident Recent Development
Table 126. Unitas Company Details
Table 127. Unitas Business Overview
Table 128. Unitas Container Leasing Service Product
Table 129. Unitas Revenue in Container Leasing Service Business (US$ Million), 2021–2026
Table 130. Unitas Recent Development
Table 131. Conical Company Details
Table 132. Conical Business Overview
Table 133. Conical Container Leasing Service Product
Table 134. Conical Revenue in Container Leasing Service Business (US$ Million), 2021–2026
Table 135. Conical Recent Development
Table 136. Container Rental Company Company Details
Table 137. Container Rental Company Business Overview
Table 138. Container Rental Company Container Leasing Service Product
Table 139. Container Rental Company Revenue in Container Leasing Service Business (US$ Million), 2021–2026
Table 140. Container Rental Company Recent Development
Table 141. Alconet Company Details
Table 142. Alconet Business Overview
Table 143. Alconet Container Leasing Service Product
Table 144. Alconet Revenue in Container Leasing Service Business (US$ Million), 2021–2026
Table 145. Alconet Recent Development
Table 146. RAVA Group Company Details
Table 147. RAVA Group Business Overview
Table 148. RAVA Group Container Leasing Service Product
Table 149. RAVA Group Revenue in Container Leasing Service Business (US$ Million), 2021–2026
Table 150. RAVA Group Recent Development
Table 151. K-tainer Company Details
Table 152. K-tainer Business Overview
Table 153. K-tainer Container Leasing Service Product
Table 154. K-tainer Revenue in Container Leasing Service Business (US$ Million), 2021–2026
Table 155. K-tainer Recent Development
Table 156. arkcontainer Company Details
Table 157. arkcontainer Business Overview
Table 158. arkcontainer Container Leasing Service Product
Table 159. arkcontainer Revenue in Container Leasing Service Business (US$ Million), 2021–2026
Table 160. arkcontainer Recent Development
Table 161. Container Services Company Details
Table 162. Container Services Business Overview
Table 163. Container Services Container Leasing Service Product
Table 164. Container Services Revenue in Container Leasing Service Business (US$ Million), 2021–2026
Table 165. Container Services Recent Development
Table 166. Brooks Company Details
Table 167. Brooks Business Overview
Table 168. Brooks Container Leasing Service Product
Table 169. Brooks Revenue in Container Leasing Service Business (US$ Million), 2021–2026
Table 170. Brooks Recent Development
Table 171. MK Containers Company Details
Table 172. MK Containers Business Overview
Table 173. MK Containers Container Leasing Service Product
Table 174. MK Containers Revenue in Container Leasing Service Business (US$ Million), 2021–2026
Table 175. MK Containers Recent Development
Table 176. OV Lahtinen Company Details
Table 177. OV Lahtinen Business Overview
Table 178. OV Lahtinen Container Leasing Service Product
Table 179. OV Lahtinen Revenue in Container Leasing Service Business (US$ Million), 2021–2026
Table 180. OV Lahtinen Recent Development
Table 181. SeaCube Company Details
Table 182. SeaCube Business Overview
Table 183. SeaCube Container Leasing Service Product
Table 184. SeaCube Revenue in Container Leasing Service Business (US$ Million), 2021–2026
Table 185. SeaCube Recent Development
Table 186. CS Leasing Company Details
Table 187. CS Leasing Business Overview
Table 188. CS Leasing Container Leasing Service Product
Table 189. CS Leasing Revenue in Container Leasing Service Business (US$ Million), 2021–2026
Table 190. CS Leasing Recent Development
Table 191. Railion Company Details
Table 192. Railion Business Overview
Table 193. Railion Container Leasing Service Product
Table 194. Railion Revenue in Container Leasing Service Business (US$ Million), 2021–2026
Table 195. Railion Recent Development
Table 196. Trifleet Leasing Company Details
Table 197. Trifleet Leasing Business Overview
Table 198. Trifleet Leasing Container Leasing Service Product
Table 199. Trifleet Leasing Revenue in Container Leasing Service Business (US$ Million), 2021–2026
Table 200. Trifleet Leasing Recent Development
Table 201. Bofort Company Details
Table 202. Bofort Business Overview
Table 203. Bofort Container Leasing Service Product
Table 204. Bofort Revenue in Container Leasing Service Business (US$ Million), 2021–2026
Table 205. Bofort Recent Development
Table 206. VTG Tanktainer Company Details
Table 207. VTG Tanktainer Business Overview
Table 208. VTG Tanktainer Container Leasing Service Product
Table 209. VTG Tanktainer Revenue in Container Leasing Service Business (US$ Million), 2021–2026
Table 210. VTG Tanktainer Recent Development
Table 211. LOTUS Containers Company Details
Table 212. LOTUS Containers Business Overview
Table 213. LOTUS Containers Container Leasing Service Product
Table 214. LOTUS Containers Revenue in Container Leasing Service Business (US$ Million), 2021–2026
Table 215. LOTUS Containers Recent Development
Table 216. NWCS Company Details
Table 217. NWCS Business Overview
Table 218. NWCS Container Leasing Service Product
Table 219. NWCS Revenue in Container Leasing Service Business (US$ Million), 2021–2026
Table 220. NWCS Recent Development
Table 221. Trans Asia Company Details
Table 222. Trans Asia Business Overview
Table 223. Trans Asia Container Leasing Service Product
Table 224. Trans Asia Revenue in Container Leasing Service Business (US$ Million), 2021–2026
Table 225. Trans Asia Recent Development
Table 226. Xines Company Details
Table 227. Xines Business Overview
Table 228. Xines Container Leasing Service Product
Table 229. Xines Revenue in Container Leasing Service Business (US$ Million), 2021–2026
Table 230. Xines Recent Development
Table 231. McLarens Logistics Group Company Details
Table 232. McLarens Logistics Group Business Overview
Table 233. McLarens Logistics Group Container Leasing Service Product
Table 234. McLarens Logistics Group Revenue in Container Leasing Service Business (US$ Million), 2021–2026
Table 235. McLarens Logistics Group Recent Development
Table 236. One Way Lease Company Details
Table 237. One Way Lease Business Overview
Table 238. One Way Lease Container Leasing Service Product
Table 239. One Way Lease Revenue in Container Leasing Service Business (US$ Million), 2021–2026
Table 240. One Way Lease Recent Development
Table 241. Eagle Leasing Company Details
Table 242. Eagle Leasing Business Overview
Table 243. Eagle Leasing Container Leasing Service Product
Table 244. Eagle Leasing Revenue in Container Leasing Service Business (US$ Million), 2021–2026
Table 245. Eagle Leasing Recent Development
Table 246. Maxon Company Details
Table 247. Maxon Business Overview
Table 248. Maxon Container Leasing Service Product
Table 249. Maxon Revenue in Container Leasing Service Business (US$ Million), 2021–2026
Table 250. Maxon Recent Development
Table 251. Peacock Container Company Details
Table 252. Peacock Container Business Overview
Table 253. Peacock Container Container Leasing Service Product
Table 254. Peacock Container Revenue in Container Leasing Service Business (US$ Million), 2021–2026
Table 255. Peacock Container Recent Development
Table 256. Research Programs/Design for This Report
Table 257. Key Data Information from Secondary Sources
Table 258. Key Data Information from Primary Sources
Table 259. Authors List of This Report
List of Figures
Figure 1. Container Leasing Service Picture
Figure 2. Global Container Leasing Service Market Size Comparison by Type (US$ Million), 2021–2032
Figure 3. Global Container Leasing Service Market Share by Type: 2025 vs 2032
Figure 4. Tank Container Features
Figure 5. Square Container Features
Figure 6. Others Features
Figure 7. Global Container Leasing Service Market Size Comparison by Lease Type (US$ Million), 2021–2032
Figure 8. Long-term Lease Features
Figure 9. Medium-term Lease Features
Figure 10. Short-term/Spot Lease Features
Figure 11. Finance Lease/Lease-to-Own Features
Figure 12. Global Container Leasing Service Market Size Comparison by Container Type (US$ Million), 2021–2032
Figure 13. Standard Dry Containers Features
Figure 14. Reefer Containers Features
Figure 15. Others Features
Figure 16. Global Container Leasing Service Market Size by Application (US$ Million), 2021–2032
Figure 17. Global Container Leasing Service Market Share by Application: 2025 vs 2032
Figure 18. Equipment Case Studies
Figure 19. Food Case Studies
Figure 20. Drug Case Studies
Figure 21. Others Case Studies
Figure 22. Container Leasing Service Report Years Considered
Figure 23. Global Container Leasing Service Market Size (US$ Million), Year-over-Year: 2021–2032
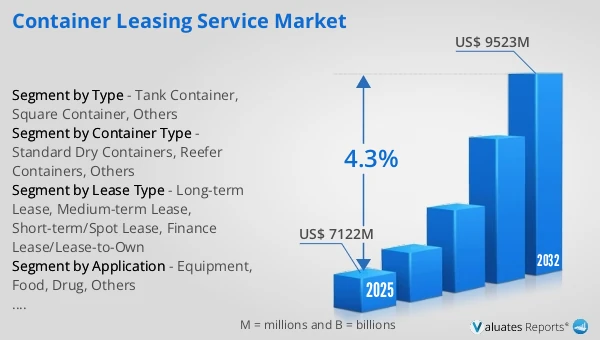
Figure 24. Global Container Leasing Service Market Size, (US$ Million), 2021 vs 2025 vs 2032
Figure 25. Global Container Leasing Service Market Share by Region: 2025 vs 2032
Figure 26. Global Container Leasing Service Market Share by Players in 2025
Figure 27. Global Container Leasing Service Market Share by Company Type (Tier 1, Tier 2, and Tier 3)
Figure 28. The Top 10 and 5 Players Market Share by Container Leasing Service Revenue in 2025
Figure 29. North America Container Leasing Service Market Size YoY Growth (US$ Million), 2021–2032
Figure 30. North America Container Leasing Service Market Share by Country (2021–2032)
Figure 31. United States Container Leasing Service Market Size YoY Growth (US$ Million), 2021–2032
Figure 32. Canada Container Leasing Service Market Size YoY Growth (US$ Million), 2021–2032
Figure 33. Europe Container Leasing Service Market Size YoY Growth (US$ Million), 2021–2032
Figure 34. Europe Container Leasing Service Market Share by Country (2021–2032)
Figure 35. Germany Container Leasing Service Market Size YoY Growth (US$ Million), 2021–2032
Figure 36. France Container Leasing Service Market Size YoY Growth (US$ Million), 2021–2032
Figure 37. U.K. Container Leasing Service Market Size YoY Growth (US$ Million), 2021–2032
Figure 38. Italy Container Leasing Service Market Size YoY Growth (US$ Million), 2021–2032
Figure 39. Russia Container Leasing Service Market Size YoY Growth (US$ Million), 2021–2032
Figure 40. Ireland Container Leasing Service Market Size YoY Growth (US$ Million), 2021–2032
Figure 41. Asia-Pacific Container Leasing Service Market Size YoY Growth (US$ Million), 2021–2032
Figure 42. Asia-Pacific Container Leasing Service Market Share by Region (2021–2032)
Figure 43. China Container Leasing Service Market Size YoY Growth (US$ Million), 2021–2032
Figure 44. Japan Container Leasing Service Market Size YoY Growth (US$ Million), 2021–2032
Figure 45. South Korea Container Leasing Service Market Size YoY Growth (US$ Million), 2021–2032
Figure 46. Southeast Asia Container Leasing Service Market Size YoY Growth (US$ Million), 2021–2032
Figure 47. India Container Leasing Service Market Size YoY Growth (US$ Million), 2021–2032
Figure 48. Australia & New Zealand Container Leasing Service Market Size YoY Growth (US$ Million), 2021–2032
Figure 49. Latin America Container Leasing Service Market Size YoY Growth (US$ Million), 2021–2032
Figure 50. Latin America Container Leasing Service Market Share by Country (2021–2032)
Figure 51. Mexico Container Leasing Service Market Size YoY Growth (US$ Million), 2021–2032
Figure 52. Brazil Container Leasing Service Market Size YoY Growth (US$ Million), 2021–2032
Figure 53. Middle East & Africa Container Leasing Service Market Size YoY Growth (US$ Million), 2021–2032
Figure 54. Middle East & Africa Container Leasing Service Market Share by Country (2021–2032)
Figure 55. Israel Container Leasing Service Market Size YoY Growth (US$ Million), 2021–2032
Figure 56. Saudi Arabia Container Leasing Service Market Size YoY Growth (US$ Million), 2021–2032
Figure 57. UAE Container Leasing Service Market Size YoY Growth (US$ Million), 2021–2032
Figure 58. MC Containers Revenue Growth Rate in Container Leasing Service Business (2021–2026)
Figure 59. AB Sea Container Revenue Growth Rate in Container Leasing Service Business (2021–2026)
Figure 60. Triton International Revenue Growth Rate in Container Leasing Service Business (2021–2026)
Figure 61. Florens Revenue Growth Rate in Container Leasing Service Business (2021–2026)
Figure 62. Textainer Revenue Growth Rate in Container Leasing Service Business (2021–2026)
Figure 63. Seaco Global Revenue Growth Rate in Container Leasing Service Business (2021–2026)
Figure 64. Beacon Intermodal Revenue Growth Rate in Container Leasing Service Business (2021–2026)
Figure 65. Seacube Containers Revenue Growth Rate in Container Leasing Service Business (2021–2026)
Figure 66. CAI Revenue Growth Rate in Container Leasing Service Business (2021–2026)
Figure 67. Touax Revenue Growth Rate in Container Leasing Service Business (2021–2026)
Figure 68. Blue Sky Intermodal Revenue Growth Rate in Container Leasing Service Business (2021–2026)
Figure 69. CARU Containers Revenue Growth Rate in Container Leasing Service Business (2021–2026)
Figure 70. Raffles Lease Revenue Growth Rate in Container Leasing Service Business (2021–2026)
Figure 71. Trident Revenue Growth Rate in Container Leasing Service Business (2021–2026)
Figure 72. Unitas Revenue Growth Rate in Container Leasing Service Business (2021–2026)
Figure 73. Conical Revenue Growth Rate in Container Leasing Service Business (2021–2026)
Figure 74. Container Rental Company Revenue Growth Rate in Container Leasing Service Business (2021–2026)
Figure 75. Alconet Revenue Growth Rate in Container Leasing Service Business (2021–2026)
Figure 76. RAVA Group Revenue Growth Rate in Container Leasing Service Business (2021–2026)
Figure 77. K-tainer Revenue Growth Rate in Container Leasing Service Business (2021–2026)
Figure 78. arkcontainer Revenue Growth Rate in Container Leasing Service Business (2021–2026)
Figure 79. Container Services Revenue Growth Rate in Container Leasing Service Business (2021–2026)
Figure 80. Brooks Revenue Growth Rate in Container Leasing Service Business (2021–2026)
Figure 81. MK Containers Revenue Growth Rate in Container Leasing Service Business (2021–2026)
Figure 82. OV Lahtinen Revenue Growth Rate in Container Leasing Service Business (2021–2026)
Figure 83. SeaCube Revenue Growth Rate in Container Leasing Service Business (2021–2026)
Figure 84. CS Leasing Revenue Growth Rate in Container Leasing Service Business (2021–2026)
Figure 85. Railion Revenue Growth Rate in Container Leasing Service Business (2021–2026)
Figure 86. Trifleet Leasing Revenue Growth Rate in Container Leasing Service Business (2021–2026)
Figure 87. Bofort Revenue Growth Rate in Container Leasing Service Business (2021–2026)
Figure 88. VTG Tanktainer Revenue Growth Rate in Container Leasing Service Business (2021–2026)
Figure 89. LOTUS Containers Revenue Growth Rate in Container Leasing Service Business (2021–2026)
Figure 90. NWCS Revenue Growth Rate in Container Leasing Service Business (2021–2026)
Figure 91. Trans Asia Revenue Growth Rate in Container Leasing Service Business (2021–2026)
Figure 92. Xines Revenue Growth Rate in Container Leasing Service Business (2021–2026)
Figure 93. McLarens Logistics Group Revenue Growth Rate in Container Leasing Service Business (2021–2026)
Figure 94. One Way Lease Revenue Growth Rate in Container Leasing Service Business (2021–2026)
Figure 95. Eagle Leasing Revenue Growth Rate in Container Leasing Service Business (2021–2026)
Figure 96. Maxon Revenue Growth Rate in Container Leasing Service Business (2021–2026)
Figure 97. Peacock Container Revenue Growth Rate in Container Leasing Service Business (2021–2026)
Figure 98. Bottom-up and Top-down Approaches for This Report
Figure 99. Data Triangulation
Figure 100. Key Executives Interviewed