0
U.S. (TOLL FREE)
+1 (315) 215-3225
Automative

0
U.S. (TOLL FREE)
+1 (315) 215-3225
Global Multidimensional Force Perception Solution Market Research Report 2025
Published Date: November 2025
|
Report Code: QYRE-Auto-19S20196
Home | Market Reports | Computers & Electronics| Software
Global Multidimensional Force Perception Solution Market Research Report 2025
BUY CHAPTERS

Global Multidimensional Force Perception Solution Market Research Report 2025

Code: QYRE-Auto-19S20196
Report
November 2025
Pages:94
QYResearch
Buy Now with 15% Discount
DESCRIPTION
TABLE OF CONTENT
TABLES & FIGURES

Multidimensional Force Perception Solution Market Size

The global market for Multidimensional Force Perception Solution was valued at US$ 1203 million in the year 2024 and is projected to reach a revised size of US$ 1964 million by 2031, growing at a CAGR of 7.3% during the forecast period.

Multidimensional Force Perception Solution Market

Multidimensional Force Perception Solution Market

Multidimensional force sensing solutions refer to a systematic approach that integrates multi-sensor technology, signal acquisition, and algorithm modeling to achieve precise detection and intelligent sensing of multidimensional physical quantities such as force, pressure, torque, vibration, and displacement. This solution typically integrates high-sensitivity sensor arrays, real-time data acquisition modules, AI sensing algorithms, and feedback control systems to reconstruct human or mechanical tactile experiences, enabling devices to achieve precise operation and interaction in complex environments. It is widely used in robotics, intelligent manufacturing, medical rehabilitation, virtual reality, and automotive electronics, providing systems with high-precision force control and tactile feedback capabilities, and is a crucial foundational technology for achieving intelligent interaction and flexible operation.
The downstream applications of multidimensional force sensing solutions are extensive, primarily including industrial robots and collaborative robots, intelligent manufacturing equipment, medical rehabilitation and surgical robots, virtual reality and tactile interaction systems, automotive intelligent safety systems, and precision testing equipment. In these fields, force sensing technology can significantly improve the accuracy, safety, and human-machine interaction experience of equipment, becoming a key element in achieving intelligent and flexible operation. Due to the high barriers to entry in its core technologies and the stringent requirements for hardware precision and algorithm performance, products in this field generally possess strong added value and pricing power, with the overall industry gross profit margin typically around 53%.
The market demand for multi-dimensional force sensing solutions is primarily driven by the trends of intelligentization, automation, and human-machine collaboration. With the rapid development of high-precision applications such as industrial robots, service robots, intelligent manufacturing equipment, and medical surgical robots, the market demand for sensing systems with sensitive tactile feedback, force control, and high dynamic response capabilities continues to rise. Simultaneously, emerging fields such as virtual reality, augmented reality, and remote control are also placing higher demands on realistic tactile reproduction, further expanding the application space. Downstream enterprises generally hope to improve operational accuracy, safety, and interactive experience through multi-dimensional force sensing technology to achieve higher levels of intelligent control and flexible production; therefore, this type of solution has a rigid demand with continued growth in the future.
North American market for Multidimensional Force Perception Solution is estimated to increase from $ million in 2024 to reach $ million by 2031, at a CAGR of % during the forecast period of 2025 through 2031.
Asia-Pacific market for Multidimensional Force Perception Solution is estimated to increase from $ million in 2024 to reach $ million by 2031, at a CAGR of % during the forecast period of 2025 through 2031.
The global market for Multidimensional Force Perception Solution in Intelligent Manufacturing is estimated to increase from $ million in 2024 to $ million by 2031, at a CAGR of % during the forecast period of 2025 through 2031.
The major global companies of Multidimensional Force Perception Solution include Tekscan, SynTouch, ATI Industrial Automation, Robotiq, OnRobot, Schunk, Pressure Profile Systems, XELA Robotics, GelSight, OptoForce, etc. In 2024, the world's top three vendors accounted for approximately % of the revenue.
This report aims to provide a comprehensive presentation of the global market for Multidimensional Force Perception Solution, with both quantitative and qualitative analysis, to help readers develop business/growth strategies, assess the market competitive situation, analyze their position in the current marketplace, and make informed business decisions regarding Multidimensional Force Perception Solution.
The Multidimensional Force Perception Solution market size, estimations, and forecasts are provided in terms of and revenue ($ millions), considering 2024 as the base year, with history and forecast data for the period from 2020 to 2031. This report segments the global Multidimensional Force Perception Solution market comprehensively. Regional market sizes, concerning products by Type, by Application, by Sensing Principle and by players, are also provided.
For a more in-depth understanding of the market, the report provides profiles of the competitive landscape, key competitors, and their respective market ranks. The report also discusses technological trends and new product developments.
The report will help the Multidimensional Force Perception Solution companies, new entrants, and industry chain related companies in this market with information on the revenues for the overall market and the sub-segments across the different segments, by company, by Type, by Application, and by regions.
Market Segmentation

Scope of Multidimensional Force Perception Solution Market Report

Report Metric Details
Report Name Multidimensional Force Perception Solution Market
Accounted market size in year US$ 1203 million
Forecasted market size in 2031 US$ 1964 million
CAGR 7.3%
Base Year year
Forecasted years 2025 - 2031
Segment by Type
  • Single-Axis Force Sensing Solution
  • Multi-Axis Force Sensing Solution
Segment by Sensing Principle
  • Strain Gauge Force Sensing Solutions
  • Piezoelectric Force Sensing Solutions
  • Optical Force Sensing Solutions
Segment by System Level
  • Sensor-Level Solutions
  • System-Level Solutions
  • Platform-Level Solutions
Segment by Application
  • Intelligent Manufacturing
  • Medical Industry
  • Automotive Electronics
  • Scientific Research and Education
By Region
  • North America (United States, Canada)
  • Europe (Germany, France, UK, Italy, Russia) Rest of Europe
  • Nordic Countries
  • Asia-Pacific (China, Japan, South Korea)
  • Southeast Asia (India, Australia)
  • Rest of Asia
  • Latin America (Mexico, Brazil)
  • Rest of Latin America
  • Middle East & Africa (Turkey, Saudi Arabia, UAE, Rest of MEA)
By Company Tekscan, SynTouch, ATI Industrial Automation, Robotiq, OnRobot, Schunk, Pressure Profile Systems, XELA Robotics, GelSight, OptoForce, Peratech, Force Dimension, SenseGlove, HaptX, Tanvas, bHaptics
Forecast units USD million in value
Report coverage Revenue and volume forecast, company share, competitive landscape, growth factors and trends

Chapter Outline

  • Chapter 1: Introduces the report scope of the report, executive summary of different market segments (by Type, by Application, by Sensing Principle etc), including the market size of each market segment, future development potential, and so on. It offers a high-level view of the current state of the market and its likely evolution in the short to mid-term, and long term.
  • Chapter 2: Introduces executive summary of global market size, regional market size, this section also introduces the market dynamics, latest developments of the market, the driving factors and restrictive factors of the market, the challenges and risks faced by companies in the industry, and the analysis of relevant policies in the industry.
  • Chapter 3: Detailed analysis of Multidimensional Force Perception Solution company competitive landscape, revenue market share, latest development plan, merger, and acquisition information, etc.
  • Chapter 4: Provides the analysis of various market segments by Type, covering the market size and development potential of each market segment, to help readers find the blue ocean market in different market segments.
  • Chapter 5: Provides the analysis of various market segments by Application, covering the market size and development potential of each market segment, to help readers find the blue ocean market in different downstream markets.
  • Chapter 6, 7, 8, 9, 10: North America, Europe, Asia Pacific, Latin America, Middle East and Africa segment by country. It provides a quantitative analysis of the market size and development potential of each region and its main countries and introduces the market development, future development prospects, market space, and capacity of each country in the world.
  • Chapter 11: Provides profiles of key players, introducing the basic situation of the main companies in the market in detail, including product sales, revenue, price, gross margin, product introduction, recent development, etc.
  • Chapter 12: The main points and conclusions of the report.

FAQ for this report

How fast is Multidimensional Force Perception Solution Market growing?

Ans: The Multidimensional Force Perception Solution Market witnessing a CAGR of 7.3% during the forecast period 2025-2031.

What is the Multidimensional Force Perception Solution Market size in 2031?

Ans: The Multidimensional Force Perception Solution Market size in 2031 will be US$ 1964 million.

Who are the main players in the Multidimensional Force Perception Solution Market report?

Ans: The main players in the Multidimensional Force Perception Solution Market are Tekscan, SynTouch, ATI Industrial Automation, Robotiq, OnRobot, Schunk, Pressure Profile Systems, XELA Robotics, GelSight, OptoForce, Peratech, Force Dimension, SenseGlove, HaptX, Tanvas, bHaptics

What are the Application segmentation covered in the Multidimensional Force Perception Solution Market report?

Ans: The Applications covered in the Multidimensional Force Perception Solution Market report are Intelligent Manufacturing, Medical Industry, Automotive Electronics, Scientific Research and Education

What are the Type segmentation covered in the Multidimensional Force Perception Solution Market report?

Ans: The Types covered in the Multidimensional Force Perception Solution Market report are Single-Axis Force Sensing Solution, Multi-Axis Force Sensing Solution

1 Report Overview
1.1 Study Scope
1.2 Market Analysis by Type
1.2.1 Global Multidimensional Force Perception Solution Market Size Growth Rate by Type: 2020 VS 2024 VS 2031
1.2.2 Single-Axis Force Sensing Solution
1.2.3 Multi-Axis Force Sensing Solution
1.3 Market by Sensing Principle
1.3.1 Global Multidimensional Force Perception Solution Market Size Growth Rate by Sensing Principle: 2020 VS 2024 VS 2031
1.3.2 Strain Gauge Force Sensing Solutions
1.3.3 Piezoelectric Force Sensing Solutions
1.3.4 Optical Force Sensing Solutions
1.4 Market by System Level
1.4.1 Global Multidimensional Force Perception Solution Market Size Growth Rate by System Level: 2020 VS 2024 VS 2031
1.4.2 Sensor-Level Solutions
1.4.3 System-Level Solutions
1.4.4 Platform-Level Solutions
1.5 Market by Application
1.5.1 Global Multidimensional Force Perception Solution Market Growth by Application: 2020 VS 2024 VS 2031
1.5.2 Intelligent Manufacturing
1.5.3 Medical Industry
1.5.4 Automotive Electronics
1.5.5 Scientific Research and Education
1.6 Assumptions and Limitations
1.7 Study Objectives
1.8 Years Considered
2 Global Growth Trends
2.1 Global Multidimensional Force Perception Solution Market Perspective (2020-2031)
2.2 Global Multidimensional Force Perception Solution Growth Trends by Region
2.2.1 Global Multidimensional Force Perception Solution Market Size by Region: 2020 VS 2024 VS 2031
2.2.2 Multidimensional Force Perception Solution Historic Market Size by Region (2020-2025)
2.2.3 Multidimensional Force Perception Solution Forecasted Market Size by Region (2026-2031)
2.3 Multidimensional Force Perception Solution Market Dynamics
2.3.1 Multidimensional Force Perception Solution Industry Trends
2.3.2 Multidimensional Force Perception Solution Market Drivers
2.3.3 Multidimensional Force Perception Solution Market Challenges
2.3.4 Multidimensional Force Perception Solution Market Restraints
3 Competition Landscape by Key Players
3.1 Global Top Multidimensional Force Perception Solution Players by Revenue
3.1.1 Global Top Multidimensional Force Perception Solution Players by Revenue (2020-2025)
3.1.2 Global Multidimensional Force Perception Solution Revenue Market Share by Players (2020-2025)
3.2 Global Top Multidimensional Force Perception Solution Players by Company Type and Market Share by Company Type (Tier 1, Tier 2, and Tier 3)
3.3 Global Key Players Ranking by Multidimensional Force Perception Solution Revenue
3.4 Global Multidimensional Force Perception Solution Market Concentration Ratio
3.4.1 Global Multidimensional Force Perception Solution Market Concentration Ratio (CR5 and HHI)
3.4.2 Global Top 10 and Top 5 Companies by Multidimensional Force Perception Solution Revenue in 2024
3.5 Global Key Players of Multidimensional Force Perception Solution Head office and Area Served
3.6 Global Key Players of Multidimensional Force Perception Solution, Product and Application
3.7 Global Key Players of Multidimensional Force Perception Solution, Date of Enter into This Industry
3.8 Mergers & Acquisitions, Expansion Plans
4 Multidimensional Force Perception Solution Breakdown Data by Type
4.1 Global Multidimensional Force Perception Solution Historic Market Size by Type (2020-2025)
4.2 Global Multidimensional Force Perception Solution Forecasted Market Size by Type (2026-2031)
5 Multidimensional Force Perception Solution Breakdown Data by Application
5.1 Global Multidimensional Force Perception Solution Historic Market Size by Application (2020-2025)
5.2 Global Multidimensional Force Perception Solution Forecasted Market Size by Application (2026-2031)
6 North America
6.1 North America Multidimensional Force Perception Solution Market Size (2020-2031)
6.2 North America Multidimensional Force Perception Solution Market Growth Rate by Country: 2020 VS 2024 VS 2031
6.3 North America Multidimensional Force Perception Solution Market Size by Country (2020-2025)
6.4 North America Multidimensional Force Perception Solution Market Size by Country (2026-2031)
6.5 United States
6.6 Canada
7 Europe
7.1 Europe Multidimensional Force Perception Solution Market Size (2020-2031)
7.2 Europe Multidimensional Force Perception Solution Market Growth Rate by Country: 2020 VS 2024 VS 2031
7.3 Europe Multidimensional Force Perception Solution Market Size by Country (2020-2025)
7.4 Europe Multidimensional Force Perception Solution Market Size by Country (2026-2031)
7.5 Germany
7.6 France
7.7 U.K.
7.8 Italy
7.9 Russia
7.10 Ireland
8 Asia-Pacific
8.1 Asia-Pacific Multidimensional Force Perception Solution Market Size (2020-2031)
8.2 Asia-Pacific Multidimensional Force Perception Solution Market Growth Rate by Region: 2020 VS 2024 VS 2031
8.3 Asia-Pacific Multidimensional Force Perception Solution Market Size by Region (2020-2025)
8.4 Asia-Pacific Multidimensional Force Perception Solution Market Size by Region (2026-2031)
8.5 China
8.6 Japan
8.7 South Korea
8.8 Southeast Asia
8.9 India
8.10 Australia & New Zealand
9 Latin America
9.1 Latin America Multidimensional Force Perception Solution Market Size (2020-2031)
9.2 Latin America Multidimensional Force Perception Solution Market Growth Rate by Country: 2020 VS 2024 VS 2031
9.3 Latin America Multidimensional Force Perception Solution Market Size by Country (2020-2025)
9.4 Latin America Multidimensional Force Perception Solution Market Size by Country (2026-2031)
9.5 Mexico
9.6 Brazil
10 Middle East & Africa
10.1 Middle East & Africa Multidimensional Force Perception Solution Market Size (2020-2031)
10.2 Middle East & Africa Multidimensional Force Perception Solution Market Growth Rate by Country: 2020 VS 2024 VS 2031
10.3 Middle East & Africa Multidimensional Force Perception Solution Market Size by Country (2020-2025)
10.4 Middle East & Africa Multidimensional Force Perception Solution Market Size by Country (2026-2031)
10.5 Israel
10.6 Saudi Arabia
10.7 UAE
11 Key Players Profiles
11.1 Tekscan
11.1.1 Tekscan Company Details
11.1.2 Tekscan Business Overview
11.1.3 Tekscan Multidimensional Force Perception Solution Introduction
11.1.4 Tekscan Revenue in Multidimensional Force Perception Solution Business (2020-2025)
11.1.5 Tekscan Recent Development
11.2 SynTouch
11.2.1 SynTouch Company Details
11.2.2 SynTouch Business Overview
11.2.3 SynTouch Multidimensional Force Perception Solution Introduction
11.2.4 SynTouch Revenue in Multidimensional Force Perception Solution Business (2020-2025)
11.2.5 SynTouch Recent Development
11.3 ATI Industrial Automation
11.3.1 ATI Industrial Automation Company Details
11.3.2 ATI Industrial Automation Business Overview
11.3.3 ATI Industrial Automation Multidimensional Force Perception Solution Introduction
11.3.4 ATI Industrial Automation Revenue in Multidimensional Force Perception Solution Business (2020-2025)
11.3.5 ATI Industrial Automation Recent Development
11.4 Robotiq
11.4.1 Robotiq Company Details
11.4.2 Robotiq Business Overview
11.4.3 Robotiq Multidimensional Force Perception Solution Introduction
11.4.4 Robotiq Revenue in Multidimensional Force Perception Solution Business (2020-2025)
11.4.5 Robotiq Recent Development
11.5 OnRobot
11.5.1 OnRobot Company Details
11.5.2 OnRobot Business Overview
11.5.3 OnRobot Multidimensional Force Perception Solution Introduction
11.5.4 OnRobot Revenue in Multidimensional Force Perception Solution Business (2020-2025)
11.5.5 OnRobot Recent Development
11.6 Schunk
11.6.1 Schunk Company Details
11.6.2 Schunk Business Overview
11.6.3 Schunk Multidimensional Force Perception Solution Introduction
11.6.4 Schunk Revenue in Multidimensional Force Perception Solution Business (2020-2025)
11.6.5 Schunk Recent Development
11.7 Pressure Profile Systems
11.7.1 Pressure Profile Systems Company Details
11.7.2 Pressure Profile Systems Business Overview
11.7.3 Pressure Profile Systems Multidimensional Force Perception Solution Introduction
11.7.4 Pressure Profile Systems Revenue in Multidimensional Force Perception Solution Business (2020-2025)
11.7.5 Pressure Profile Systems Recent Development
11.8 XELA Robotics
11.8.1 XELA Robotics Company Details
11.8.2 XELA Robotics Business Overview
11.8.3 XELA Robotics Multidimensional Force Perception Solution Introduction
11.8.4 XELA Robotics Revenue in Multidimensional Force Perception Solution Business (2020-2025)
11.8.5 XELA Robotics Recent Development
11.9 GelSight
11.9.1 GelSight Company Details
11.9.2 GelSight Business Overview
11.9.3 GelSight Multidimensional Force Perception Solution Introduction
11.9.4 GelSight Revenue in Multidimensional Force Perception Solution Business (2020-2025)
11.9.5 GelSight Recent Development
11.10 OptoForce
11.10.1 OptoForce Company Details
11.10.2 OptoForce Business Overview
11.10.3 OptoForce Multidimensional Force Perception Solution Introduction
11.10.4 OptoForce Revenue in Multidimensional Force Perception Solution Business (2020-2025)
11.10.5 OptoForce Recent Development
11.11 Peratech
11.11.1 Peratech Company Details
11.11.2 Peratech Business Overview
11.11.3 Peratech Multidimensional Force Perception Solution Introduction
11.11.4 Peratech Revenue in Multidimensional Force Perception Solution Business (2020-2025)
11.11.5 Peratech Recent Development
11.12 Force Dimension
11.12.1 Force Dimension Company Details
11.12.2 Force Dimension Business Overview
11.12.3 Force Dimension Multidimensional Force Perception Solution Introduction
11.12.4 Force Dimension Revenue in Multidimensional Force Perception Solution Business (2020-2025)
11.12.5 Force Dimension Recent Development
11.13 SenseGlove
11.13.1 SenseGlove Company Details
11.13.2 SenseGlove Business Overview
11.13.3 SenseGlove Multidimensional Force Perception Solution Introduction
11.13.4 SenseGlove Revenue in Multidimensional Force Perception Solution Business (2020-2025)
11.13.5 SenseGlove Recent Development
11.14 HaptX
11.14.1 HaptX Company Details
11.14.2 HaptX Business Overview
11.14.3 HaptX Multidimensional Force Perception Solution Introduction
11.14.4 HaptX Revenue in Multidimensional Force Perception Solution Business (2020-2025)
11.14.5 HaptX Recent Development
11.15 Tanvas
11.15.1 Tanvas Company Details
11.15.2 Tanvas Business Overview
11.15.3 Tanvas Multidimensional Force Perception Solution Introduction
11.15.4 Tanvas Revenue in Multidimensional Force Perception Solution Business (2020-2025)
11.15.5 Tanvas Recent Development
11.16 bHaptics
11.16.1 bHaptics Company Details
11.16.2 bHaptics Business Overview
11.16.3 bHaptics Multidimensional Force Perception Solution Introduction
11.16.4 bHaptics Revenue in Multidimensional Force Perception Solution Business (2020-2025)
11.16.5 bHaptics Recent Development
12 Analyst's Viewpoints/Conclusions
13 Appendix
13.1 Research Methodology
13.1.1 Methodology/Research Approach
13.1.1.1 Research Programs/Design
13.1.1.2 Market Size Estimation
13.1.1.3 Market Breakdown and Data Triangulation
13.1.2 Data Source
13.1.2.1 Secondary Sources
13.1.2.2 Primary Sources
13.2 Author Details
13.3 Disclaimer
List of Tables
 Table 1. Global Multidimensional Force Perception Solution Market Size Growth Rate by Type (US$ Million): 2020 VS 2024 VS 2031
 Table 2. Key Players of Single-Axis Force Sensing Solution
 Table 3. Key Players of Multi-Axis Force Sensing Solution
 Table 4. Global Multidimensional Force Perception Solution Market Size Growth Rate by Sensing Principle (US$ Million): 2020 VS 2024 VS 2031
 Table 5. Key Players of Strain Gauge Force Sensing Solutions
 Table 6. Key Players of Piezoelectric Force Sensing Solutions
 Table 7. Key Players of Optical Force Sensing Solutions
 Table 8. Global Multidimensional Force Perception Solution Market Size Growth Rate by System Level (US$ Million): 2020 VS 2024 VS 2031
 Table 9. Key Players of Sensor-Level Solutions
 Table 10. Key Players of System-Level Solutions
 Table 11. Key Players of Platform-Level Solutions
 Table 12. Global Multidimensional Force Perception Solution Market Size Growth by Application (US$ Million): 2020 VS 2024 VS 2031
 Table 13. Global Multidimensional Force Perception Solution Market Size by Region (US$ Million): 2020 VS 2024 VS 2031
 Table 14. Global Multidimensional Force Perception Solution Market Size by Region (2020-2025) & (US$ Million)
 Table 15. Global Multidimensional Force Perception Solution Market Share by Region (2020-2025)
 Table 16. Global Multidimensional Force Perception Solution Forecasted Market Size by Region (2026-2031) & (US$ Million)
 Table 17. Global Multidimensional Force Perception Solution Market Share by Region (2026-2031)
 Table 18. Multidimensional Force Perception Solution Market Trends
 Table 19. Multidimensional Force Perception Solution Market Drivers
 Table 20. Multidimensional Force Perception Solution Market Challenges
 Table 21. Multidimensional Force Perception Solution Market Restraints
 Table 22. Global Multidimensional Force Perception Solution Revenue by Players (2020-2025) & (US$ Million)
 Table 23. Global Multidimensional Force Perception Solution Market Share by Players (2020-2025)
 Table 24. Global Top Multidimensional Force Perception Solution Players by Company Type (Tier 1, Tier 2, and Tier 3) & (based on the Revenue in Multidimensional Force Perception Solution as of 2024)
 Table 25. Ranking of Global Top Multidimensional Force Perception Solution Companies by Revenue (US$ Million) in 2024
 Table 26. Global 5 Largest Players Market Share by Multidimensional Force Perception Solution Revenue (CR5 and HHI) & (2020-2025)
 Table 27. Global Key Players of Multidimensional Force Perception Solution, Headquarters and Area Served
 Table 28. Global Key Players of Multidimensional Force Perception Solution, Product and Application
 Table 29. Global Key Players of Multidimensional Force Perception Solution, Date of Enter into This Industry
 Table 30. Mergers & Acquisitions, Expansion Plans
 Table 31. Global Multidimensional Force Perception Solution Market Size by Type (2020-2025) & (US$ Million)
 Table 32. Global Multidimensional Force Perception Solution Revenue Market Share by Type (2020-2025)
 Table 33. Global Multidimensional Force Perception Solution Forecasted Market Size by Type (2026-2031) & (US$ Million)
 Table 34. Global Multidimensional Force Perception Solution Revenue Market Share by Type (2026-2031)
 Table 35. Global Multidimensional Force Perception Solution Market Size by Application (2020-2025) & (US$ Million)
 Table 36. Global Multidimensional Force Perception Solution Revenue Market Share by Application (2020-2025)
 Table 37. Global Multidimensional Force Perception Solution Forecasted Market Size by Application (2026-2031) & (US$ Million)
 Table 38. Global Multidimensional Force Perception Solution Revenue Market Share by Application (2026-2031)
 Table 39. North America Multidimensional Force Perception Solution Market Size Growth Rate by Country (US$ Million): 2020 VS 2024 VS 2031
 Table 40. North America Multidimensional Force Perception Solution Market Size by Country (2020-2025) & (US$ Million)
 Table 41. North America Multidimensional Force Perception Solution Market Size by Country (2026-2031) & (US$ Million)
 Table 42. Europe Multidimensional Force Perception Solution Market Size Growth Rate by Country (US$ Million): 2020 VS 2024 VS 2031
 Table 43. Europe Multidimensional Force Perception Solution Market Size by Country (2020-2025) & (US$ Million)
 Table 44. Europe Multidimensional Force Perception Solution Market Size by Country (2026-2031) & (US$ Million)
 Table 45. Asia-Pacific Multidimensional Force Perception Solution Market Size Growth Rate by Region (US$ Million): 2020 VS 2024 VS 2031
 Table 46. Asia-Pacific Multidimensional Force Perception Solution Market Size by Region (2020-2025) & (US$ Million)
 Table 47. Asia-Pacific Multidimensional Force Perception Solution Market Size by Region (2026-2031) & (US$ Million)
 Table 48. Latin America Multidimensional Force Perception Solution Market Size Growth Rate by Country (US$ Million): 2020 VS 2024 VS 2031
 Table 49. Latin America Multidimensional Force Perception Solution Market Size by Country (2020-2025) & (US$ Million)
 Table 50. Latin America Multidimensional Force Perception Solution Market Size by Country (2026-2031) & (US$ Million)
 Table 51. Middle East & Africa Multidimensional Force Perception Solution Market Size Growth Rate by Country (US$ Million): 2020 VS 2024 VS 2031
 Table 52. Middle East & Africa Multidimensional Force Perception Solution Market Size by Country (2020-2025) & (US$ Million)
 Table 53. Middle East & Africa Multidimensional Force Perception Solution Market Size by Country (2026-2031) & (US$ Million)
 Table 54. Tekscan Company Details
 Table 55. Tekscan Business Overview
 Table 56. Tekscan Multidimensional Force Perception Solution Product
 Table 57. Tekscan Revenue in Multidimensional Force Perception Solution Business (2020-2025) & (US$ Million)
 Table 58. Tekscan Recent Development
 Table 59. SynTouch Company Details
 Table 60. SynTouch Business Overview
 Table 61. SynTouch Multidimensional Force Perception Solution Product
 Table 62. SynTouch Revenue in Multidimensional Force Perception Solution Business (2020-2025) & (US$ Million)
 Table 63. SynTouch Recent Development
 Table 64. ATI Industrial Automation Company Details
 Table 65. ATI Industrial Automation Business Overview
 Table 66. ATI Industrial Automation Multidimensional Force Perception Solution Product
 Table 67. ATI Industrial Automation Revenue in Multidimensional Force Perception Solution Business (2020-2025) & (US$ Million)
 Table 68. ATI Industrial Automation Recent Development
 Table 69. Robotiq Company Details
 Table 70. Robotiq Business Overview
 Table 71. Robotiq Multidimensional Force Perception Solution Product
 Table 72. Robotiq Revenue in Multidimensional Force Perception Solution Business (2020-2025) & (US$ Million)
 Table 73. Robotiq Recent Development
 Table 74. OnRobot Company Details
 Table 75. OnRobot Business Overview
 Table 76. OnRobot Multidimensional Force Perception Solution Product
 Table 77. OnRobot Revenue in Multidimensional Force Perception Solution Business (2020-2025) & (US$ Million)
 Table 78. OnRobot Recent Development
 Table 79. Schunk Company Details
 Table 80. Schunk Business Overview
 Table 81. Schunk Multidimensional Force Perception Solution Product
 Table 82. Schunk Revenue in Multidimensional Force Perception Solution Business (2020-2025) & (US$ Million)
 Table 83. Schunk Recent Development
 Table 84. Pressure Profile Systems Company Details
 Table 85. Pressure Profile Systems Business Overview
 Table 86. Pressure Profile Systems Multidimensional Force Perception Solution Product
 Table 87. Pressure Profile Systems Revenue in Multidimensional Force Perception Solution Business (2020-2025) & (US$ Million)
 Table 88. Pressure Profile Systems Recent Development
 Table 89. XELA Robotics Company Details
 Table 90. XELA Robotics Business Overview
 Table 91. XELA Robotics Multidimensional Force Perception Solution Product
 Table 92. XELA Robotics Revenue in Multidimensional Force Perception Solution Business (2020-2025) & (US$ Million)
 Table 93. XELA Robotics Recent Development
 Table 94. GelSight Company Details
 Table 95. GelSight Business Overview
 Table 96. GelSight Multidimensional Force Perception Solution Product
 Table 97. GelSight Revenue in Multidimensional Force Perception Solution Business (2020-2025) & (US$ Million)
 Table 98. GelSight Recent Development
 Table 99. OptoForce Company Details
 Table 100. OptoForce Business Overview
 Table 101. OptoForce Multidimensional Force Perception Solution Product
 Table 102. OptoForce Revenue in Multidimensional Force Perception Solution Business (2020-2025) & (US$ Million)
 Table 103. OptoForce Recent Development
 Table 104. Peratech Company Details
 Table 105. Peratech Business Overview
 Table 106. Peratech Multidimensional Force Perception Solution Product
 Table 107. Peratech Revenue in Multidimensional Force Perception Solution Business (2020-2025) & (US$ Million)
 Table 108. Peratech Recent Development
 Table 109. Force Dimension Company Details
 Table 110. Force Dimension Business Overview
 Table 111. Force Dimension Multidimensional Force Perception Solution Product
 Table 112. Force Dimension Revenue in Multidimensional Force Perception Solution Business (2020-2025) & (US$ Million)
 Table 113. Force Dimension Recent Development
 Table 114. SenseGlove Company Details
 Table 115. SenseGlove Business Overview
 Table 116. SenseGlove Multidimensional Force Perception Solution Product
 Table 117. SenseGlove Revenue in Multidimensional Force Perception Solution Business (2020-2025) & (US$ Million)
 Table 118. SenseGlove Recent Development
 Table 119. HaptX Company Details
 Table 120. HaptX Business Overview
 Table 121. HaptX Multidimensional Force Perception Solution Product
 Table 122. HaptX Revenue in Multidimensional Force Perception Solution Business (2020-2025) & (US$ Million)
 Table 123. HaptX Recent Development
 Table 124. Tanvas Company Details
 Table 125. Tanvas Business Overview
 Table 126. Tanvas Multidimensional Force Perception Solution Product
 Table 127. Tanvas Revenue in Multidimensional Force Perception Solution Business (2020-2025) & (US$ Million)
 Table 128. Tanvas Recent Development
 Table 129. bHaptics Company Details
 Table 130. bHaptics Business Overview
 Table 131. bHaptics Multidimensional Force Perception Solution Product
 Table 132. bHaptics Revenue in Multidimensional Force Perception Solution Business (2020-2025) & (US$ Million)
 Table 133. bHaptics Recent Development
 Table 134. Research Programs/Design for This Report
 Table 135. Key Data Information from Secondary Sources
 Table 136. Key Data Information from Primary Sources
 Table 137. Authors List of This Report


List of Figures
 Figure 1. Multidimensional Force Perception Solution Picture
 Figure 2. Global Multidimensional Force Perception Solution Market Size Comparison by Type (2020-2031) & (US$ Million)
 Figure 3. Global Multidimensional Force Perception Solution Market Share by Type: 2024 VS 2031
 Figure 4. Single-Axis Force Sensing Solution Features
 Figure 5. Multi-Axis Force Sensing Solution Features
 Figure 6. Global Multidimensional Force Perception Solution Market Size Comparison by Sensing Principle (2020-2031) & (US$ Million)
 Figure 7. Strain Gauge Force Sensing Solutions Features
 Figure 8. Piezoelectric Force Sensing Solutions Features
 Figure 9. Optical Force Sensing Solutions Features
 Figure 10. Global Multidimensional Force Perception Solution Market Size Comparison by System Level (2020-2031) & (US$ Million)
 Figure 11. Sensor-Level Solutions Features
 Figure 12. System-Level Solutions Features
 Figure 13. Platform-Level Solutions Features
 Figure 14. Global Multidimensional Force Perception Solution Market Size by Application (2020-2031) & (US$ Million)
 Figure 15. Global Multidimensional Force Perception Solution Market Share by Application: 2024 VS 2031
 Figure 16. Intelligent Manufacturing Case Studies
 Figure 17. Medical Industry Case Studies
 Figure 18. Automotive Electronics Case Studies
 Figure 19. Scientific Research and Education Case Studies
 Figure 20. Multidimensional Force Perception Solution Report Years Considered
 Figure 21. Global Multidimensional Force Perception Solution Market Size (US$ Million), Year-over-Year: 2020-2031
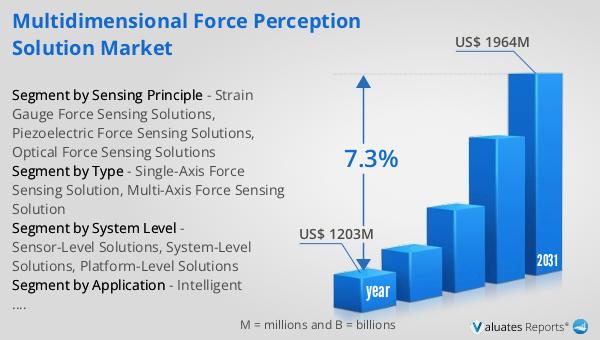
 Figure 22. Global Multidimensional Force Perception Solution Market Size, (US$ Million), 2020 VS 2024 VS 2031
 Figure 23. Global Multidimensional Force Perception Solution Market Share by Region: 2024 VS 2031
 Figure 24. Global Multidimensional Force Perception Solution Market Share by Players in 2024
 Figure 25. Global Multidimensional Force Perception Solution Market Share by Company Type (Tier 1, Tier 2, and Tier 3)
 Figure 26. The Top 10 and 5 Players Market Share by Multidimensional Force Perception Solution Revenue in 2024
 Figure 27. North America Multidimensional Force Perception Solution Market Size YoY Growth (2020-2031) & (US$ Million)
 Figure 28. North America Multidimensional Force Perception Solution Market Share by Country (2020-2031)
 Figure 29. United States Multidimensional Force Perception Solution Market Size YoY Growth (2020-2031) & (US$ Million)
 Figure 30. Canada Multidimensional Force Perception Solution Market Size YoY Growth (2020-2031) & (US$ Million)
 Figure 31. Europe Multidimensional Force Perception Solution Market Size YoY Growth (2020-2031) & (US$ Million)
 Figure 32. Europe Multidimensional Force Perception Solution Market Share by Country (2020-2031)
 Figure 33. Germany Multidimensional Force Perception Solution Market Size YoY Growth (2020-2031) & (US$ Million)
 Figure 34. France Multidimensional Force Perception Solution Market Size YoY Growth (2020-2031) & (US$ Million)
 Figure 35. U.K. Multidimensional Force Perception Solution Market Size YoY Growth (2020-2031) & (US$ Million)
 Figure 36. Italy Multidimensional Force Perception Solution Market Size YoY Growth (2020-2031) & (US$ Million)
 Figure 37. Russia Multidimensional Force Perception Solution Market Size YoY Growth (2020-2031) & (US$ Million)
 Figure 38. Ireland Multidimensional Force Perception Solution Market Size YoY Growth (2020-2031) & (US$ Million)
 Figure 39. Asia-Pacific Multidimensional Force Perception Solution Market Size YoY Growth (2020-2031) & (US$ Million)
 Figure 40. Asia-Pacific Multidimensional Force Perception Solution Market Share by Region (2020-2031)
 Figure 41. China Multidimensional Force Perception Solution Market Size YoY Growth (2020-2031) & (US$ Million)
 Figure 42. Japan Multidimensional Force Perception Solution Market Size YoY Growth (2020-2031) & (US$ Million)
 Figure 43. South Korea Multidimensional Force Perception Solution Market Size YoY Growth (2020-2031) & (US$ Million)
 Figure 44. Southeast Asia Multidimensional Force Perception Solution Market Size YoY Growth (2020-2031) & (US$ Million)
 Figure 45. India Multidimensional Force Perception Solution Market Size YoY Growth (2020-2031) & (US$ Million)
 Figure 46. Australia & New Zealand Multidimensional Force Perception Solution Market Size YoY Growth (2020-2031) & (US$ Million)
 Figure 47. Latin America Multidimensional Force Perception Solution Market Size YoY Growth (2020-2031) & (US$ Million)
 Figure 48. Latin America Multidimensional Force Perception Solution Market Share by Country (2020-2031)
 Figure 49. Mexico Multidimensional Force Perception Solution Market Size YoY Growth (2020-2031) & (US$ Million)
 Figure 50. Brazil Multidimensional Force Perception Solution Market Size YoY Growth (2020-2031) & (US$ Million)
 Figure 51. Middle East & Africa Multidimensional Force Perception Solution Market Size YoY Growth (2020-2031) & (US$ Million)
 Figure 52. Middle East & Africa Multidimensional Force Perception Solution Market Share by Country (2020-2031)
 Figure 53. Israel Multidimensional Force Perception Solution Market Size YoY Growth (2020-2031) & (US$ Million)
 Figure 54. Saudi Arabia Multidimensional Force Perception Solution Market Size YoY Growth (2020-2031) & (US$ Million)
 Figure 55. UAE Multidimensional Force Perception Solution Market Size YoY Growth (2020-2031) & (US$ Million)
 Figure 56. Tekscan Revenue Growth Rate in Multidimensional Force Perception Solution Business (2020-2025)
 Figure 57. SynTouch Revenue Growth Rate in Multidimensional Force Perception Solution Business (2020-2025)
 Figure 58. ATI Industrial Automation Revenue Growth Rate in Multidimensional Force Perception Solution Business (2020-2025)
 Figure 59. Robotiq Revenue Growth Rate in Multidimensional Force Perception Solution Business (2020-2025)
 Figure 60. OnRobot Revenue Growth Rate in Multidimensional Force Perception Solution Business (2020-2025)
 Figure 61. Schunk Revenue Growth Rate in Multidimensional Force Perception Solution Business (2020-2025)
 Figure 62. Pressure Profile Systems Revenue Growth Rate in Multidimensional Force Perception Solution Business (2020-2025)
 Figure 63. XELA Robotics Revenue Growth Rate in Multidimensional Force Perception Solution Business (2020-2025)
 Figure 64. GelSight Revenue Growth Rate in Multidimensional Force Perception Solution Business (2020-2025)
 Figure 65. OptoForce Revenue Growth Rate in Multidimensional Force Perception Solution Business (2020-2025)
 Figure 66. Peratech Revenue Growth Rate in Multidimensional Force Perception Solution Business (2020-2025)
 Figure 67. Force Dimension Revenue Growth Rate in Multidimensional Force Perception Solution Business (2020-2025)
 Figure 68. SenseGlove Revenue Growth Rate in Multidimensional Force Perception Solution Business (2020-2025)
 Figure 69. HaptX Revenue Growth Rate in Multidimensional Force Perception Solution Business (2020-2025)
 Figure 70. Tanvas Revenue Growth Rate in Multidimensional Force Perception Solution Business (2020-2025)
 Figure 71. bHaptics Revenue Growth Rate in Multidimensional Force Perception Solution Business (2020-2025)
 Figure 72. Bottom-up and Top-down Approaches for This Report
 Figure 73. Data Triangulation
 Figure 74. Key Executives Interviewed
SELECT A FORMAT
Added to Cart
Electronic (PDF)

$2900

This license allows only one user to access the PDF.
Electronic (PDF)

$4350

This license allows 1 - 5 user to access the PDF, license is suitable for small groups of 5 users working together
Electronic (PDF)

$5800

This license allows users/teams in a same Enterprise to use this report, various departments within an enterpise can use this report
Add to Cart
Buy Now (15% Discount)

OUR CUSTOMER

Bioinformatics Barcelona

SIMILAR REPORTS


RELATED REPORTS

Global In-service Inspection Services for Nuclear Facilities Market Research Report 2025

120 Pages
Type: Report
Code: QYRE-Auto-33X20008
Wed Dec 03 00:00:00 UTC 2025

Add to Cart

Global Industrial CT Inspection Services Market Research Report 2025

120 Pages
Type: Report
Code: QYRE-Auto-14Q20225
Wed Dec 03 00:00:00 UTC 2025

Add to Cart

Global Governance Risk and Compliance (GRC) Services Market Research Report 2025

120 Pages
Type: Report
Code: QYRE-Auto-35F19947
Wed Dec 03 00:00:00 UTC 2025

Add to Cart

Global On-site Installation and Commissioning Services Market Research Report 2025

120 Pages
Type: Report
Code: QYRE-Auto-2E20270
Wed Dec 03 00:00:00 UTC 2025

Add to Cart