List of Tables
Table 1. Global Nuclear Industry Additive Manufacturing Services Market Size Growth Rate by Type (US$ Million): 2020 VS 2024 VS 2031
Table 2. Key Players of Powder Bed Melting Technology
Table 3. Key Players of Directed Energy Deposition Technology
Table 4. Global Nuclear Industry Additive Manufacturing Services Market Size Growth Rate by Material (US$ Million): 2020 VS 2024 VS 2031
Table 5. Key Players of Austenitic Stainless Steels
Table 6. Key Players of Nickel-Based Superalloys
Table 7. Key Players of Zirconium Alloys
Table 8. Key Players of Others
Table 9. Global Nuclear Industry Additive Manufacturing Services Market Size Growth Rate by Safety (US$ Million): 2020 VS 2024 VS 2031
Table 10. Key Players of Nuclear Safety Grade
Table 11. Key Players of Non-nuclear Safety Grade
Table 12. Global Nuclear Industry Additive Manufacturing Services Market Size Growth by Application (US$ Million): 2020 VS 2024 VS 2031
Table 13. Global Nuclear Industry Additive Manufacturing Services Market Size by Region (US$ Million): 2020 VS 2024 VS 2031
Table 14. Global Nuclear Industry Additive Manufacturing Services Market Size by Region (2020-2025) & (US$ Million)
Table 15. Global Nuclear Industry Additive Manufacturing Services Market Share by Region (2020-2025)
Table 16. Global Nuclear Industry Additive Manufacturing Services Forecasted Market Size by Region (2026-2031) & (US$ Million)
Table 17. Global Nuclear Industry Additive Manufacturing Services Market Share by Region (2026-2031)
Table 18. Nuclear Industry Additive Manufacturing Services Market Trends
Table 19. Nuclear Industry Additive Manufacturing Services Market Drivers
Table 20. Nuclear Industry Additive Manufacturing Services Market Challenges
Table 21. Nuclear Industry Additive Manufacturing Services Market Restraints
Table 22. Global Nuclear Industry Additive Manufacturing Services Revenue by Players (2020-2025) & (US$ Million)
Table 23. Global Nuclear Industry Additive Manufacturing Services Market Share by Players (2020-2025)
Table 24. Global Top Nuclear Industry Additive Manufacturing Services Players by Company Type (Tier 1, Tier 2, and Tier 3) & (based on the Revenue in Nuclear Industry Additive Manufacturing Services as of 2024)
Table 25. Ranking of Global Top Nuclear Industry Additive Manufacturing Services Companies by Revenue (US$ Million) in 2024
Table 26. Global 5 Largest Players Market Share by Nuclear Industry Additive Manufacturing Services Revenue (CR5 and HHI) & (2020-2025)
Table 27. Global Key Players of Nuclear Industry Additive Manufacturing Services, Headquarters and Area Served
Table 28. Global Key Players of Nuclear Industry Additive Manufacturing Services, Product and Application
Table 29. Global Key Players of Nuclear Industry Additive Manufacturing Services, Date of Enter into This Industry
Table 30. Mergers & Acquisitions, Expansion Plans
Table 31. Global Nuclear Industry Additive Manufacturing Services Market Size by Type (2020-2025) & (US$ Million)
Table 32. Global Nuclear Industry Additive Manufacturing Services Revenue Market Share by Type (2020-2025)
Table 33. Global Nuclear Industry Additive Manufacturing Services Forecasted Market Size by Type (2026-2031) & (US$ Million)
Table 34. Global Nuclear Industry Additive Manufacturing Services Revenue Market Share by Type (2026-2031)
Table 35. Global Nuclear Industry Additive Manufacturing Services Market Size by Application (2020-2025) & (US$ Million)
Table 36. Global Nuclear Industry Additive Manufacturing Services Revenue Market Share by Application (2020-2025)
Table 37. Global Nuclear Industry Additive Manufacturing Services Forecasted Market Size by Application (2026-2031) & (US$ Million)
Table 38. Global Nuclear Industry Additive Manufacturing Services Revenue Market Share by Application (2026-2031)
Table 39. North America Nuclear Industry Additive Manufacturing Services Market Size Growth Rate by Country (US$ Million): 2020 VS 2024 VS 2031
Table 40. North America Nuclear Industry Additive Manufacturing Services Market Size by Country (2020-2025) & (US$ Million)
Table 41. North America Nuclear Industry Additive Manufacturing Services Market Size by Country (2026-2031) & (US$ Million)
Table 42. Europe Nuclear Industry Additive Manufacturing Services Market Size Growth Rate by Country (US$ Million): 2020 VS 2024 VS 2031
Table 43. Europe Nuclear Industry Additive Manufacturing Services Market Size by Country (2020-2025) & (US$ Million)
Table 44. Europe Nuclear Industry Additive Manufacturing Services Market Size by Country (2026-2031) & (US$ Million)
Table 45. Asia-Pacific Nuclear Industry Additive Manufacturing Services Market Size Growth Rate by Region (US$ Million): 2020 VS 2024 VS 2031
Table 46. Asia-Pacific Nuclear Industry Additive Manufacturing Services Market Size by Region (2020-2025) & (US$ Million)
Table 47. Asia-Pacific Nuclear Industry Additive Manufacturing Services Market Size by Region (2026-2031) & (US$ Million)
Table 48. Latin America Nuclear Industry Additive Manufacturing Services Market Size Growth Rate by Country (US$ Million): 2020 VS 2024 VS 2031
Table 49. Latin America Nuclear Industry Additive Manufacturing Services Market Size by Country (2020-2025) & (US$ Million)
Table 50. Latin America Nuclear Industry Additive Manufacturing Services Market Size by Country (2026-2031) & (US$ Million)
Table 51. Middle East & Africa Nuclear Industry Additive Manufacturing Services Market Size Growth Rate by Country (US$ Million): 2020 VS 2024 VS 2031
Table 52. Middle East & Africa Nuclear Industry Additive Manufacturing Services Market Size by Country (2020-2025) & (US$ Million)
Table 53. Middle East & Africa Nuclear Industry Additive Manufacturing Services Market Size by Country (2026-2031) & (US$ Million)
Table 54. BASSETTI Group Company Details
Table 55. BASSETTI Group Business Overview
Table 56. BASSETTI Group Nuclear Industry Additive Manufacturing Services Product
Table 57. BASSETTI Group Revenue in Nuclear Industry Additive Manufacturing Services Business (2020-2025) & (US$ Million)
Table 58. BASSETTI Group Recent Development
Table 59. BWX Technologies Company Details
Table 60. BWX Technologies Business Overview
Table 61. BWX Technologies Nuclear Industry Additive Manufacturing Services Product
Table 62. BWX Technologies Revenue in Nuclear Industry Additive Manufacturing Services Business (2020-2025) & (US$ Million)
Table 63. BWX Technologies Recent Development
Table 64. Concurrent Technologies Corporation Company Details
Table 65. Concurrent Technologies Corporation Business Overview
Table 66. Concurrent Technologies Corporation Nuclear Industry Additive Manufacturing Services Product
Table 67. Concurrent Technologies Corporation Revenue in Nuclear Industry Additive Manufacturing Services Business (2020-2025) & (US$ Million)
Table 68. Concurrent Technologies Corporation Recent Development
Table 69. E3i Group Company Details
Table 70. E3i Group Business Overview
Table 71. E3i Group Nuclear Industry Additive Manufacturing Services Product
Table 72. E3i Group Revenue in Nuclear Industry Additive Manufacturing Services Business (2020-2025) & (US$ Million)
Table 73. E3i Group Recent Development
Table 74. Framatome Company Details
Table 75. Framatome Business Overview
Table 76. Framatome Nuclear Industry Additive Manufacturing Services Product
Table 77. Framatome Revenue in Nuclear Industry Additive Manufacturing Services Business (2020-2025) & (US$ Million)
Table 78. Framatome Recent Development
Table 79. Kinectrics Company Details
Table 80. Kinectrics Business Overview
Table 81. Kinectrics Nuclear Industry Additive Manufacturing Services Product
Table 82. Kinectrics Revenue in Nuclear Industry Additive Manufacturing Services Business (2020-2025) & (US$ Million)
Table 83. Kinectrics Recent Development
Table 84. Lincoln Electric Company Details
Table 85. Lincoln Electric Business Overview
Table 86. Lincoln Electric Nuclear Industry Additive Manufacturing Services Product
Table 87. Lincoln Electric Revenue in Nuclear Industry Additive Manufacturing Services Business (2020-2025) & (US$ Million)
Table 88. Lincoln Electric Recent Development
Table 89. Lucideon Company Details
Table 90. Lucideon Business Overview
Table 91. Lucideon Nuclear Industry Additive Manufacturing Services Product
Table 92. Lucideon Revenue in Nuclear Industry Additive Manufacturing Services Business (2020-2025) & (US$ Million)
Table 93. Lucideon Recent Development
Table 94. MX3D Company Details
Table 95. MX3D Business Overview
Table 96. MX3D Nuclear Industry Additive Manufacturing Services Product
Table 97. MX3D Revenue in Nuclear Industry Additive Manufacturing Services Business (2020-2025) & (US$ Million)
Table 98. MX3D Recent Development
Table 99. NANO Nuclear Company Details
Table 100. NANO Nuclear Business Overview
Table 101. NANO Nuclear Nuclear Industry Additive Manufacturing Services Product
Table 102. NANO Nuclear Revenue in Nuclear Industry Additive Manufacturing Services Business (2020-2025) & (US$ Million)
Table 103. NANO Nuclear Recent Development
Table 104. Nikon SLM Solutions Company Details
Table 105. Nikon SLM Solutions Business Overview
Table 106. Nikon SLM Solutions Nuclear Industry Additive Manufacturing Services Product
Table 107. Nikon SLM Solutions Revenue in Nuclear Industry Additive Manufacturing Services Business (2020-2025) & (US$ Million)
Table 108. Nikon SLM Solutions Recent Development
Table 109. Rosatom Company Details
Table 110. Rosatom Business Overview
Table 111. Rosatom Nuclear Industry Additive Manufacturing Services Product
Table 112. Rosatom Revenue in Nuclear Industry Additive Manufacturing Services Business (2020-2025) & (US$ Million)
Table 113. Rosatom Recent Development
Table 114. Saturne Technology Company Details
Table 115. Saturne Technology Business Overview
Table 116. Saturne Technology Nuclear Industry Additive Manufacturing Services Product
Table 117. Saturne Technology Revenue in Nuclear Industry Additive Manufacturing Services Business (2020-2025) & (US$ Million)
Table 118. Saturne Technology Recent Development
Table 119. VTT Company Details
Table 120. VTT Business Overview
Table 121. VTT Nuclear Industry Additive Manufacturing Services Product
Table 122. VTT Revenue in Nuclear Industry Additive Manufacturing Services Business (2020-2025) & (US$ Million)
Table 123. VTT Recent Development
Table 124. Westinghouse Nuclear Company Details
Table 125. Westinghouse Nuclear Business Overview
Table 126. Westinghouse Nuclear Nuclear Industry Additive Manufacturing Services Product
Table 127. Westinghouse Nuclear Revenue in Nuclear Industry Additive Manufacturing Services Business (2020-2025) & (US$ Million)
Table 128. Westinghouse Nuclear Recent Development
Table 129. Research Programs/Design for This Report
Table 130. Key Data Information from Secondary Sources
Table 131. Key Data Information from Primary Sources
Table 132. Authors List of This Report
List of Figures
Figure 1. Nuclear Industry Additive Manufacturing Services Picture
Figure 2. Global Nuclear Industry Additive Manufacturing Services Market Size Comparison by Type (2020-2031) & (US$ Million)
Figure 3. Global Nuclear Industry Additive Manufacturing Services Market Share by Type: 2024 VS 2031
Figure 4. Powder Bed Melting Technology Features
Figure 5. Directed Energy Deposition Technology Features
Figure 6. Global Nuclear Industry Additive Manufacturing Services Market Size Comparison by Material (2020-2031) & (US$ Million)
Figure 7. Austenitic Stainless Steels Features
Figure 8. Nickel-Based Superalloys Features
Figure 9. Zirconium Alloys Features
Figure 10. Others Features
Figure 11. Global Nuclear Industry Additive Manufacturing Services Market Size Comparison by Safety (2020-2031) & (US$ Million)
Figure 12. Nuclear Safety Grade Features
Figure 13. Non-nuclear Safety Grade Features
Figure 14. Global Nuclear Industry Additive Manufacturing Services Market Size by Application (2020-2031) & (US$ Million)
Figure 15. Global Nuclear Industry Additive Manufacturing Services Market Share by Application: 2024 VS 2031
Figure 16. Research and Development and Prototyping Case Studies
Figure 17. In-Service Equipment Repair and Replacement Case Studies
Figure 18. Direct Manufacturing of New Equipment Case Studies
Figure 19. Nuclear Industry Additive Manufacturing Services Report Years Considered
Figure 20. Global Nuclear Industry Additive Manufacturing Services Market Size (US$ Million), Year-over-Year: 2020-2031
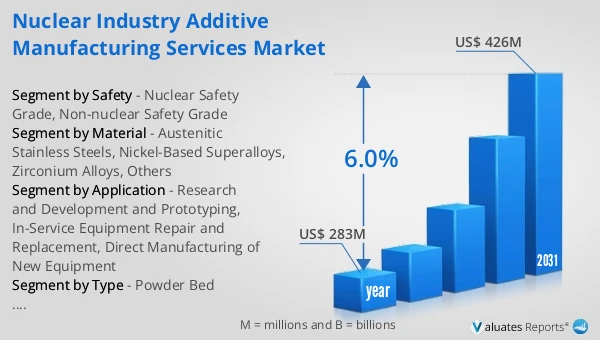
Figure 21. Global Nuclear Industry Additive Manufacturing Services Market Size, (US$ Million), 2020 VS 2024 VS 2031
Figure 22. Global Nuclear Industry Additive Manufacturing Services Market Share by Region: 2024 VS 2031
Figure 23. Global Nuclear Industry Additive Manufacturing Services Market Share by Players in 2024
Figure 24. Global Nuclear Industry Additive Manufacturing Services Market Share by Company Type (Tier 1, Tier 2, and Tier 3)
Figure 25. The Top 10 and 5 Players Market Share by Nuclear Industry Additive Manufacturing Services Revenue in 2024
Figure 26. North America Nuclear Industry Additive Manufacturing Services Market Size YoY Growth (2020-2031) & (US$ Million)
Figure 27. North America Nuclear Industry Additive Manufacturing Services Market Share by Country (2020-2031)
Figure 28. United States Nuclear Industry Additive Manufacturing Services Market Size YoY Growth (2020-2031) & (US$ Million)
Figure 29. Canada Nuclear Industry Additive Manufacturing Services Market Size YoY Growth (2020-2031) & (US$ Million)
Figure 30. Europe Nuclear Industry Additive Manufacturing Services Market Size YoY Growth (2020-2031) & (US$ Million)
Figure 31. Europe Nuclear Industry Additive Manufacturing Services Market Share by Country (2020-2031)
Figure 32. Germany Nuclear Industry Additive Manufacturing Services Market Size YoY Growth (2020-2031) & (US$ Million)
Figure 33. France Nuclear Industry Additive Manufacturing Services Market Size YoY Growth (2020-2031) & (US$ Million)
Figure 34. U.K. Nuclear Industry Additive Manufacturing Services Market Size YoY Growth (2020-2031) & (US$ Million)
Figure 35. Italy Nuclear Industry Additive Manufacturing Services Market Size YoY Growth (2020-2031) & (US$ Million)
Figure 36. Russia Nuclear Industry Additive Manufacturing Services Market Size YoY Growth (2020-2031) & (US$ Million)
Figure 37. Ireland Nuclear Industry Additive Manufacturing Services Market Size YoY Growth (2020-2031) & (US$ Million)
Figure 38. Asia-Pacific Nuclear Industry Additive Manufacturing Services Market Size YoY Growth (2020-2031) & (US$ Million)
Figure 39. Asia-Pacific Nuclear Industry Additive Manufacturing Services Market Share by Region (2020-2031)
Figure 40. China Nuclear Industry Additive Manufacturing Services Market Size YoY Growth (2020-2031) & (US$ Million)
Figure 41. Japan Nuclear Industry Additive Manufacturing Services Market Size YoY Growth (2020-2031) & (US$ Million)
Figure 42. South Korea Nuclear Industry Additive Manufacturing Services Market Size YoY Growth (2020-2031) & (US$ Million)
Figure 43. Southeast Asia Nuclear Industry Additive Manufacturing Services Market Size YoY Growth (2020-2031) & (US$ Million)
Figure 44. India Nuclear Industry Additive Manufacturing Services Market Size YoY Growth (2020-2031) & (US$ Million)
Figure 45. Australia & New Zealand Nuclear Industry Additive Manufacturing Services Market Size YoY Growth (2020-2031) & (US$ Million)
Figure 46. Latin America Nuclear Industry Additive Manufacturing Services Market Size YoY Growth (2020-2031) & (US$ Million)
Figure 47. Latin America Nuclear Industry Additive Manufacturing Services Market Share by Country (2020-2031)
Figure 48. Mexico Nuclear Industry Additive Manufacturing Services Market Size YoY Growth (2020-2031) & (US$ Million)
Figure 49. Brazil Nuclear Industry Additive Manufacturing Services Market Size YoY Growth (2020-2031) & (US$ Million)
Figure 50. Middle East & Africa Nuclear Industry Additive Manufacturing Services Market Size YoY Growth (2020-2031) & (US$ Million)
Figure 51. Middle East & Africa Nuclear Industry Additive Manufacturing Services Market Share by Country (2020-2031)
Figure 52. Israel Nuclear Industry Additive Manufacturing Services Market Size YoY Growth (2020-2031) & (US$ Million)
Figure 53. Saudi Arabia Nuclear Industry Additive Manufacturing Services Market Size YoY Growth (2020-2031) & (US$ Million)
Figure 54. UAE Nuclear Industry Additive Manufacturing Services Market Size YoY Growth (2020-2031) & (US$ Million)
Figure 55. BASSETTI Group Revenue Growth Rate in Nuclear Industry Additive Manufacturing Services Business (2020-2025)
Figure 56. BWX Technologies Revenue Growth Rate in Nuclear Industry Additive Manufacturing Services Business (2020-2025)
Figure 57. Concurrent Technologies Corporation Revenue Growth Rate in Nuclear Industry Additive Manufacturing Services Business (2020-2025)
Figure 58. E3i Group Revenue Growth Rate in Nuclear Industry Additive Manufacturing Services Business (2020-2025)
Figure 59. Framatome Revenue Growth Rate in Nuclear Industry Additive Manufacturing Services Business (2020-2025)
Figure 60. Kinectrics Revenue Growth Rate in Nuclear Industry Additive Manufacturing Services Business (2020-2025)
Figure 61. Lincoln Electric Revenue Growth Rate in Nuclear Industry Additive Manufacturing Services Business (2020-2025)
Figure 62. Lucideon Revenue Growth Rate in Nuclear Industry Additive Manufacturing Services Business (2020-2025)
Figure 63. MX3D Revenue Growth Rate in Nuclear Industry Additive Manufacturing Services Business (2020-2025)
Figure 64. NANO Nuclear Revenue Growth Rate in Nuclear Industry Additive Manufacturing Services Business (2020-2025)
Figure 65. Nikon SLM Solutions Revenue Growth Rate in Nuclear Industry Additive Manufacturing Services Business (2020-2025)
Figure 66. Rosatom Revenue Growth Rate in Nuclear Industry Additive Manufacturing Services Business (2020-2025)
Figure 67. Saturne Technology Revenue Growth Rate in Nuclear Industry Additive Manufacturing Services Business (2020-2025)
Figure 68. VTT Revenue Growth Rate in Nuclear Industry Additive Manufacturing Services Business (2020-2025)
Figure 69. Westinghouse Nuclear Revenue Growth Rate in Nuclear Industry Additive Manufacturing Services Business (2020-2025)
Figure 70. Bottom-up and Top-down Approaches for This Report
Figure 71. Data Triangulation
Figure 72. Key Executives Interviewed