0
U.S. (TOLL FREE)
+1 (315) 215-3225
Automative

0
U.S. (TOLL FREE)
+1 (315) 215-3225
Global Hyperspectral Imaging Instrument Market Research Report 2025
Published Date: February 2025
|
Report Code: QYRE-Auto-19U12029
Home | Market Reports | Science
Global Hyperspectral Imaging Instrument Market Research Report 2022
BUY CHAPTERS

Global Hyperspectral Imaging Instrument Market Research Report 2025

Code: QYRE-Auto-19U12029
Report
February 2025
Pages:127
QYResearch
Buy Now with 15% Discount
DESCRIPTION
TABLE OF CONTENT
TABLES & FIGURES

Hyperspectral Imaging Instrument Market Size

The global market for Hyperspectral Imaging Instrument was valued at US$ 169 million in the year 2024 and is projected to reach a revised size of US$ 466 million by 2031, growing at a CAGR of 15.8% during the forecast period.

Hyperspectral Imaging Instrument Market

Hyperspectral Imaging Instrument Market

North American market for Hyperspectral Imaging Instrument is estimated to increase from $ million in 2024 to reach $ million by 2031, at a CAGR of % during the forecast period of 2025 through 2031.
Asia-Pacific market for Hyperspectral Imaging Instrument is estimated to increase from $ million in 2024 to reach $ million by 2031, at a CAGR of % during the forecast period of 2025 through 2031.
The major global manufacturers of Hyperspectral Imaging Instrument include NKT Photonics, Vortex Optical Coatings Ltd., SI Stuttgart Instruments GmbH, SIMTRUM Pte. Ltd., New Age Instruments & Materials, Tokyo Instruments, Inc., Andor Technology, Bodkin Design & Engineering, Camlin Ltd., CRAIC Technologies, Inc., etc. In 2024, the world's top three vendors accounted for approximately % of the revenue.

Report Scope

This report aims to provide a comprehensive presentation of the global market for Hyperspectral Imaging Instrument, with both quantitative and qualitative analysis, to help readers develop business/growth strategies, assess the market competitive situation, analyze their position in the current marketplace, and make informed business decisions regarding Hyperspectral Imaging Instrument.
The Hyperspectral Imaging Instrument market size, estimations, and forecasts are provided in terms of output/shipments (K Units) and revenue ($ millions), considering 2024 as the base year, with history and forecast data for the period from 2020 to 2031. This report segments the global Hyperspectral Imaging Instrument market comprehensively. Regional market sizes, concerning products by Type, by Application, and by players, are also provided.
For a more in-depth understanding of the market, the report provides profiles of the competitive landscape, key competitors, and their respective market ranks. The report also discusses technological trends and new product developments.
The report will help the Hyperspectral Imaging Instrument manufacturers, new entrants, and industry chain related companies in this market with information on the revenues, production, and average price for the overall market and the sub-segments across the different segments, by company, by Type, by Application, and by regions.
Market Segmentation

Scope of Hyperspectral Imaging Instrument Market Report

Report Metric Details
Report Name Hyperspectral Imaging Instrument Market
Accounted market size in year US$ 169 million
Forecasted market size in 2031 US$ 466 million
CAGR 15.8%
Base Year year
Forecasted years 2025 - 2031
by Type
  • Visible/Near Infrared (VNIR)
  • Short Wave Infrared (SWIR)
  • Medium Wave Infrared (MWIR)
  • Long Wave Infrared (LWIR)
  • Others
by Application
Production by Region
  • North America
  • Europe
  • China
  • Japan
Consumption by Region
  • North America (United States, Canada)
  • Europe (Germany, France, UK, Italy, Russia)
  • Asia-Pacific (China, Japan, South Korea, Taiwan)
  • Southeast Asia (India)
  • Latin America (Mexico, Brazil)
By Company NKT Photonics, Vortex Optical Coatings Ltd., SI Stuttgart Instruments GmbH, SIMTRUM Pte. Ltd., New Age Instruments & Materials, Tokyo Instruments, Inc., Andor Technology, Bodkin Design & Engineering, Camlin Ltd., CRAIC Technologies, Inc., Flash Photonics, Headwall Photonics, Hyspex, Labsphere, Inc., NIREOS, Opton Laser International, Photon etc. Inc., Pro-Lite Technology Ltd, SPECIM, Tematys, Brimrose, Zolix, Resonon, IMEC, Surface Optics, Norsk Elektro Optikk, ITRES, Telops, Corning, BaySpec
Forecast units USD million in value
Report coverage Revenue and volume forecast, company share, competitive landscape, growth factors and trends

Chapter Outline

  • Chapter 1: Introduces the report scope of the report, executive summary of different market segments (by region, by Type, by Application, etc), including the market size of each market segment, future development potential, and so on. It offers a high-level view of the current state of the market and its likely evolution in the short to mid-term, and long term.
  • Chapter 2: Detailed analysis of Hyperspectral Imaging Instrument manufacturers competitive landscape, price, production and value market share, latest development plan, merger, and acquisition information, etc.
  • Chapter 3: Production/output, value of Hyperspectral Imaging Instrument by region/country. It provides a quantitative analysis of the market size and development potential of each region in the next six years.
  • Chapter 4: Consumption of Hyperspectral Imaging Instrument in regional level and country level. It provides a quantitative analysis of the market size and development potential of each region and its main countries and introduces the market development, future development prospects, market space, and production of each country in the world.
  • Chapter 5: Provides the analysis of various market segments by Type, covering the market size and development potential of each market segment, to help readers find the blue ocean market in different market segments.
  • Chapter 6: Provides the analysis of various market segments by Application, covering the market size and development potential of each market segment, to help readers find the blue ocean market in different downstream markets.
  • Chapter 7: Provides profiles of key players, introducing the basic situation of the main companies in the market in detail, including product production/output, value, price, gross margin, product introduction, recent development, etc.
  • Chapter 8: Analysis of industrial chain, including the upstream and downstream of the industry.
  • Chapter 9: Introduces the market dynamics, latest developments of the market, the driving factors and restrictive factors of the market, the challenges and risks faced by manufacturers in the industry, and the analysis of relevant policies in the industry.
  • Chapter 10: The main points and conclusions of the report.

FAQ for this report

How fast is Hyperspectral Imaging Instrument Market growing?

Ans: The Hyperspectral Imaging Instrument Market witnessing a CAGR of 15.8% during the forecast period 2025-2031.

What is the Hyperspectral Imaging Instrument Market size in 2031?

Ans: The Hyperspectral Imaging Instrument Market size in 2031 will be US$ 466 million.

Who are the main players in the Hyperspectral Imaging Instrument Market report?

Ans: The main players in the Hyperspectral Imaging Instrument Market are NKT Photonics, Vortex Optical Coatings Ltd., SI Stuttgart Instruments GmbH, SIMTRUM Pte. Ltd., New Age Instruments & Materials, Tokyo Instruments, Inc., Andor Technology, Bodkin Design & Engineering, Camlin Ltd., CRAIC Technologies, Inc., Flash Photonics, Headwall Photonics, Hyspex, Labsphere, Inc., NIREOS, Opton Laser International, Photon etc. Inc., Pro-Lite Technology Ltd, SPECIM, Tematys, Brimrose, Zolix, Resonon, IMEC, Surface Optics, Norsk Elektro Optikk, ITRES, Telops, Corning, BaySpec

What are the Application segmentation covered in the Hyperspectral Imaging Instrument Market report?

Ans: The Applications covered in the Hyperspectral Imaging Instrument Market report are National Defense Security, Environmental Monitoring And Mineralogy, Food And Agriculture, Life Sciences And Medical Diagnosis, Vegetation And Ecological Research, Environmental Recycling Field, Others

What are the Type segmentation covered in the Hyperspectral Imaging Instrument Market report?

Ans: The Types covered in the Hyperspectral Imaging Instrument Market report are Visible/Near Infrared (VNIR), Short Wave Infrared (SWIR), Medium Wave Infrared (MWIR), Long Wave Infrared (LWIR), Others

Recommended Reports

Hyperspectral Imaging

Spectroscopy Equipment

Multispectral Imaging

1 Hyperspectral Imaging Instrument Market Overview
1.1 Product Definition
1.2 Hyperspectral Imaging Instrument by Type
1.2.1 Global Hyperspectral Imaging Instrument Market Value Growth Rate Analysis by Type: 2024 VS 2031
1.2.2 Visible/Near Infrared (VNIR)
1.2.3 Short Wave Infrared (SWIR)
1.2.4 Medium Wave Infrared (MWIR)
1.2.5 Long Wave Infrared (LWIR)
1.2.6 Others
1.3 Hyperspectral Imaging Instrument by Application
1.3.1 Global Hyperspectral Imaging Instrument Market Value Growth Rate Analysis by Application: 2024 VS 2031
1.3.2 National Defense Security
1.3.3 Environmental Monitoring And Mineralogy
1.3.4 Food And Agriculture
1.3.5 Life Sciences And Medical Diagnosis
1.3.6 Vegetation And Ecological Research
1.3.7 Environmental Recycling Field
1.3.8 Others
1.4 Global Market Growth Prospects
1.4.1 Global Hyperspectral Imaging Instrument Production Value Estimates and Forecasts (2020-2031)
1.4.2 Global Hyperspectral Imaging Instrument Production Capacity Estimates and Forecasts (2020-2031)
1.4.3 Global Hyperspectral Imaging Instrument Production Estimates and Forecasts (2020-2031)
1.4.4 Global Hyperspectral Imaging Instrument Market Average Price Estimates and Forecasts (2020-2031)
1.5 Assumptions and Limitations
2 Market Competition by Manufacturers
2.1 Global Hyperspectral Imaging Instrument Production Market Share by Manufacturers (2020-2025)
2.2 Global Hyperspectral Imaging Instrument Production Value Market Share by Manufacturers (2020-2025)
2.3 Global Key Players of Hyperspectral Imaging Instrument, Industry Ranking, 2023 VS 2024
2.4 Global Hyperspectral Imaging Instrument Market Share by Company Type (Tier 1, Tier 2, and Tier 3)
2.5 Global Hyperspectral Imaging Instrument Average Price by Manufacturers (2020-2025)
2.6 Global Key Manufacturers of Hyperspectral Imaging Instrument, Manufacturing Base Distribution and Headquarters
2.7 Global Key Manufacturers of Hyperspectral Imaging Instrument, Product Offered and Application
2.8 Global Key Manufacturers of Hyperspectral Imaging Instrument, Date of Enter into This Industry
2.9 Hyperspectral Imaging Instrument Market Competitive Situation and Trends
2.9.1 Hyperspectral Imaging Instrument Market Concentration Rate
2.9.2 Global 5 and 10 Largest Hyperspectral Imaging Instrument Players Market Share by Revenue
2.10 Mergers & Acquisitions, Expansion
3 Hyperspectral Imaging Instrument Production by Region
3.1 Global Hyperspectral Imaging Instrument Production Value Estimates and Forecasts by Region: 2020 VS 2024 VS 2031
3.2 Global Hyperspectral Imaging Instrument Production Value by Region (2020-2031)
3.2.1 Global Hyperspectral Imaging Instrument Production Value by Region (2020-2025)
3.2.2 Global Forecasted Production Value of Hyperspectral Imaging Instrument by Region (2026-2031)
3.3 Global Hyperspectral Imaging Instrument Production Estimates and Forecasts by Region: 2020 VS 2024 VS 2031
3.4 Global Hyperspectral Imaging Instrument Production Volume by Region (2020-2031)
3.4.1 Global Hyperspectral Imaging Instrument Production by Region (2020-2025)
3.4.2 Global Forecasted Production of Hyperspectral Imaging Instrument by Region (2026-2031)
3.5 Global Hyperspectral Imaging Instrument Market Price Analysis by Region (2020-2025)
3.6 Global Hyperspectral Imaging Instrument Production and Value, Year-over-Year Growth
3.6.1 North America Hyperspectral Imaging Instrument Production Value Estimates and Forecasts (2020-2031)
3.6.2 Europe Hyperspectral Imaging Instrument Production Value Estimates and Forecasts (2020-2031)
3.6.3 China Hyperspectral Imaging Instrument Production Value Estimates and Forecasts (2020-2031)
3.6.4 Japan Hyperspectral Imaging Instrument Production Value Estimates and Forecasts (2020-2031)
4 Hyperspectral Imaging Instrument Consumption by Region
4.1 Global Hyperspectral Imaging Instrument Consumption Estimates and Forecasts by Region: 2020 VS 2024 VS 2031
4.2 Global Hyperspectral Imaging Instrument Consumption by Region (2020-2031)
4.2.1 Global Hyperspectral Imaging Instrument Consumption by Region (2020-2025)
4.2.2 Global Hyperspectral Imaging Instrument Forecasted Consumption by Region (2026-2031)
4.3 North America
4.3.1 North America Hyperspectral Imaging Instrument Consumption Growth Rate by Country: 2020 VS 2024 VS 2031
4.3.2 North America Hyperspectral Imaging Instrument Consumption by Country (2020-2031)
4.3.3 U.S.
4.3.4 Canada
4.4 Europe
4.4.1 Europe Hyperspectral Imaging Instrument Consumption Growth Rate by Country: 2020 VS 2024 VS 2031
4.4.2 Europe Hyperspectral Imaging Instrument Consumption by Country (2020-2031)
4.4.3 Germany
4.4.4 France
4.4.5 U.K.
4.4.6 Italy
4.4.7 Netherlands
4.5 Asia Pacific
4.5.1 Asia Pacific Hyperspectral Imaging Instrument Consumption Growth Rate by Region: 2020 VS 2024 VS 2031
4.5.2 Asia Pacific Hyperspectral Imaging Instrument Consumption by Region (2020-2031)
4.5.3 China
4.5.4 Japan
4.5.5 South Korea
4.5.6 China Taiwan
4.5.7 Southeast Asia
4.5.8 India
4.6 Latin America, Middle East & Africa
4.6.1 Latin America, Middle East & Africa Hyperspectral Imaging Instrument Consumption Growth Rate by Country: 2020 VS 2024 VS 2031
4.6.2 Latin America, Middle East & Africa Hyperspectral Imaging Instrument Consumption by Country (2020-2031)
4.6.3 Mexico
4.6.4 Brazil
4.6.5 Turkey
4.6.6 GCC Countries
5 Segment by Type
5.1 Global Hyperspectral Imaging Instrument Production by Type (2020-2031)
5.1.1 Global Hyperspectral Imaging Instrument Production by Type (2020-2025)
5.1.2 Global Hyperspectral Imaging Instrument Production by Type (2026-2031)
5.1.3 Global Hyperspectral Imaging Instrument Production Market Share by Type (2020-2031)
5.2 Global Hyperspectral Imaging Instrument Production Value by Type (2020-2031)
5.2.1 Global Hyperspectral Imaging Instrument Production Value by Type (2020-2025)
5.2.2 Global Hyperspectral Imaging Instrument Production Value by Type (2026-2031)
5.2.3 Global Hyperspectral Imaging Instrument Production Value Market Share by Type (2020-2031)
5.3 Global Hyperspectral Imaging Instrument Price by Type (2020-2031)
6 Segment by Application
6.1 Global Hyperspectral Imaging Instrument Production by Application (2020-2031)
6.1.1 Global Hyperspectral Imaging Instrument Production by Application (2020-2025)
6.1.2 Global Hyperspectral Imaging Instrument Production by Application (2026-2031)
6.1.3 Global Hyperspectral Imaging Instrument Production Market Share by Application (2020-2031)
6.2 Global Hyperspectral Imaging Instrument Production Value by Application (2020-2031)
6.2.1 Global Hyperspectral Imaging Instrument Production Value by Application (2020-2025)
6.2.2 Global Hyperspectral Imaging Instrument Production Value by Application (2026-2031)
6.2.3 Global Hyperspectral Imaging Instrument Production Value Market Share by Application (2020-2031)
6.3 Global Hyperspectral Imaging Instrument Price by Application (2020-2031)
7 Key Companies Profiled
7.1 NKT Photonics
7.1.1 NKT Photonics Hyperspectral Imaging Instrument Company Information
7.1.2 NKT Photonics Hyperspectral Imaging Instrument Product Portfolio
7.1.3 NKT Photonics Hyperspectral Imaging Instrument Production, Value, Price and Gross Margin (2020-2025)
7.1.4 NKT Photonics Main Business and Markets Served
7.1.5 NKT Photonics Recent Developments/Updates
7.2 Vortex Optical Coatings Ltd.
7.2.1 Vortex Optical Coatings Ltd. Hyperspectral Imaging Instrument Company Information
7.2.2 Vortex Optical Coatings Ltd. Hyperspectral Imaging Instrument Product Portfolio
7.2.3 Vortex Optical Coatings Ltd. Hyperspectral Imaging Instrument Production, Value, Price and Gross Margin (2020-2025)
7.2.4 Vortex Optical Coatings Ltd. Main Business and Markets Served
7.2.5 Vortex Optical Coatings Ltd. Recent Developments/Updates
7.3 SI Stuttgart Instruments GmbH
7.3.1 SI Stuttgart Instruments GmbH Hyperspectral Imaging Instrument Company Information
7.3.2 SI Stuttgart Instruments GmbH Hyperspectral Imaging Instrument Product Portfolio
7.3.3 SI Stuttgart Instruments GmbH Hyperspectral Imaging Instrument Production, Value, Price and Gross Margin (2020-2025)
7.3.4 SI Stuttgart Instruments GmbH Main Business and Markets Served
7.3.5 SI Stuttgart Instruments GmbH Recent Developments/Updates
7.4 SIMTRUM Pte. Ltd.
7.4.1 SIMTRUM Pte. Ltd. Hyperspectral Imaging Instrument Company Information
7.4.2 SIMTRUM Pte. Ltd. Hyperspectral Imaging Instrument Product Portfolio
7.4.3 SIMTRUM Pte. Ltd. Hyperspectral Imaging Instrument Production, Value, Price and Gross Margin (2020-2025)
7.4.4 SIMTRUM Pte. Ltd. Main Business and Markets Served
7.4.5 SIMTRUM Pte. Ltd. Recent Developments/Updates
7.5 New Age Instruments & Materials
7.5.1 New Age Instruments & Materials Hyperspectral Imaging Instrument Company Information
7.5.2 New Age Instruments & Materials Hyperspectral Imaging Instrument Product Portfolio
7.5.3 New Age Instruments & Materials Hyperspectral Imaging Instrument Production, Value, Price and Gross Margin (2020-2025)
7.5.4 New Age Instruments & Materials Main Business and Markets Served
7.5.5 New Age Instruments & Materials Recent Developments/Updates
7.6 Tokyo Instruments, Inc.
7.6.1 Tokyo Instruments, Inc. Hyperspectral Imaging Instrument Company Information
7.6.2 Tokyo Instruments, Inc. Hyperspectral Imaging Instrument Product Portfolio
7.6.3 Tokyo Instruments, Inc. Hyperspectral Imaging Instrument Production, Value, Price and Gross Margin (2020-2025)
7.6.4 Tokyo Instruments, Inc. Main Business and Markets Served
7.6.5 Tokyo Instruments, Inc. Recent Developments/Updates
7.7 Andor Technology
7.7.1 Andor Technology Hyperspectral Imaging Instrument Company Information
7.7.2 Andor Technology Hyperspectral Imaging Instrument Product Portfolio
7.7.3 Andor Technology Hyperspectral Imaging Instrument Production, Value, Price and Gross Margin (2020-2025)
7.7.4 Andor Technology Main Business and Markets Served
7.7.5 Andor Technology Recent Developments/Updates
7.8 Bodkin Design & Engineering
7.8.1 Bodkin Design & Engineering Hyperspectral Imaging Instrument Company Information
7.8.2 Bodkin Design & Engineering Hyperspectral Imaging Instrument Product Portfolio
7.8.3 Bodkin Design & Engineering Hyperspectral Imaging Instrument Production, Value, Price and Gross Margin (2020-2025)
7.8.4 Bodkin Design & Engineering Main Business and Markets Served
7.8.5 Bodkin Design & Engineering Recent Developments/Updates
7.9 Camlin Ltd.
7.9.1 Camlin Ltd. Hyperspectral Imaging Instrument Company Information
7.9.2 Camlin Ltd. Hyperspectral Imaging Instrument Product Portfolio
7.9.3 Camlin Ltd. Hyperspectral Imaging Instrument Production, Value, Price and Gross Margin (2020-2025)
7.9.4 Camlin Ltd. Main Business and Markets Served
7.9.5 Camlin Ltd. Recent Developments/Updates
7.10 CRAIC Technologies, Inc.
7.10.1 CRAIC Technologies, Inc. Hyperspectral Imaging Instrument Company Information
7.10.2 CRAIC Technologies, Inc. Hyperspectral Imaging Instrument Product Portfolio
7.10.3 CRAIC Technologies, Inc. Hyperspectral Imaging Instrument Production, Value, Price and Gross Margin (2020-2025)
7.10.4 CRAIC Technologies, Inc. Main Business and Markets Served
7.10.5 CRAIC Technologies, Inc. Recent Developments/Updates
7.11 Flash Photonics
7.11.1 Flash Photonics Hyperspectral Imaging Instrument Company Information
7.11.2 Flash Photonics Hyperspectral Imaging Instrument Product Portfolio
7.11.3 Flash Photonics Hyperspectral Imaging Instrument Production, Value, Price and Gross Margin (2020-2025)
7.11.4 Flash Photonics Main Business and Markets Served
7.11.5 Flash Photonics Recent Developments/Updates
7.12 Headwall Photonics
7.12.1 Headwall Photonics Hyperspectral Imaging Instrument Company Information
7.12.2 Headwall Photonics Hyperspectral Imaging Instrument Product Portfolio
7.12.3 Headwall Photonics Hyperspectral Imaging Instrument Production, Value, Price and Gross Margin (2020-2025)
7.12.4 Headwall Photonics Main Business and Markets Served
7.12.5 Headwall Photonics Recent Developments/Updates
7.13 Hyspex
7.13.1 Hyspex Hyperspectral Imaging Instrument Company Information
7.13.2 Hyspex Hyperspectral Imaging Instrument Product Portfolio
7.13.3 Hyspex Hyperspectral Imaging Instrument Production, Value, Price and Gross Margin (2020-2025)
7.13.4 Hyspex Main Business and Markets Served
7.13.5 Hyspex Recent Developments/Updates
7.14 Labsphere, Inc.
7.14.1 Labsphere, Inc. Hyperspectral Imaging Instrument Company Information
7.14.2 Labsphere, Inc. Hyperspectral Imaging Instrument Product Portfolio
7.14.3 Labsphere, Inc. Hyperspectral Imaging Instrument Production, Value, Price and Gross Margin (2020-2025)
7.14.4 Labsphere, Inc. Main Business and Markets Served
7.14.5 Labsphere, Inc. Recent Developments/Updates
7.15 NIREOS
7.15.1 NIREOS Hyperspectral Imaging Instrument Company Information
7.15.2 NIREOS Hyperspectral Imaging Instrument Product Portfolio
7.15.3 NIREOS Hyperspectral Imaging Instrument Production, Value, Price and Gross Margin (2020-2025)
7.15.4 NIREOS Main Business and Markets Served
7.15.5 NIREOS Recent Developments/Updates
7.16 Opton Laser International
7.16.1 Opton Laser International Hyperspectral Imaging Instrument Company Information
7.16.2 Opton Laser International Hyperspectral Imaging Instrument Product Portfolio
7.16.3 Opton Laser International Hyperspectral Imaging Instrument Production, Value, Price and Gross Margin (2020-2025)
7.16.4 Opton Laser International Main Business and Markets Served
7.16.5 Opton Laser International Recent Developments/Updates
7.17 Photon etc. Inc.
7.17.1 Photon etc. Inc. Hyperspectral Imaging Instrument Company Information
7.17.2 Photon etc. Inc. Hyperspectral Imaging Instrument Product Portfolio
7.17.3 Photon etc. Inc. Hyperspectral Imaging Instrument Production, Value, Price and Gross Margin (2020-2025)
7.17.4 Photon etc. Inc. Main Business and Markets Served
7.17.5 Photon etc. Inc. Recent Developments/Updates
7.18 Pro-Lite Technology Ltd
7.18.1 Pro-Lite Technology Ltd Hyperspectral Imaging Instrument Company Information
7.18.2 Pro-Lite Technology Ltd Hyperspectral Imaging Instrument Product Portfolio
7.18.3 Pro-Lite Technology Ltd Hyperspectral Imaging Instrument Production, Value, Price and Gross Margin (2020-2025)
7.18.4 Pro-Lite Technology Ltd Main Business and Markets Served
7.18.5 Pro-Lite Technology Ltd Recent Developments/Updates
7.19 SPECIM
7.19.1 SPECIM Hyperspectral Imaging Instrument Company Information
7.19.2 SPECIM Hyperspectral Imaging Instrument Product Portfolio
7.19.3 SPECIM Hyperspectral Imaging Instrument Production, Value, Price and Gross Margin (2020-2025)
7.19.4 SPECIM Main Business and Markets Served
7.19.5 SPECIM Recent Developments/Updates
7.20 Tematys
7.20.1 Tematys Hyperspectral Imaging Instrument Company Information
7.20.2 Tematys Hyperspectral Imaging Instrument Product Portfolio
7.20.3 Tematys Hyperspectral Imaging Instrument Production, Value, Price and Gross Margin (2020-2025)
7.20.4 Tematys Main Business and Markets Served
7.20.5 Tematys Recent Developments/Updates
7.21 Brimrose
7.21.1 Brimrose Hyperspectral Imaging Instrument Company Information
7.21.2 Brimrose Hyperspectral Imaging Instrument Product Portfolio
7.21.3 Brimrose Hyperspectral Imaging Instrument Production, Value, Price and Gross Margin (2020-2025)
7.21.4 Brimrose Main Business and Markets Served
7.21.5 Brimrose Recent Developments/Updates
7.22 Zolix
7.22.1 Zolix Hyperspectral Imaging Instrument Company Information
7.22.2 Zolix Hyperspectral Imaging Instrument Product Portfolio
7.22.3 Zolix Hyperspectral Imaging Instrument Production, Value, Price and Gross Margin (2020-2025)
7.22.4 Zolix Main Business and Markets Served
7.22.5 Zolix Recent Developments/Updates
7.23 Resonon
7.23.1 Resonon Hyperspectral Imaging Instrument Company Information
7.23.2 Resonon Hyperspectral Imaging Instrument Product Portfolio
7.23.3 Resonon Hyperspectral Imaging Instrument Production, Value, Price and Gross Margin (2020-2025)
7.23.4 Resonon Main Business and Markets Served
7.23.5 Resonon Recent Developments/Updates
7.24 IMEC
7.24.1 IMEC Hyperspectral Imaging Instrument Company Information
7.24.2 IMEC Hyperspectral Imaging Instrument Product Portfolio
7.24.3 IMEC Hyperspectral Imaging Instrument Production, Value, Price and Gross Margin (2020-2025)
7.24.4 IMEC Main Business and Markets Served
7.24.5 IMEC Recent Developments/Updates
7.25 Surface Optics
7.25.1 Surface Optics Hyperspectral Imaging Instrument Company Information
7.25.2 Surface Optics Hyperspectral Imaging Instrument Product Portfolio
7.25.3 Surface Optics Hyperspectral Imaging Instrument Production, Value, Price and Gross Margin (2020-2025)
7.25.4 Surface Optics Main Business and Markets Served
7.25.5 Surface Optics Recent Developments/Updates
7.26 Norsk Elektro Optikk
7.26.1 Norsk Elektro Optikk Hyperspectral Imaging Instrument Company Information
7.26.2 Norsk Elektro Optikk Hyperspectral Imaging Instrument Product Portfolio
7.26.3 Norsk Elektro Optikk Hyperspectral Imaging Instrument Production, Value, Price and Gross Margin (2020-2025)
7.26.4 Norsk Elektro Optikk Main Business and Markets Served
7.26.5 Norsk Elektro Optikk Recent Developments/Updates
7.27 ITRES
7.27.1 ITRES Hyperspectral Imaging Instrument Company Information
7.27.2 ITRES Hyperspectral Imaging Instrument Product Portfolio
7.27.3 ITRES Hyperspectral Imaging Instrument Production, Value, Price and Gross Margin (2020-2025)
7.27.4 ITRES Main Business and Markets Served
7.27.5 ITRES Recent Developments/Updates
7.28 Telops
7.28.1 Telops Hyperspectral Imaging Instrument Company Information
7.28.2 Telops Hyperspectral Imaging Instrument Product Portfolio
7.28.3 Telops Hyperspectral Imaging Instrument Production, Value, Price and Gross Margin (2020-2025)
7.28.4 Telops Main Business and Markets Served
7.28.5 Telops Recent Developments/Updates
7.29 Corning
7.29.1 Corning Hyperspectral Imaging Instrument Company Information
7.29.2 Corning Hyperspectral Imaging Instrument Product Portfolio
7.29.3 Corning Hyperspectral Imaging Instrument Production, Value, Price and Gross Margin (2020-2025)
7.29.4 Corning Main Business and Markets Served
7.29.5 Corning Recent Developments/Updates
7.30 BaySpec
7.30.1 BaySpec Hyperspectral Imaging Instrument Company Information
7.30.2 BaySpec Hyperspectral Imaging Instrument Product Portfolio
7.30.3 BaySpec Hyperspectral Imaging Instrument Production, Value, Price and Gross Margin (2020-2025)
7.30.4 BaySpec Main Business and Markets Served
7.30.5 BaySpec Recent Developments/Updates
8 Industry Chain and Sales Channels Analysis
8.1 Hyperspectral Imaging Instrument Industry Chain Analysis
8.2 Hyperspectral Imaging Instrument Raw Material Supply Analysis
8.2.1 Key Raw Materials
8.2.2 Raw Materials Key Suppliers
8.3 Hyperspectral Imaging Instrument Production Mode & Process Analysis
8.4 Hyperspectral Imaging Instrument Sales and Marketing
8.4.1 Hyperspectral Imaging Instrument Sales Channels
8.4.2 Hyperspectral Imaging Instrument Distributors
8.5 Hyperspectral Imaging Instrument Customer Analysis
9 Hyperspectral Imaging Instrument Market Dynamics
9.1 Hyperspectral Imaging Instrument Industry Trends
9.2 Hyperspectral Imaging Instrument Market Drivers
9.3 Hyperspectral Imaging Instrument Market Challenges
9.4 Hyperspectral Imaging Instrument Market Restraints
10 Research Findings and Conclusion
11 Methodology and Data Source
11.1 Methodology/Research Approach
11.1.1 Research Programs/Design
11.1.2 Market Size Estimation
11.1.3 Market Breakdown and Data Triangulation
11.2 Data Source
11.2.1 Secondary Sources
11.2.2 Primary Sources
11.3 Author List
11.4 Disclaimer
List of Tables
 Table 1. Global Hyperspectral Imaging Instrument Market Value by Type, (US$ Million) & (2024 VS 2031)
 Table 2. Global Hyperspectral Imaging Instrument Market Value by Application, (US$ Million) & (2024 VS 2031)
 Table 3. Global Hyperspectral Imaging Instrument Production Capacity (K Units) by Manufacturers in 2024
 Table 4. Global Hyperspectral Imaging Instrument Production by Manufacturers (2020-2025) & (K Units)
 Table 5. Global Hyperspectral Imaging Instrument Production Market Share by Manufacturers (2020-2025)
 Table 6. Global Hyperspectral Imaging Instrument Production Value by Manufacturers (2020-2025) & (US$ Million)
 Table 7. Global Hyperspectral Imaging Instrument Production Value Share by Manufacturers (2020-2025)
 Table 8. Global Key Players of Hyperspectral Imaging Instrument, Industry Ranking, 2023 VS 2024
 Table 9. Company Type (Tier 1, Tier 2, and Tier 3) & (based on the Production Value in Hyperspectral Imaging Instrument as of 2024)
 Table 10. Global Market Hyperspectral Imaging Instrument Average Price by Manufacturers (US$/Unit) & (2020-2025)
 Table 11. Global Key Manufacturers of Hyperspectral Imaging Instrument, Manufacturing Base Distribution and Headquarters
 Table 12. Global Key Manufacturers of Hyperspectral Imaging Instrument, Product Offered and Application
 Table 13. Global Key Manufacturers of Hyperspectral Imaging Instrument, Date of Enter into This Industry
 Table 14. Global Hyperspectral Imaging Instrument Manufacturers Market Concentration Ratio (CR5 and HHI)
 Table 15. Mergers & Acquisitions, Expansion Plans
 Table 16. Global Hyperspectral Imaging Instrument Production Value by Region: 2020 VS 2024 VS 2031 (US$ Million)
 Table 17. Global Hyperspectral Imaging Instrument Production Value (US$ Million) by Region (2020-2025)
 Table 18. Global Hyperspectral Imaging Instrument Production Value Market Share by Region (2020-2025)
 Table 19. Global Hyperspectral Imaging Instrument Production Value (US$ Million) Forecast by Region (2026-2031)
 Table 20. Global Hyperspectral Imaging Instrument Production Value Market Share Forecast by Region (2026-2031)
 Table 21. Global Hyperspectral Imaging Instrument Production Comparison by Region: 2020 VS 2024 VS 2031 (K Units)
 Table 22. Global Hyperspectral Imaging Instrument Production (K Units) by Region (2020-2025)
 Table 23. Global Hyperspectral Imaging Instrument Production Market Share by Region (2020-2025)
 Table 24. Global Hyperspectral Imaging Instrument Production (K Units) Forecast by Region (2026-2031)
 Table 25. Global Hyperspectral Imaging Instrument Production Market Share Forecast by Region (2026-2031)
 Table 26. Global Hyperspectral Imaging Instrument Market Average Price (US$/Unit) by Region (2020-2025)
 Table 27. Global Hyperspectral Imaging Instrument Market Average Price (US$/Unit) by Region (2026-2031)
 Table 28. Global Hyperspectral Imaging Instrument Consumption Growth Rate by Region: 2020 VS 2024 VS 2031 (K Units)
 Table 29. Global Hyperspectral Imaging Instrument Consumption by Region (2020-2025) & (K Units)
 Table 30. Global Hyperspectral Imaging Instrument Consumption Market Share by Region (2020-2025)
 Table 31. Global Hyperspectral Imaging Instrument Forecasted Consumption by Region (2026-2031) & (K Units)
 Table 32. Global Hyperspectral Imaging Instrument Forecasted Consumption Market Share by Region (2026-2031)
 Table 33. North America Hyperspectral Imaging Instrument Consumption Growth Rate by Country: 2020 VS 2024 VS 2031 (K Units)
 Table 34. North America Hyperspectral Imaging Instrument Consumption by Country (2020-2025) & (K Units)
 Table 35. North America Hyperspectral Imaging Instrument Consumption by Country (2026-2031) & (K Units)
 Table 36. Europe Hyperspectral Imaging Instrument Consumption Growth Rate by Country: 2020 VS 2024 VS 2031 (K Units)
 Table 37. Europe Hyperspectral Imaging Instrument Consumption by Country (2020-2025) & (K Units)
 Table 38. Europe Hyperspectral Imaging Instrument Consumption by Country (2026-2031) & (K Units)
 Table 39. Asia Pacific Hyperspectral Imaging Instrument Consumption Growth Rate by Region: 2020 VS 2024 VS 2031 (K Units)
 Table 40. Asia Pacific Hyperspectral Imaging Instrument Consumption by Region (2020-2025) & (K Units)
 Table 41. Asia Pacific Hyperspectral Imaging Instrument Consumption by Region (2026-2031) & (K Units)
 Table 42. Latin America, Middle East & Africa Hyperspectral Imaging Instrument Consumption Growth Rate by Country: 2020 VS 2024 VS 2031 (K Units)
 Table 43. Latin America, Middle East & Africa Hyperspectral Imaging Instrument Consumption by Country (2020-2025) & (K Units)
 Table 44. Latin America, Middle East & Africa Hyperspectral Imaging Instrument Consumption by Country (2026-2031) & (K Units)
 Table 45. Global Hyperspectral Imaging Instrument Production (K Units) by Type (2020-2025)
 Table 46. Global Hyperspectral Imaging Instrument Production (K Units) by Type (2026-2031)
 Table 47. Global Hyperspectral Imaging Instrument Production Market Share by Type (2020-2025)
 Table 48. Global Hyperspectral Imaging Instrument Production Market Share by Type (2026-2031)
 Table 49. Global Hyperspectral Imaging Instrument Production Value (US$ Million) by Type (2020-2025)
 Table 50. Global Hyperspectral Imaging Instrument Production Value (US$ Million) by Type (2026-2031)
 Table 51. Global Hyperspectral Imaging Instrument Production Value Market Share by Type (2020-2025)
 Table 52. Global Hyperspectral Imaging Instrument Production Value Market Share by Type (2026-2031)
 Table 53. Global Hyperspectral Imaging Instrument Price (US$/Unit) by Type (2020-2025)
 Table 54. Global Hyperspectral Imaging Instrument Price (US$/Unit) by Type (2026-2031)
 Table 55. Global Hyperspectral Imaging Instrument Production (K Units) by Application (2020-2025)
 Table 56. Global Hyperspectral Imaging Instrument Production (K Units) by Application (2026-2031)
 Table 57. Global Hyperspectral Imaging Instrument Production Market Share by Application (2020-2025)
 Table 58. Global Hyperspectral Imaging Instrument Production Market Share by Application (2026-2031)
 Table 59. Global Hyperspectral Imaging Instrument Production Value (US$ Million) by Application (2020-2025)
 Table 60. Global Hyperspectral Imaging Instrument Production Value (US$ Million) by Application (2026-2031)
 Table 61. Global Hyperspectral Imaging Instrument Production Value Market Share by Application (2020-2025)
 Table 62. Global Hyperspectral Imaging Instrument Production Value Market Share by Application (2026-2031)
 Table 63. Global Hyperspectral Imaging Instrument Price (US$/Unit) by Application (2020-2025)
 Table 64. Global Hyperspectral Imaging Instrument Price (US$/Unit) by Application (2026-2031)
 Table 65. NKT Photonics Hyperspectral Imaging Instrument Company Information
 Table 66. NKT Photonics Hyperspectral Imaging Instrument Specification and Application
 Table 67. NKT Photonics Hyperspectral Imaging Instrument Production (K Units), Value (US$ Million), Price (US$/Unit) and Gross Margin (2020-2025)
 Table 68. NKT Photonics Main Business and Markets Served
 Table 69. NKT Photonics Recent Developments/Updates
 Table 70. Vortex Optical Coatings Ltd. Hyperspectral Imaging Instrument Company Information
 Table 71. Vortex Optical Coatings Ltd. Hyperspectral Imaging Instrument Specification and Application
 Table 72. Vortex Optical Coatings Ltd. Hyperspectral Imaging Instrument Production (K Units), Value (US$ Million), Price (US$/Unit) and Gross Margin (2020-2025)
 Table 73. Vortex Optical Coatings Ltd. Main Business and Markets Served
 Table 74. Vortex Optical Coatings Ltd. Recent Developments/Updates
 Table 75. SI Stuttgart Instruments GmbH Hyperspectral Imaging Instrument Company Information
 Table 76. SI Stuttgart Instruments GmbH Hyperspectral Imaging Instrument Specification and Application
 Table 77. SI Stuttgart Instruments GmbH Hyperspectral Imaging Instrument Production (K Units), Value (US$ Million), Price (US$/Unit) and Gross Margin (2020-2025)
 Table 78. SI Stuttgart Instruments GmbH Main Business and Markets Served
 Table 79. SI Stuttgart Instruments GmbH Recent Developments/Updates
 Table 80. SIMTRUM Pte. Ltd. Hyperspectral Imaging Instrument Company Information
 Table 81. SIMTRUM Pte. Ltd. Hyperspectral Imaging Instrument Specification and Application
 Table 82. SIMTRUM Pte. Ltd. Hyperspectral Imaging Instrument Production (K Units), Value (US$ Million), Price (US$/Unit) and Gross Margin (2020-2025)
 Table 83. SIMTRUM Pte. Ltd. Main Business and Markets Served
 Table 84. SIMTRUM Pte. Ltd. Recent Developments/Updates
 Table 85. New Age Instruments & Materials Hyperspectral Imaging Instrument Company Information
 Table 86. New Age Instruments & Materials Hyperspectral Imaging Instrument Specification and Application
 Table 87. New Age Instruments & Materials Hyperspectral Imaging Instrument Production (K Units), Value (US$ Million), Price (US$/Unit) and Gross Margin (2020-2025)
 Table 88. New Age Instruments & Materials Main Business and Markets Served
 Table 89. New Age Instruments & Materials Recent Developments/Updates
 Table 90. Tokyo Instruments, Inc. Hyperspectral Imaging Instrument Company Information
 Table 91. Tokyo Instruments, Inc. Hyperspectral Imaging Instrument Specification and Application
 Table 92. Tokyo Instruments, Inc. Hyperspectral Imaging Instrument Production (K Units), Value (US$ Million), Price (US$/Unit) and Gross Margin (2020-2025)
 Table 93. Tokyo Instruments, Inc. Main Business and Markets Served
 Table 94. Tokyo Instruments, Inc. Recent Developments/Updates
 Table 95. Andor Technology Hyperspectral Imaging Instrument Company Information
 Table 96. Andor Technology Hyperspectral Imaging Instrument Specification and Application
 Table 97. Andor Technology Hyperspectral Imaging Instrument Production (K Units), Value (US$ Million), Price (US$/Unit) and Gross Margin (2020-2025)
 Table 98. Andor Technology Main Business and Markets Served
 Table 99. Andor Technology Recent Developments/Updates
 Table 100. Bodkin Design & Engineering Hyperspectral Imaging Instrument Company Information
 Table 101. Bodkin Design & Engineering Hyperspectral Imaging Instrument Specification and Application
 Table 102. Bodkin Design & Engineering Hyperspectral Imaging Instrument Production (K Units), Value (US$ Million), Price (US$/Unit) and Gross Margin (2020-2025)
 Table 103. Bodkin Design & Engineering Main Business and Markets Served
 Table 104. Bodkin Design & Engineering Recent Developments/Updates
 Table 105. Camlin Ltd. Hyperspectral Imaging Instrument Company Information
 Table 106. Camlin Ltd. Hyperspectral Imaging Instrument Specification and Application
 Table 107. Camlin Ltd. Hyperspectral Imaging Instrument Production (K Units), Value (US$ Million), Price (US$/Unit) and Gross Margin (2020-2025)
 Table 108. Camlin Ltd. Main Business and Markets Served
 Table 109. Camlin Ltd. Recent Developments/Updates
 Table 110. CRAIC Technologies, Inc. Hyperspectral Imaging Instrument Company Information
 Table 111. CRAIC Technologies, Inc. Hyperspectral Imaging Instrument Specification and Application
 Table 112. CRAIC Technologies, Inc. Hyperspectral Imaging Instrument Production (K Units), Value (US$ Million), Price (US$/Unit) and Gross Margin (2020-2025)
 Table 113. CRAIC Technologies, Inc. Main Business and Markets Served
 Table 114. CRAIC Technologies, Inc. Recent Developments/Updates
 Table 115. Flash Photonics Hyperspectral Imaging Instrument Company Information
 Table 116. Flash Photonics Hyperspectral Imaging Instrument Specification and Application
 Table 117. Flash Photonics Hyperspectral Imaging Instrument Production (K Units), Value (US$ Million), Price (US$/Unit) and Gross Margin (2020-2025)
 Table 118. Flash Photonics Main Business and Markets Served
 Table 119. Flash Photonics Recent Developments/Updates
 Table 120. Headwall Photonics Hyperspectral Imaging Instrument Company Information
 Table 121. Headwall Photonics Hyperspectral Imaging Instrument Specification and Application
 Table 122. Headwall Photonics Hyperspectral Imaging Instrument Production (K Units), Value (US$ Million), Price (US$/Unit) and Gross Margin (2020-2025)
 Table 123. Headwall Photonics Main Business and Markets Served
 Table 124. Headwall Photonics Recent Developments/Updates
 Table 125. Hyspex Hyperspectral Imaging Instrument Company Information
 Table 126. Hyspex Hyperspectral Imaging Instrument Specification and Application
 Table 127. Hyspex Hyperspectral Imaging Instrument Production (K Units), Value (US$ Million), Price (US$/Unit) and Gross Margin (2020-2025)
 Table 128. Hyspex Main Business and Markets Served
 Table 129. Hyspex Recent Developments/Updates
 Table 130. Labsphere, Inc. Hyperspectral Imaging Instrument Company Information
 Table 131. Labsphere, Inc. Hyperspectral Imaging Instrument Specification and Application
 Table 132. Labsphere, Inc. Hyperspectral Imaging Instrument Production (K Units), Value (US$ Million), Price (US$/Unit) and Gross Margin (2020-2025)
 Table 133. Labsphere, Inc. Main Business and Markets Served
 Table 134. Labsphere, Inc. Recent Developments/Updates
 Table 135. NIREOS Hyperspectral Imaging Instrument Company Information
 Table 136. NIREOS Hyperspectral Imaging Instrument Specification and Application
 Table 137. NIREOS Hyperspectral Imaging Instrument Production (K Units), Value (US$ Million), Price (US$/Unit) and Gross Margin (2020-2025)
 Table 138. NIREOS Main Business and Markets Served
 Table 139. NIREOS Recent Developments/Updates
 Table 140. Opton Laser International Hyperspectral Imaging Instrument Company Information
 Table 141. Opton Laser International Hyperspectral Imaging Instrument Specification and Application
 Table 142. Opton Laser International Hyperspectral Imaging Instrument Production (K Units), Value (US$ Million), Price (US$/Unit) and Gross Margin (2020-2025)
 Table 143. Opton Laser International Main Business and Markets Served
 Table 144. Opton Laser International Recent Developments/Updates
 Table 145. Photon etc. Inc. Hyperspectral Imaging Instrument Company Information
 Table 146. Photon etc. Inc. Hyperspectral Imaging Instrument Specification and Application
 Table 147. Photon etc. Inc. Hyperspectral Imaging Instrument Production (K Units), Value (US$ Million), Price (US$/Unit) and Gross Margin (2020-2025)
 Table 148. Photon etc. Inc. Main Business and Markets Served
 Table 149. Photon etc. Inc. Recent Developments/Updates
 Table 150. Pro-Lite Technology Ltd Hyperspectral Imaging Instrument Company Information
 Table 151. Pro-Lite Technology Ltd Hyperspectral Imaging Instrument Specification and Application
 Table 152. Pro-Lite Technology Ltd Hyperspectral Imaging Instrument Production (K Units), Value (US$ Million), Price (US$/Unit) and Gross Margin (2020-2025)
 Table 153. Pro-Lite Technology Ltd Main Business and Markets Served
 Table 154. Pro-Lite Technology Ltd Recent Developments/Updates
 Table 155. SPECIM Hyperspectral Imaging Instrument Company Information
 Table 156. SPECIM Hyperspectral Imaging Instrument Specification and Application
 Table 157. SPECIM Hyperspectral Imaging Instrument Production (K Units), Value (US$ Million), Price (US$/Unit) and Gross Margin (2020-2025)
 Table 158. SPECIM Main Business and Markets Served
 Table 159. SPECIM Recent Developments/Updates
 Table 160. Tematys Hyperspectral Imaging Instrument Company Information
 Table 161. Tematys Hyperspectral Imaging Instrument Specification and Application
 Table 162. Tematys Hyperspectral Imaging Instrument Production (K Units), Value (US$ Million), Price (US$/Unit) and Gross Margin (2020-2025)
 Table 163. Tematys Main Business and Markets Served
 Table 164. Tematys Recent Developments/Updates
 Table 165. Brimrose Hyperspectral Imaging Instrument Company Information
 Table 166. Brimrose Hyperspectral Imaging Instrument Specification and Application
 Table 167. Brimrose Hyperspectral Imaging Instrument Production (K Units), Value (US$ Million), Price (US$/Unit) and Gross Margin (2020-2025)
 Table 168. Brimrose Main Business and Markets Served
 Table 169. Brimrose Recent Developments/Updates
 Table 170. Zolix Hyperspectral Imaging Instrument Company Information
 Table 171. Zolix Hyperspectral Imaging Instrument Specification and Application
 Table 172. Zolix Hyperspectral Imaging Instrument Production (K Units), Value (US$ Million), Price (US$/Unit) and Gross Margin (2020-2025)
 Table 173. Zolix Main Business and Markets Served
 Table 174. Zolix Recent Developments/Updates
 Table 175. Resonon Hyperspectral Imaging Instrument Company Information
 Table 176. Resonon Hyperspectral Imaging Instrument Specification and Application
 Table 177. Resonon Hyperspectral Imaging Instrument Production (K Units), Value (US$ Million), Price (US$/Unit) and Gross Margin (2020-2025)
 Table 178. Resonon Main Business and Markets Served
 Table 179. Resonon Recent Developments/Updates
 Table 180. IMEC Hyperspectral Imaging Instrument Company Information
 Table 181. IMEC Hyperspectral Imaging Instrument Specification and Application
 Table 182. IMEC Hyperspectral Imaging Instrument Production (K Units), Value (US$ Million), Price (US$/Unit) and Gross Margin (2020-2025)
 Table 183. IMEC Main Business and Markets Served
 Table 184. IMEC Recent Developments/Updates
 Table 185. Surface Optics Hyperspectral Imaging Instrument Company Information
 Table 186. Surface Optics Hyperspectral Imaging Instrument Specification and Application
 Table 187. Surface Optics Hyperspectral Imaging Instrument Production (K Units), Value (US$ Million), Price (US$/Unit) and Gross Margin (2020-2025)
 Table 188. Surface Optics Main Business and Markets Served
 Table 189. Surface Optics Recent Developments/Updates
 Table 190. Norsk Elektro Optikk Hyperspectral Imaging Instrument Company Information
 Table 191. Norsk Elektro Optikk Hyperspectral Imaging Instrument Specification and Application
 Table 192. Norsk Elektro Optikk Hyperspectral Imaging Instrument Production (K Units), Value (US$ Million), Price (US$/Unit) and Gross Margin (2020-2025)
 Table 193. Norsk Elektro Optikk Main Business and Markets Served
 Table 194. Norsk Elektro Optikk Recent Developments/Updates
 Table 195. ITRES Hyperspectral Imaging Instrument Company Information
 Table 196. ITRES Hyperspectral Imaging Instrument Specification and Application
 Table 197. ITRES Hyperspectral Imaging Instrument Production (K Units), Value (US$ Million), Price (US$/Unit) and Gross Margin (2020-2025)
 Table 198. ITRES Main Business and Markets Served
 Table 199. ITRES Recent Developments/Updates
 Table 200. Telops Hyperspectral Imaging Instrument Company Information
 Table 201. Telops Hyperspectral Imaging Instrument Specification and Application
 Table 202. Telops Hyperspectral Imaging Instrument Production (K Units), Value (US$ Million), Price (US$/Unit) and Gross Margin (2020-2025)
 Table 203. Telops Main Business and Markets Served
 Table 204. Telops Recent Developments/Updates
 Table 205. Corning Hyperspectral Imaging Instrument Company Information
 Table 206. Corning Hyperspectral Imaging Instrument Specification and Application
 Table 207. Corning Hyperspectral Imaging Instrument Production (K Units), Value (US$ Million), Price (US$/Unit) and Gross Margin (2020-2025)
 Table 208. Corning Main Business and Markets Served
 Table 209. Corning Recent Developments/Updates
 Table 210. BaySpec Hyperspectral Imaging Instrument Company Information
 Table 211. BaySpec Hyperspectral Imaging Instrument Specification and Application
 Table 212. BaySpec Hyperspectral Imaging Instrument Production (K Units), Value (US$ Million), Price (US$/Unit) and Gross Margin (2020-2025)
 Table 213. BaySpec Main Business and Markets Served
 Table 214. BaySpec Recent Developments/Updates
 Table 215. Key Raw Materials Lists
 Table 216. Raw Materials Key Suppliers Lists
 Table 217. Hyperspectral Imaging Instrument Distributors List
 Table 218. Hyperspectral Imaging Instrument Customers List
 Table 219. Hyperspectral Imaging Instrument Market Trends
 Table 220. Hyperspectral Imaging Instrument Market Drivers
 Table 221. Hyperspectral Imaging Instrument Market Challenges
 Table 222. Hyperspectral Imaging Instrument Market Restraints
 Table 223. Research Programs/Design for This Report
 Table 224. Key Data Information from Secondary Sources
 Table 225. Key Data Information from Primary Sources
 Table 226. Authors List of This Report


List of Figures
 Figure 1. Product Picture of Hyperspectral Imaging Instrument
 Figure 2. Global Hyperspectral Imaging Instrument Market Value by Type, (US$ Million) & (2020-2031)
 Figure 3. Global Hyperspectral Imaging Instrument Market Share by Type: 2024 VS 2031
 Figure 4. Visible/Near Infrared (VNIR) Product Picture
 Figure 5. Short Wave Infrared (SWIR) Product Picture
 Figure 6. Medium Wave Infrared (MWIR) Product Picture
 Figure 7. Long Wave Infrared (LWIR) Product Picture
 Figure 8. Others Product Picture
 Figure 9. Global Hyperspectral Imaging Instrument Market Value by Application, (US$ Million) & (2020-2031)
 Figure 10. Global Hyperspectral Imaging Instrument Market Share by Application: 2024 VS 2031
 Figure 11. National Defense Security
 Figure 12. Environmental Monitoring And Mineralogy
 Figure 13. Food And Agriculture
 Figure 14. Life Sciences And Medical Diagnosis
 Figure 15. Vegetation And Ecological Research
 Figure 16. Environmental Recycling Field
 Figure 17. Others
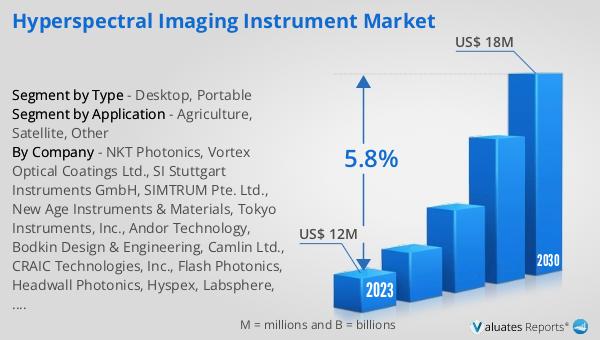
 Figure 18. Global Hyperspectral Imaging Instrument Production Value (US$ Million), 2020 VS 2024 VS 2031
 Figure 19. Global Hyperspectral Imaging Instrument Production Value (US$ Million) & (2020-2031)
 Figure 20. Global Hyperspectral Imaging Instrument Production Capacity (K Units) & (2020-2031)
 Figure 21. Global Hyperspectral Imaging Instrument Production (K Units) & (2020-2031)
 Figure 22. Global Hyperspectral Imaging Instrument Average Price (US$/Unit) & (2020-2031)
 Figure 23. Hyperspectral Imaging Instrument Report Years Considered
 Figure 24. Hyperspectral Imaging Instrument Production Share by Manufacturers in 2024
 Figure 25. Global Hyperspectral Imaging Instrument Production Value Share by Manufacturers (2024)
 Figure 26. Hyperspectral Imaging Instrument Market Share by Company Type (Tier 1, Tier 2, and Tier 3): 2020 VS 2024
 Figure 27. The Global 5 and 10 Largest Players: Market Share by Hyperspectral Imaging Instrument Revenue in 2024
 Figure 28. Global Hyperspectral Imaging Instrument Production Value by Region: 2020 VS 2024 VS 2031 (US$ Million)
 Figure 29. Global Hyperspectral Imaging Instrument Production Value Market Share by Region: 2020 VS 2024 VS 2031
 Figure 30. Global Hyperspectral Imaging Instrument Production Comparison by Region: 2020 VS 2024 VS 2031 (K Units)
 Figure 31. Global Hyperspectral Imaging Instrument Production Market Share by Region: 2020 VS 2024 VS 2031
 Figure 32. North America Hyperspectral Imaging Instrument Production Value (US$ Million) Growth Rate (2020-2031)
 Figure 33. Europe Hyperspectral Imaging Instrument Production Value (US$ Million) Growth Rate (2020-2031)
 Figure 34. China Hyperspectral Imaging Instrument Production Value (US$ Million) Growth Rate (2020-2031)
 Figure 35. Japan Hyperspectral Imaging Instrument Production Value (US$ Million) Growth Rate (2020-2031)
 Figure 36. Global Hyperspectral Imaging Instrument Consumption by Region: 2020 VS 2024 VS 2031 (K Units)
 Figure 37. Global Hyperspectral Imaging Instrument Consumption Market Share by Region: 2020 VS 2024 VS 2031
 Figure 38. North America Hyperspectral Imaging Instrument Consumption and Growth Rate (2020-2031) & (K Units)
 Figure 39. North America Hyperspectral Imaging Instrument Consumption Market Share by Country (2020-2031)
 Figure 40. U.S. Hyperspectral Imaging Instrument Consumption and Growth Rate (2020-2031) & (K Units)
 Figure 41. Canada Hyperspectral Imaging Instrument Consumption and Growth Rate (2020-2031) & (K Units)
 Figure 42. Europe Hyperspectral Imaging Instrument Consumption and Growth Rate (2020-2031) & (K Units)
 Figure 43. Europe Hyperspectral Imaging Instrument Consumption Market Share by Country (2020-2031)
 Figure 44. Germany Hyperspectral Imaging Instrument Consumption and Growth Rate (2020-2031) & (K Units)
 Figure 45. France Hyperspectral Imaging Instrument Consumption and Growth Rate (2020-2031) & (K Units)
 Figure 46. U.K. Hyperspectral Imaging Instrument Consumption and Growth Rate (2020-2031) & (K Units)
 Figure 47. Italy Hyperspectral Imaging Instrument Consumption and Growth Rate (2020-2031) & (K Units)
 Figure 48. Netherlands Hyperspectral Imaging Instrument Consumption and Growth Rate (2020-2031) & (K Units)
 Figure 49. Asia Pacific Hyperspectral Imaging Instrument Consumption and Growth Rate (2020-2031) & (K Units)
 Figure 50. Asia Pacific Hyperspectral Imaging Instrument Consumption Market Share by Region (2020-2031)
 Figure 51. China Hyperspectral Imaging Instrument Consumption and Growth Rate (2020-2031) & (K Units)
 Figure 52. Japan Hyperspectral Imaging Instrument Consumption and Growth Rate (2020-2031) & (K Units)
 Figure 53. South Korea Hyperspectral Imaging Instrument Consumption and Growth Rate (2020-2031) & (K Units)
 Figure 54. China Taiwan Hyperspectral Imaging Instrument Consumption and Growth Rate (2020-2031) & (K Units)
 Figure 55. Southeast Asia Hyperspectral Imaging Instrument Consumption and Growth Rate (2020-2031) & (K Units)
 Figure 56. India Hyperspectral Imaging Instrument Consumption and Growth Rate (2020-2031) & (K Units)
 Figure 57. Latin America, Middle East & Africa Hyperspectral Imaging Instrument Consumption and Growth Rate (2020-2031) & (K Units)
 Figure 58. Latin America, Middle East & Africa Hyperspectral Imaging Instrument Consumption Market Share by Country (2020-2031)
 Figure 59. Mexico Hyperspectral Imaging Instrument Consumption and Growth Rate (2020-2031) & (K Units)
 Figure 60. Brazil Hyperspectral Imaging Instrument Consumption and Growth Rate (2020-2031) & (K Units)
 Figure 61. Turkey Hyperspectral Imaging Instrument Consumption and Growth Rate (2020-2031) & (K Units)
 Figure 62. GCC Countries Hyperspectral Imaging Instrument Consumption and Growth Rate (2020-2031) & (K Units)
 Figure 63. Global Production Market Share of Hyperspectral Imaging Instrument by Type (2020-2031)
 Figure 64. Global Production Value Market Share of Hyperspectral Imaging Instrument by Type (2020-2031)
 Figure 65. Global Hyperspectral Imaging Instrument Price (US$/Unit) by Type (2020-2031)
 Figure 66. Global Production Market Share of Hyperspectral Imaging Instrument by Application (2020-2031)
 Figure 67. Global Production Value Market Share of Hyperspectral Imaging Instrument by Application (2020-2031)
 Figure 68. Global Hyperspectral Imaging Instrument Price (US$/Unit) by Application (2020-2031)
 Figure 69. Hyperspectral Imaging Instrument Value Chain
 Figure 70. Channels of Distribution (Direct Vs Distribution)
 Figure 71. Bottom-up and Top-down Approaches for This Report
 Figure 72. Data Triangulation
SELECT A FORMAT
Added to Cart
Electronic (PDF)

$2900

This license allows only one user to access the PDF.
Electronic (PDF)

$4350

This license allows 1 - 5 user to access the PDF, license is suitable for small groups of 5 users working together
Electronic (PDF)

$5800

This license allows users/teams in a same Enterprise to use this report, various departments within an enterpise can use this report
Add to Cart
Buy Now (15% Discount)

OUR CUSTOMER

Leap India

SIMILAR REPORTS

RELATED REPORTS

Global Salt Active Nuclease Market Research Report 2025

120 Pages
Type: Report
Code: QYRE-Auto-6W17226
Fri Sep 12 00:00:00 UTC 2025

Add to Cart

Global Ecology Products Market Research Report 2025

120 Pages
Type: Report
Code: QYRE-Auto-29H6022
Fri Sep 12 00:00:00 UTC 2025

Add to Cart

Global Robotics Paint Booth Market Research Report 2025

120 Pages
Type: Report
Code: QYRE-Auto-3R7922
Fri Sep 12 00:00:00 UTC 2025

Add to Cart

Global Parietal Bone Model Market Research Report 2025

120 Pages
Type: Report
Code: QYRE-Auto-34V19460
Fri Sep 12 00:00:00 UTC 2025

Add to Cart