List of Tables
Table 1. Global PPP-RTK GNSS Correction Service Market Size Growth Rate by Type (US$ Million): 2020 VS 2024 VS 2031
Table 2. Global PPP-RTK GNSS Correction Service Market Size Growth by Application (US$ Million): 2020 VS 2024 VS 2031
Table 3. Global Market PPP-RTK GNSS Correction Service Market Size (US$ Million) by Region:2020 VS 2024 VS 2031
Table 4. Global PPP-RTK GNSS Correction Service Revenue (US$ Million) Market Share by Region (2020-2025)
Table 5. Global PPP-RTK GNSS Correction Service Revenue Share by Region (2020-2025)
Table 6. Global PPP-RTK GNSS Correction Service Revenue (US$ Million) Forecast by Region (2026-2031)
Table 7. Global PPP-RTK GNSS Correction Service Revenue Share Forecast by Region (2026-2031)
Table 8. Global PPP-RTK GNSS Correction Service Market Size by Type (2020-2025) & (US$ Million)
Table 9. Global PPP-RTK GNSS Correction Service Revenue Market Share by Type (2020-2025)
Table 10. Global PPP-RTK GNSS Correction Service Forecasted Market Size by Type (2026-2031) & (US$ Million)
Table 11. Global PPP-RTK GNSS Correction Service Revenue Market Share by Type (2026-2031)
Table 12. Representative Players of Each Type
Table 13. Global PPP-RTK GNSS Correction Service Market Size by Application (2020-2025) & (US$ Million)
Table 14. Global PPP-RTK GNSS Correction Service Revenue Market Share by Application (2020-2025)
Table 15. Global PPP-RTK GNSS Correction Service Forecasted Market Size by Application (2026-2031) & (US$ Million)
Table 16. Global PPP-RTK GNSS Correction Service Revenue Market Share by Application (2026-2031)
Table 17. New Sources of Growth in PPP-RTK GNSS Correction Service Application
Table 18. Global PPP-RTK GNSS Correction Service Revenue by Players (2020-2025) & (US$ Million)
Table 19. Global PPP-RTK GNSS Correction Service Market Share by Players (2020-2025)
Table 20. Global Top PPP-RTK GNSS Correction Service Players by Company Type (Tier 1, Tier 2, and Tier 3) & (based on the Revenue in PPP-RTK GNSS Correction Service as of 2024)
Table 21. Ranking of Global Top PPP-RTK GNSS Correction Service Companies by Revenue (US$ Million) in 2024
Table 22. Global 5 Largest Players Market Share by PPP-RTK GNSS Correction Service Revenue (CR5 and HHI) & (2020-2025)
Table 23. Global Key Players of PPP-RTK GNSS Correction Service, Headquarters and Area Served
Table 24. Global Key Players of PPP-RTK GNSS Correction Service, Product and Application
Table 25. Global Key Players of PPP-RTK GNSS Correction Service, Date of Enter into This Industry
Table 26. Mergers & Acquisitions, Expansion Plans
Table 27. North America PPP-RTK GNSS Correction Service Revenue by Company (2020-2025) & (US$ Million)
Table 28. North America PPP-RTK GNSS Correction Service Revenue Market Share by Company (2020-2025)
Table 29. North America PPP-RTK GNSS Correction Service Market Size by Type (2020-2025) & (US$ Million)
Table 30. North America PPP-RTK GNSS Correction Service Market Size by Application (2020-2025) & (US$ Million)
Table 31. Europe PPP-RTK GNSS Correction Service Revenue by Company (2020-2025) & (US$ Million)
Table 32. Europe PPP-RTK GNSS Correction Service Revenue Market Share by Company (2020-2025)
Table 33. Europe PPP-RTK GNSS Correction Service Market Size by Type (2020-2025) & (US$ Million)
Table 34. Europe PPP-RTK GNSS Correction Service Market Size by Application (2020-2025) & (US$ Million)
Table 35. China PPP-RTK GNSS Correction Service Revenue by Company (2020-2025) & (US$ Million)
Table 36. China PPP-RTK GNSS Correction Service Revenue Market Share by Company (2020-2025)
Table 37. China PPP-RTK GNSS Correction Service Market Size by Type (2020-2025) & (US$ Million)
Table 38. China PPP-RTK GNSS Correction Service Market Size by Application (2020-2025) & (US$ Million)
Table 39. Japan PPP-RTK GNSS Correction Service Revenue by Company (2020-2025) & (US$ Million)
Table 40. Japan PPP-RTK GNSS Correction Service Revenue Market Share by Company (2020-2025)
Table 41. Japan PPP-RTK GNSS Correction Service Market Size by Type (2020-2025) & (US$ Million)
Table 42. Japan PPP-RTK GNSS Correction Service Market Size by Application (2020-2025) & (US$ Million)
Table 43. Oceaneering Company Details
Table 44. Oceaneering Business Overview
Table 45. Oceaneering PPP-RTK GNSS Correction Service Product
Table 46. Oceaneering Revenue in PPP-RTK GNSS Correction Service Business (2020-2025) & (US$ Million)
Table 47. Oceaneering Recent Development
Table 48. u-blox Company Details
Table 49. u-blox Business Overview
Table 50. u-blox PPP-RTK GNSS Correction Service Product
Table 51. u-blox Revenue in PPP-RTK GNSS Correction Service Business (2020-2025) & (US$ Million)
Table 52. u-blox Recent Development
Table 53. Septentrio Company Details
Table 54. Septentrio Business Overview
Table 55. Septentrio PPP-RTK GNSS Correction Service Product
Table 56. Septentrio Revenue in PPP-RTK GNSS Correction Service Business (2020-2025) & (US$ Million)
Table 57. Septentrio Recent Development
Table 58. PPP-RTK GNSS Correction Service Market Trends
Table 59. PPP-RTK GNSS Correction Service Market Drivers
Table 60. PPP-RTK GNSS Correction Service Market Challenges
Table 61. PPP-RTK GNSS Correction Service Market Restraints
Table 62. Research Programs/Design for This Report
Table 63. Key Data Information from Secondary Sources
Table 64. Key Data Information from Primary Sources
List of Figures
Figure 1. PPP-RTK GNSS Correction Service Product Picture
Figure 2. Global PPP-RTK GNSS Correction Service Market Share by Type: 2024 VS 2031
Figure 3. Global PPP-RTK Level Service Features
Figure 4. Regional PPP-RTK Level Service Features
Figure 5. Global PPP-RTK GNSS Correction Service Market Share by Application: 2024 VS 2031
Figure 6. Agriculture
Figure 7. Construction
Figure 8. GIS and Mapping
Figure 9. Marine
Figure 10. Others
Figure 11. PPP-RTK GNSS Correction Service Report Years Considered
Figure 12. Global PPP-RTK GNSS Correction Service Market Size (US$ Million), Year-over-Year: 2020-2031
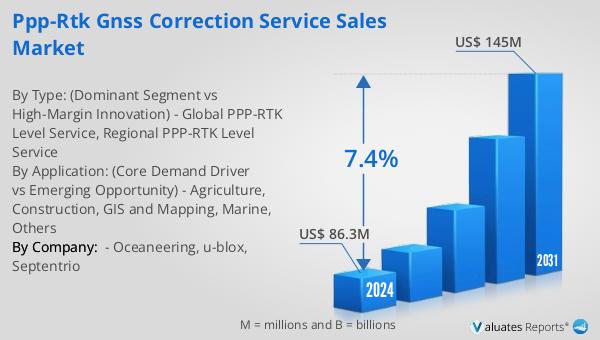
Figure 13. Global PPP-RTK GNSS Correction Service Market Size, (US$ Million), 2020 VS 2024 VS 2031
Figure 14. Global PPP-RTK GNSS Correction Service Revenue Market Share by Region: 2020 VS 2024
Figure 15. North America PPP-RTK GNSS Correction Service Revenue (US$ Million) Growth Rate (2020-2031)
Figure 16. Europe PPP-RTK GNSS Correction Service Revenue (US$ Million) Growth Rate (2020-2031)
Figure 17. China PPP-RTK GNSS Correction Service Revenue (US$ Million) Growth Rate (2020-2031)
Figure 18. Japan PPP-RTK GNSS Correction Service Revenue (US$ Million) Growth Rate (2020-2031)
Figure 19. Global PPP-RTK GNSS Correction Service Market Share by Players in 2024
Figure 20. Global Top PPP-RTK GNSS Correction Service Players by Company Type (Tier 1, Tier 2, and Tier 3) & (based on the Revenue in PPP-RTK GNSS Correction Service as of 2024)
Figure 21. The Top 10 and 5 Players Market Share by PPP-RTK GNSS Correction Service Revenue in 2024
Figure 22. North America PPP-RTK GNSS Correction Service Market Share by Type (2020-2025)
Figure 23. North America PPP-RTK GNSS Correction Service Market Share by Application (2020-2025)
Figure 24. Europe PPP-RTK GNSS Correction Service Market Share by Type (2020-2025)
Figure 25. Europe PPP-RTK GNSS Correction Service Market Share by Application (2020-2025)
Figure 26. China PPP-RTK GNSS Correction Service Market Share by Type (2020-2025)
Figure 27. China PPP-RTK GNSS Correction Service Market Share by Application (2020-2025)
Figure 28. Japan PPP-RTK GNSS Correction Service Market Share by Type (2020-2025)
Figure 29. Japan PPP-RTK GNSS Correction Service Market Share by Application (2020-2025)
Figure 30. Oceaneering Revenue Growth Rate in PPP-RTK GNSS Correction Service Business (2020-2025)
Figure 31. u-blox Revenue Growth Rate in PPP-RTK GNSS Correction Service Business (2020-2025)
Figure 32. Septentrio Revenue Growth Rate in PPP-RTK GNSS Correction Service Business (2020-2025)
Figure 33. Bottom-up and Top-down Approaches for This Report
Figure 34. Data Triangulation
Figure 35. Key Executives Interviewed