List of Tables
Table 1. Global Automotive Components Market Size Growth Rate by Type (US$ Million): 2020 VS 2024 VS 2031
Table 2. Key Players of Driveline & Powertrain
Table 3. Key Players of Interiors & Exteriors
Table 4. Key Players of Electronics
Table 5. Key Players of Bodies & Chassis
Table 6. Key Players of Seating
Table 7. Key Players of Wheel & Tires
Table 8. Key Players of Others
Table 9. Global Automotive Components Market Size Growth by Application (US$ Million): 2020 VS 2024 VS 2031
Table 10. Global Automotive Components Market Size by Region (US$ Million): 2020 VS 2024 VS 2031
Table 11. Global Automotive Components Market Size by Region (2020-2025) & (US$ Million)
Table 12. Global Automotive Components Market Share by Region (2020-2025)
Table 13. Global Automotive Components Forecasted Market Size by Region (2026-2031) & (US$ Million)
Table 14. Global Automotive Components Market Share by Region (2026-2031)
Table 15. Automotive Components Market Trends
Table 16. Automotive Components Market Drivers
Table 17. Automotive Components Market Challenges
Table 18. Automotive Components Market Restraints
Table 19. Global Automotive Components Revenue by Players (2020-2025) & (US$ Million)
Table 20. Global Automotive Components Market Share by Players (2020-2025)
Table 21. Global Top Automotive Components Players by Company Type (Tier 1, Tier 2, and Tier 3) & (based on the Revenue in Automotive Components as of 2024)
Table 22. Ranking of Global Top Automotive Components Companies by Revenue (US$ Million) in 2024
Table 23. Global 5 Largest Players Market Share by Automotive Components Revenue (CR5 and HHI) & (2020-2025)
Table 24. Global Key Players of Automotive Components, Headquarters and Area Served
Table 25. Global Key Players of Automotive Components, Product and Application
Table 26. Global Key Players of Automotive Components, Date of Enter into This Industry
Table 27. Mergers & Acquisitions, Expansion Plans
Table 28. Global Automotive Components Market Size by Type (2020-2025) & (US$ Million)
Table 29. Global Automotive Components Revenue Market Share by Type (2020-2025)
Table 30. Global Automotive Components Forecasted Market Size by Type (2026-2031) & (US$ Million)
Table 31. Global Automotive Components Revenue Market Share by Type (2026-2031)
Table 32. Global Automotive Components Market Size by Application (2020-2025) & (US$ Million)
Table 33. Global Automotive Components Revenue Market Share by Application (2020-2025)
Table 34. Global Automotive Components Forecasted Market Size by Application (2026-2031) & (US$ Million)
Table 35. Global Automotive Components Revenue Market Share by Application (2026-2031)
Table 36. North America Automotive Components Market Size Growth Rate by Country (US$ Million): 2020 VS 2024 VS 2031
Table 37. North America Automotive Components Market Size by Country (2020-2025) & (US$ Million)
Table 38. North America Automotive Components Market Size by Country (2026-2031) & (US$ Million)
Table 39. Europe Automotive Components Market Size Growth Rate by Country (US$ Million): 2020 VS 2024 VS 2031
Table 40. Europe Automotive Components Market Size by Country (2020-2025) & (US$ Million)
Table 41. Europe Automotive Components Market Size by Country (2026-2031) & (US$ Million)
Table 42. Asia-Pacific Automotive Components Market Size Growth Rate by Region (US$ Million): 2020 VS 2024 VS 2031
Table 43. Asia-Pacific Automotive Components Market Size by Region (2020-2025) & (US$ Million)
Table 44. Asia-Pacific Automotive Components Market Size by Region (2026-2031) & (US$ Million)
Table 45. Latin America Automotive Components Market Size Growth Rate by Country (US$ Million): 2020 VS 2024 VS 2031
Table 46. Latin America Automotive Components Market Size by Country (2020-2025) & (US$ Million)
Table 47. Latin America Automotive Components Market Size by Country (2026-2031) & (US$ Million)
Table 48. Middle East & Africa Automotive Components Market Size Growth Rate by Country (US$ Million): 2020 VS 2024 VS 2031
Table 49. Middle East & Africa Automotive Components Market Size by Country (2020-2025) & (US$ Million)
Table 50. Middle East & Africa Automotive Components Market Size by Country (2026-2031) & (US$ Million)
Table 51. Denso Corp. Company Details
Table 52. Denso Corp. Business Overview
Table 53. Denso Corp. Automotive Components Product
Table 54. Denso Corp. Revenue in Automotive Components Business (2020-2025) & (US$ Million)
Table 55. Denso Corp. Recent Development
Table 56. Robert Bosch Company Details
Table 57. Robert Bosch Business Overview
Table 58. Robert Bosch Automotive Components Product
Table 59. Robert Bosch Revenue in Automotive Components Business (2020-2025) & (US$ Million)
Table 60. Robert Bosch Recent Development
Table 61. Magna International Company Details
Table 62. Magna International Business Overview
Table 63. Magna International Automotive Components Product
Table 64. Magna International Revenue in Automotive Components Business (2020-2025) & (US$ Million)
Table 65. Magna International Recent Development
Table 66. ZF Friedrichshafen Company Details
Table 67. ZF Friedrichshafen Business Overview
Table 68. ZF Friedrichshafen Automotive Components Product
Table 69. ZF Friedrichshafen Revenue in Automotive Components Business (2020-2025) & (US$ Million)
Table 70. ZF Friedrichshafen Recent Development
Table 71. Aisin Seiki Company Details
Table 72. Aisin Seiki Business Overview
Table 73. Aisin Seiki Automotive Components Product
Table 74. Aisin Seiki Revenue in Automotive Components Business (2020-2025) & (US$ Million)
Table 75. Aisin Seiki Recent Development
Table 76. Continental Company Details
Table 77. Continental Business Overview
Table 78. Continental Automotive Components Product
Table 79. Continental Revenue in Automotive Components Business (2020-2025) & (US$ Million)
Table 80. Continental Recent Development
Table 81. Hyundai Mobis Company Details
Table 82. Hyundai Mobis Business Overview
Table 83. Hyundai Mobis Automotive Components Product
Table 84. Hyundai Mobis Revenue in Automotive Components Business (2020-2025) & (US$ Million)
Table 85. Hyundai Mobis Recent Development
Table 86. Lear Corp. Company Details
Table 87. Lear Corp. Business Overview
Table 88. Lear Corp. Automotive Components Product
Table 89. Lear Corp. Revenue in Automotive Components Business (2020-2025) & (US$ Million)
Table 90. Lear Corp. Recent Development
Table 91. Valeo Company Details
Table 92. Valeo Business Overview
Table 93. Valeo Automotive Components Product
Table 94. Valeo Revenue in Automotive Components Business (2020-2025) & (US$ Million)
Table 95. Valeo Recent Development
Table 96. Faurecia Company Details
Table 97. Faurecia Business Overview
Table 98. Faurecia Automotive Components Product
Table 99. Faurecia Revenue in Automotive Components Business (2020-2025) & (US$ Million)
Table 100. Faurecia Recent Development
Table 101. Marelli Company Details
Table 102. Marelli Business Overview
Table 103. Marelli Automotive Components Product
Table 104. Marelli Revenue in Automotive Components Business (2020-2025) & (US$ Million)
Table 105. Marelli Recent Development
Table 106. Yazaki Corp. Company Details
Table 107. Yazaki Corp. Business Overview
Table 108. Yazaki Corp. Automotive Components Product
Table 109. Yazaki Corp. Revenue in Automotive Components Business (2020-2025) & (US$ Million)
Table 110. Yazaki Corp. Recent Development
Table 111. Sumitomo Electric Company Details
Table 112. Sumitomo Electric Business Overview
Table 113. Sumitomo Electric Automotive Components Product
Table 114. Sumitomo Electric Revenue in Automotive Components Business (2020-2025) & (US$ Million)
Table 115. Sumitomo Electric Recent Development
Table 116. Aptiv Company Details
Table 117. Aptiv Business Overview
Table 118. Aptiv Automotive Components Product
Table 119. Aptiv Revenue in Automotive Components Business (2020-2025) & (US$ Million)
Table 120. Aptiv Recent Development
Table 121. Panasonic Automotive Company Details
Table 122. Panasonic Automotive Business Overview
Table 123. Panasonic Automotive Automotive Components Product
Table 124. Panasonic Automotive Revenue in Automotive Components Business (2020-2025) & (US$ Million)
Table 125. Panasonic Automotive Recent Development
Table 126. Mahle GmbH Company Details
Table 127. Mahle GmbH Business Overview
Table 128. Mahle GmbH Automotive Components Product
Table 129. Mahle GmbH Revenue in Automotive Components Business (2020-2025) & (US$ Million)
Table 130. Mahle GmbH Recent Development
Table 131. Schaeffler Company Details
Table 132. Schaeffler Business Overview
Table 133. Schaeffler Automotive Components Product
Table 134. Schaeffler Revenue in Automotive Components Business (2020-2025) & (US$ Million)
Table 135. Schaeffler Recent Development
Table 136. Toyota Boshoku Corp. Company Details
Table 137. Toyota Boshoku Corp. Business Overview
Table 138. Toyota Boshoku Corp. Automotive Components Product
Table 139. Toyota Boshoku Corp. Revenue in Automotive Components Business (2020-2025) & (US$ Million)
Table 140. Toyota Boshoku Corp. Recent Development
Table 141. BorgWarner Inc. Company Details
Table 142. BorgWarner Inc. Business Overview
Table 143. BorgWarner Inc. Automotive Components Product
Table 144. BorgWarner Inc. Revenue in Automotive Components Business (2020-2025) & (US$ Million)
Table 145. BorgWarner Inc. Recent Development
Table 146. Hyundai-WIA Corp. Company Details
Table 147. Hyundai-WIA Corp. Business Overview
Table 148. Hyundai-WIA Corp. Automotive Components Product
Table 149. Hyundai-WIA Corp. Revenue in Automotive Components Business (2020-2025) & (US$ Million)
Table 150. Hyundai-WIA Corp. Recent Development
Table 151. Gestamp Company Details
Table 152. Gestamp Business Overview
Table 153. Gestamp Automotive Components Product
Table 154. Gestamp Revenue in Automotive Components Business (2020-2025) & (US$ Million)
Table 155. Gestamp Recent Development
Table 156. Samvardhana Motherson Company Details
Table 157. Samvardhana Motherson Business Overview
Table 158. Samvardhana Motherson Automotive Components Product
Table 159. Samvardhana Motherson Revenue in Automotive Components Business (2020-2025) & (US$ Million)
Table 160. Samvardhana Motherson Recent Development
Table 161. Hitachi Automotive Company Details
Table 162. Hitachi Automotive Business Overview
Table 163. Hitachi Automotive Automotive Components Product
Table 164. Hitachi Automotive Revenue in Automotive Components Business (2020-2025) & (US$ Million)
Table 165. Hitachi Automotive Recent Development
Table 166. Autoliv Company Details
Table 167. Autoliv Business Overview
Table 168. Autoliv Automotive Components Product
Table 169. Autoliv Revenue in Automotive Components Business (2020-2025) & (US$ Million)
Table 170. Autoliv Recent Development
Table 171. Yanfeng Automotive Company Details
Table 172. Yanfeng Automotive Business Overview
Table 173. Yanfeng Automotive Automotive Components Product
Table 174. Yanfeng Automotive Revenue in Automotive Components Business (2020-2025) & (US$ Million)
Table 175. Yanfeng Automotive Recent Development
Table 176. Toyoda Gosei Company Details
Table 177. Toyoda Gosei Business Overview
Table 178. Toyoda Gosei Automotive Components Product
Table 179. Toyoda Gosei Revenue in Automotive Components Business (2020-2025) & (US$ Million)
Table 180. Toyoda Gosei Recent Development
Table 181. Thyssenkrupp Company Details
Table 182. Thyssenkrupp Business Overview
Table 183. Thyssenkrupp Automotive Components Product
Table 184. Thyssenkrupp Revenue in Automotive Components Business (2020-2025) & (US$ Million)
Table 185. Thyssenkrupp Recent Development
Table 186. JTEKT Corp. Company Details
Table 187. JTEKT Corp. Business Overview
Table 188. JTEKT Corp. Automotive Components Product
Table 189. JTEKT Corp. Revenue in Automotive Components Business (2020-2025) & (US$ Million)
Table 190. JTEKT Corp. Recent Development
Table 191. BASF Company Details
Table 192. BASF Business Overview
Table 193. BASF Automotive Components Product
Table 194. BASF Revenue in Automotive Components Business (2020-2025) & (US$ Million)
Table 195. BASF Recent Development
Table 196. Research Programs/Design for This Report
Table 197. Key Data Information from Secondary Sources
Table 198. Key Data Information from Primary Sources
Table 199. Authors List of This Report
List of Figures
Figure 1. Automotive Components Picture
Figure 2. Global Automotive Components Market Size Comparison by Type (2020-2031) & (US$ Million)
Figure 3. Global Automotive Components Market Share by Type: 2024 VS 2031
Figure 4. Driveline & Powertrain Features
Figure 5. Interiors & Exteriors Features
Figure 6. Electronics Features
Figure 7. Bodies & Chassis Features
Figure 8. Seating Features
Figure 9. Wheel & Tires Features
Figure 10. Others Features
Figure 11. Global Automotive Components Market Size by Application (2020-2031) & (US$ Million)
Figure 12. Global Automotive Components Market Share by Application: 2024 VS 2031
Figure 13. OEMs Case Studies
Figure 14. Aftermarket Case Studies
Figure 15. Automotive Components Report Years Considered
Figure 16. Global Automotive Components Market Size (US$ Million), Year-over-Year: 2020-2031
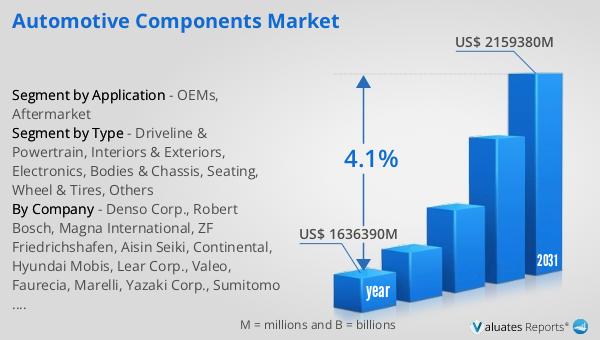
Figure 17. Global Automotive Components Market Size, (US$ Million), 2020 VS 2024 VS 2031
Figure 18. Global Automotive Components Market Share by Region: 2024 VS 2031
Figure 19. Global Automotive Components Market Share by Players in 2024
Figure 20. Global Top Automotive Components Players by Company Type (Tier 1, Tier 2, and Tier 3) & (based on the Revenue in Automotive Components as of 2024)
Figure 21. The Top 10 and 5 Players Market Share by Automotive Components Revenue in 2024
Figure 22. North America Automotive Components Market Size YoY Growth (2020-2031) & (US$ Million)
Figure 23. North America Automotive Components Market Share by Country (2020-2031)
Figure 24. United States Automotive Components Market Size YoY Growth (2020-2031) & (US$ Million)
Figure 25. Canada Automotive Components Market Size YoY Growth (2020-2031) & (US$ Million)
Figure 26. Europe Automotive Components Market Size YoY Growth (2020-2031) & (US$ Million)
Figure 27. Europe Automotive Components Market Share by Country (2020-2031)
Figure 28. Germany Automotive Components Market Size YoY Growth (2020-2031) & (US$ Million)
Figure 29. France Automotive Components Market Size YoY Growth (2020-2031) & (US$ Million)
Figure 30. U.K. Automotive Components Market Size YoY Growth (2020-2031) & (US$ Million)
Figure 31. Italy Automotive Components Market Size YoY Growth (2020-2031) & (US$ Million)
Figure 32. Russia Automotive Components Market Size YoY Growth (2020-2031) & (US$ Million)
Figure 33. Nordic Countries Automotive Components Market Size YoY Growth (2020-2031) & (US$ Million)
Figure 34. Asia-Pacific Automotive Components Market Size YoY Growth (2020-2031) & (US$ Million)
Figure 35. Asia-Pacific Automotive Components Market Share by Region (2020-2031)
Figure 36. China Automotive Components Market Size YoY Growth (2020-2031) & (US$ Million)
Figure 37. Japan Automotive Components Market Size YoY Growth (2020-2031) & (US$ Million)
Figure 38. South Korea Automotive Components Market Size YoY Growth (2020-2031) & (US$ Million)
Figure 39. Southeast Asia Automotive Components Market Size YoY Growth (2020-2031) & (US$ Million)
Figure 40. India Automotive Components Market Size YoY Growth (2020-2031) & (US$ Million)
Figure 41. Australia Automotive Components Market Size YoY Growth (2020-2031) & (US$ Million)
Figure 42. Latin America Automotive Components Market Size YoY Growth (2020-2031) & (US$ Million)
Figure 43. Latin America Automotive Components Market Share by Country (2020-2031)
Figure 44. Mexico Automotive Components Market Size YoY Growth (2020-2031) & (US$ Million)
Figure 45. Brazil Automotive Components Market Size YoY Growth (2020-2031) & (US$ Million)
Figure 46. Middle East & Africa Automotive Components Market Size YoY Growth (2020-2031) & (US$ Million)
Figure 47. Middle East & Africa Automotive Components Market Share by Country (2020-2031)
Figure 48. Turkey Automotive Components Market Size YoY Growth (2020-2031) & (US$ Million)
Figure 49. Saudi Arabia Automotive Components Market Size YoY Growth (2020-2031) & (US$ Million)
Figure 50. UAE Automotive Components Market Size YoY Growth (2020-2031) & (US$ Million)
Figure 51. Denso Corp. Revenue Growth Rate in Automotive Components Business (2020-2025)
Figure 52. Robert Bosch Revenue Growth Rate in Automotive Components Business (2020-2025)
Figure 53. Magna International Revenue Growth Rate in Automotive Components Business (2020-2025)
Figure 54. ZF Friedrichshafen Revenue Growth Rate in Automotive Components Business (2020-2025)
Figure 55. Aisin Seiki Revenue Growth Rate in Automotive Components Business (2020-2025)
Figure 56. Continental Revenue Growth Rate in Automotive Components Business (2020-2025)
Figure 57. Hyundai Mobis Revenue Growth Rate in Automotive Components Business (2020-2025)
Figure 58. Lear Corp. Revenue Growth Rate in Automotive Components Business (2020-2025)
Figure 59. Valeo Revenue Growth Rate in Automotive Components Business (2020-2025)
Figure 60. Faurecia Revenue Growth Rate in Automotive Components Business (2020-2025)
Figure 61. Marelli Revenue Growth Rate in Automotive Components Business (2020-2025)
Figure 62. Yazaki Corp. Revenue Growth Rate in Automotive Components Business (2020-2025)
Figure 63. Sumitomo Electric Revenue Growth Rate in Automotive Components Business (2020-2025)
Figure 64. Aptiv Revenue Growth Rate in Automotive Components Business (2020-2025)
Figure 65. Panasonic Automotive Revenue Growth Rate in Automotive Components Business (2020-2025)
Figure 66. Mahle GmbH Revenue Growth Rate in Automotive Components Business (2020-2025)
Figure 67. Schaeffler Revenue Growth Rate in Automotive Components Business (2020-2025)
Figure 68. Toyota Boshoku Corp. Revenue Growth Rate in Automotive Components Business (2020-2025)
Figure 69. BorgWarner Inc. Revenue Growth Rate in Automotive Components Business (2020-2025)
Figure 70. Hyundai-WIA Corp. Revenue Growth Rate in Automotive Components Business (2020-2025)
Figure 71. Gestamp Revenue Growth Rate in Automotive Components Business (2020-2025)
Figure 72. Samvardhana Motherson Revenue Growth Rate in Automotive Components Business (2020-2025)
Figure 73. Hitachi Automotive Revenue Growth Rate in Automotive Components Business (2020-2025)
Figure 74. Autoliv Revenue Growth Rate in Automotive Components Business (2020-2025)
Figure 75. Yanfeng Automotive Revenue Growth Rate in Automotive Components Business (2020-2025)
Figure 76. Toyoda Gosei Revenue Growth Rate in Automotive Components Business (2020-2025)
Figure 77. Thyssenkrupp Revenue Growth Rate in Automotive Components Business (2020-2025)
Figure 78. JTEKT Corp. Revenue Growth Rate in Automotive Components Business (2020-2025)
Figure 79. BASF Revenue Growth Rate in Automotive Components Business (2020-2025)
Figure 80. Bottom-up and Top-down Approaches for This Report
Figure 81. Data Triangulation
Figure 82. Key Executives Interviewed