List of Tables
Table 1. Major Company of MEMS Microphone
Table 2. Major Company of MEMS Accelerometer
Table 3. Major Company of MEMS Oscillator
Table 4. Major Company of Others
Table 5. Global Micro-Electromechanical Systems (MEMS) Devices Sales by Type 2018 VS 2022 VS 2029 (US$ Million)
Table 6. Global Micro-Electromechanical Systems (MEMS) Devices Sales by Type (2018-2023) & (K Units)
Table 7. Global Micro-Electromechanical Systems (MEMS) Devices Sales Market Share in Volume by Type (2018-2023)
Table 8. Global Micro-Electromechanical Systems (MEMS) Devices Sales by Type (2018-2023) & (US& Million)
Table 9. Global Micro-Electromechanical Systems (MEMS) Devices Market Share in Value by Type (2018-2023)
Table 10. Global Micro-Electromechanical Systems (MEMS) Devices Price by Type (2018-2023) & (USD/Unit)
Table 11. Global Micro-Electromechanical Systems (MEMS) Devices Sales by Type (2024-2029) & (K Units)
Table 12. Global Micro-Electromechanical Systems (MEMS) Devices Sales Market Share in Volume by Type (2024-2029)
Table 13. Global Micro-Electromechanical Systems (MEMS) Devices Sales by Type (2024-2029) & (US$ Million)
Table 14. Global Micro-Electromechanical Systems (MEMS) Devices Sales Market Share in Value by Type (2024-2029)
Table 15. Global Micro-Electromechanical Systems (MEMS) Devices Price by Type (2024-2029) & (USD/Unit)
Table 16. North America Micro-Electromechanical Systems (MEMS) Devices Sales by Type (2018-2023) & (K Units)
Table 17. North America Micro-Electromechanical Systems (MEMS) Devices Sales by Type (2018-2023) & (US$ Million)
Table 18. Europe Micro-Electromechanical Systems (MEMS) Devices Sales (K Units) by Type (2018-2023)
Table 19. Europe Micro-Electromechanical Systems (MEMS) Devices Sales by Type (2018-2023) & (US$ Million)
Table 20. Asia-Pacific Micro-Electromechanical Systems (MEMS) Devices Sales (K Units) by Type (2018-2023)
Table 21. Asia-Pacific Micro-Electromechanical Systems (MEMS) Devices Sales by Type (2018-2023) & (US$ Million)
Table 22. Latin America Micro-Electromechanical Systems (MEMS) Devices Sales (K Units) by Type (2018-2023)
Table 23. Latin America Micro-Electromechanical Systems (MEMS) Devices Sales by Type (2018-2023) & (US$ Million)
Table 24. Middle East and Africa Micro-Electromechanical Systems (MEMS) Devices Sales (K Units) by Type (2018-2023)
Table 25. Middle East and Africa Micro-Electromechanical Systems (MEMS) Devices Sales by Type (2018-2023) & (US$ Million)
Table 26. Global Micro-Electromechanical Systems (MEMS) Devices Sales by Company (2018-2023) & (K Units)
Table 27. Global Micro-Electromechanical Systems (MEMS) Devices Sales Share by Company (2018-2023)
Table 28. Global Micro-Electromechanical Systems (MEMS) Devices Revenue by Company (2018-2023) & (US$ Million)
Table 29. Global Micro-Electromechanical Systems (MEMS) Devices Revenue Share by Company (2018-2023)
Table 30. Global Market Micro-Electromechanical Systems (MEMS) Devices Price by Company (2018-2023) & (USD/Unit)
Table 31. Global Micro-Electromechanical Systems (MEMS) Devices Top Manufacturers Manufacturing Base Distribution and Sales Area
Table 32. Global Micro-Electromechanical Systems (MEMS) Devices Manufacturers Market Concentration Ratio (CR5 and HHI)
Table 33. Global Top Manufacturers Market Share by Company Type (Tier 1, Tier 2 and Tier 3) & (based on the Revenue in Micro-Electromechanical Systems (MEMS) Devices as of 2022)
Table 34. Date of Key Manufacturers Enter into Micro-Electromechanical Systems (MEMS) Devices Market
Table 35. Key Manufacturers Micro-Electromechanical Systems (MEMS) Devices Product Type
Table 36. Mergers & Acquisitions, Expansion Plans
Table 37. Global Micro-Electromechanical Systems (MEMS) Devices Market Size Comparison by Region (US$ Million): 2018 VS 2022 VS 2029
Table 38. Global Micro-Electromechanical Systems (MEMS) Devices Sales by Region (2018-2023) & (K Units)
Table 39. Global Micro-Electromechanical Systems (MEMS) Devices Sales Market Share in Volume by Region (2018-2023)
Table 40. Global Micro-Electromechanical Systems (MEMS) Devices Sales by Region (2018-2023) & (US$ Million)
Table 41. Global Micro-Electromechanical Systems (MEMS) Devices Sales Market Share in Value by Region (2018-2023)
Table 42. Global Micro-Electromechanical Systems (MEMS) Devices Sales (K Units), Revenue (US$ Million), Price (USD/Unit) and Gross Margin (2018-2023)
Table 43. Global Micro-Electromechanical Systems (MEMS) Devices Sales by Region (2024-2029) & (K Units)
Table 44. Global Micro-Electromechanical Systems (MEMS) Devices Sales Market Share in Volume by Region (2024-2029)
Table 45. Global Micro-Electromechanical Systems (MEMS) Devices Sales by Region (2024-2029) & (US$ Million)
Table 46. Global Micro-Electromechanical Systems (MEMS) Devices Sales Market Share in Value by Region (2024-2029)
Table 47. Global Micro-Electromechanical Systems (MEMS) Devices Sales (K Units), Revenue (US$ Million), Price (USD/Unit) and Gross Margin (2024-2029)
Table 48. Global Micro-Electromechanical Systems (MEMS) Devices Sales by Application: 2018 VS 2022 VS 2029 (US$ Million)
Table 49. Global Micro-Electromechanical Systems (MEMS) Devices Sales by Application (2018-2023) & (K Units)
Table 50. Global Micro-Electromechanical Systems (MEMS) Devices Sales Market Share in Volume by Application (2018-2023)
Table 51. Global Micro-Electromechanical Systems (MEMS) Devices Sales by Application (2018-2023) & (US$ Million)
Table 52. Global Micro-Electromechanical Systems (MEMS) Devices Sales Market Share in Value by Application (2018-2023)
Table 53. Global Micro-Electromechanical Systems (MEMS) Devices Price by Application (2018-2023) & (USD/Unit)
Table 54. Global Micro-Electromechanical Systems (MEMS) Devices Sales by Application (2024-2029) & (K Units)
Table 55. Global Micro-Electromechanical Systems (MEMS) Devices Sales Market Share in Volume by Application (2024-2029)
Table 56. Global Micro-Electromechanical Systems (MEMS) Devices Sales by Application (2024-2029) & (US$ Million)
Table 57. Global Micro-Electromechanical Systems (MEMS) Devices Sales Market Share in Value by Application (2024-2029)
Table 58. Global Micro-Electromechanical Systems (MEMS) Devices Price by Application (2024-2029) & (USD/Unit)
Table 59. North America Micro-Electromechanical Systems (MEMS) Devices Sales by Application (2018-2023) (K Units)
Table 60. North America Micro-Electromechanical Systems (MEMS) Devices Sales by Application (2018-2023) & (US$ Million)
Table 61. Europe Micro-Electromechanical Systems (MEMS) Devices Sales by Application (2018-2023) (K Units)
Table 62. Europe Micro-Electromechanical Systems (MEMS) Devices Sales by Application (2018-2023) & (US$ Million)
Table 63. Asia-Pacific Micro-Electromechanical Systems (MEMS) Devices Sales by Application (2018-2023) (K Units)
Table 64. Asia-Pacific Micro-Electromechanical Systems (MEMS) Devices Sales by Application (2018-2023) & (US$ Million)
Table 65. Latin America Micro-Electromechanical Systems (MEMS) Devices Sales by Application (2018-2023) (K Units)
Table 66. Latin America Micro-Electromechanical Systems (MEMS) Devices Sales by Application (2018-2023) & (US$ Million)
Table 67. Middle East and Africa Micro-Electromechanical Systems (MEMS) Devices Sales by Application (2018-2023) (K Units)
Table 68. Middle East and Africa Micro-Electromechanical Systems (MEMS) Devices Sales by Application (2018-2023) & (US$ Million)
Table 69. North America Micro-Electromechanical Systems (MEMS) Devices Sales by Country (2018-2023) & (K Units)
Table 70. North America Micro-Electromechanical Systems (MEMS) Devices Sales Market Share in Volume by Country (2018-2023)
Table 71. North America Micro-Electromechanical Systems (MEMS) Devices Sales by Country (2018-2023) & (US$ Million)
Table 72. North America Micro-Electromechanical Systems (MEMS) Devices Sales Market Share in Value by Country (2018-2023)
Table 73. North America Micro-Electromechanical Systems (MEMS) Devices Sales by Country (2024-2029) & (K Units)
Table 74. North America Micro-Electromechanical Systems (MEMS) Devices Sales Market Share in Volume by Country (2024-2029)
Table 75. North America Micro-Electromechanical Systems (MEMS) Devices Sales by Country (2024-2029) & (US$ Million)
Table 76. North America Micro-Electromechanical Systems (MEMS) Devices Sales Market Share in Value by Country (2024-2029)
Table 77. Europe Micro-Electromechanical Systems (MEMS) Devices Sales by Country (2018-2023) & (K Units)
Table 78. Europe Micro-Electromechanical Systems (MEMS) Devices Sales Market Share in Volume by Country (2018-2023)
Table 79. Europe Micro-Electromechanical Systems (MEMS) Devices Sales by Country (2018-2023) & (US$ Million)
Table 80. Europe Micro-Electromechanical Systems (MEMS) Devices Sales Market Share in Value by Country (2018-2023)
Table 81. Europe Micro-Electromechanical Systems (MEMS) Devices Sales by Country (2024-2029) & (K Units)
Table 82. Europe Micro-Electromechanical Systems (MEMS) Devices Sales Market Share in Volume by Country (2024-2029)
Table 83. Europe Micro-Electromechanical Systems (MEMS) Devices Sales by Country (2024-2029) & (US$ Million)
Table 84. Europe Micro-Electromechanical Systems (MEMS) Devices Sales Market Share in Value by Country (2024-2029)
Table 85. Asia-Pacific Micro-Electromechanical Systems (MEMS) Devices Sales by Region (2018-2023) & (K Units)
Table 86. Asia-Pacific Micro-Electromechanical Systems (MEMS) Devices Sales Market Share in Volume by Region (2018-2023)
Table 87. Asia-Pacific Micro-Electromechanical Systems (MEMS) Devices Sales by Region (2018-2023) & (US$ Million)
Table 88. Asia-Pacific Micro-Electromechanical Systems (MEMS) Devices Sales Market Share in Value by Region (2018-2023)
Table 89. Asia-Pacific Micro-Electromechanical Systems (MEMS) Devices Sales by Region (2024-2029) & (K Units)
Table 90. Asia-Pacific Micro-Electromechanical Systems (MEMS) Devices Sales Market Share in Volume by Region (2024-2029)
Table 91. Asia-Pacific Micro-Electromechanical Systems (MEMS) Devices Sales by Region (2024-2029) & (US$ Million)
Table 92. Asia-Pacific Micro-Electromechanical Systems (MEMS) Devices Sales Market Share in Value by Region (2024-2029)
Table 93. Latin America Micro-Electromechanical Systems (MEMS) Devices Sales by Country (2018-2023) & (K Units)
Table 94. Latin America Micro-Electromechanical Systems (MEMS) Devices Sales Market Share in Volume by Country (2018-2023)
Table 95. Latin America Micro-Electromechanical Systems (MEMS) Devices Sales by Country (2018-2023) & (US$ Million)
Table 96. Latin America Micro-Electromechanical Systems (MEMS) Devices Sales Market Share in Value by Country (2018-2023)
Table 97. Latin America Micro-Electromechanical Systems (MEMS) Devices Sales by Country (2024-2029) & (K Units)
Table 98. Latin America Micro-Electromechanical Systems (MEMS) Devices Sales Market Share in Volume by Country (2024-2029)
Table 99. Latin America Micro-Electromechanical Systems (MEMS) Devices Sales by Country (2024-2029) & (US$ Million)
Table 100. Latin America Micro-Electromechanical Systems (MEMS) Devices Sales Market Share in Value by Country (2024-2029)
Table 101. Middle East and Africa Micro-Electromechanical Systems (MEMS) Devices Sales by Country (2018-2023) & (K Units)
Table 102. Middle East and Africa Micro-Electromechanical Systems (MEMS) Devices Sales Market Share in Volume by Country (2018-2023)
Table 103. Middle East and Africa Micro-Electromechanical Systems (MEMS) Devices Sales by Country (2018-2023) & (US$ Million)
Table 104. Middle East and Africa Micro-Electromechanical Systems (MEMS) Devices Sales Market Share in Value by Country (2018-2023)
Table 105. Middle East and Africa Micro-Electromechanical Systems (MEMS) Devices Sales by Country (2024-2029) & (K Units)
Table 106. Middle East and Africa Micro-Electromechanical Systems (MEMS) Devices Sales Market Share in Volume by Country (2024-2029)
Table 107. Middle East and Africa Micro-Electromechanical Systems (MEMS) Devices Sales by Country (2024-2029) & (US$ Million)
Table 108. Middle East and Africa Micro-Electromechanical Systems (MEMS) Devices Sales Market Share in Value by Country (2024-2029)
Table 109. Knowles Company Information
Table 110. Knowles Introduction and Business Overview
Table 111. Knowles Micro-Electromechanical Systems (MEMS) Devices Sales (K Units), Revenue (Million USD), Price (USD/Unit) and Gross Margin (2018-2023)
Table 112. Knowles Micro-Electromechanical Systems (MEMS) Devices Product
Table 113. Knowles Recent Development
Table 114. ST Microelectronics Company Information
Table 115. ST Microelectronics Introduction and Business Overview
Table 116. ST Microelectronics Micro-Electromechanical Systems (MEMS) Devices Sales (K Units), Revenue (Million USD), Price (USD/Unit) and Gross Margin (2018-2023)
Table 117. ST Microelectronics Micro-Electromechanical Systems (MEMS) Devices Product
Table 118. ST Microelectronics Recent Development
Table 119. BSE Company Information
Table 120. BSE Introduction and Business Overview
Table 121. BSE Micro-Electromechanical Systems (MEMS) Devices Sales (K Units), Revenue (Million USD), Price (USD/Unit) and Gross Margin (2018-2023)
Table 122. BSE Micro-Electromechanical Systems (MEMS) Devices Product
Table 123. BSE Recent Development
Table 124. TDK Company Information
Table 125. TDK Introduction and Business Overview
Table 126. TDK Micro-Electromechanical Systems (MEMS) Devices Sales (K Units), Revenue (Million USD), Price (USD/Unit) and Gross Margin (2018-2023)
Table 127. TDK Micro-Electromechanical Systems (MEMS) Devices Product
Table 128. TDK Recent Development
Table 129. Cirrus Logic Company Information
Table 130. Cirrus Logic Introduction and Business Overview
Table 131. Cirrus Logic Micro-Electromechanical Systems (MEMS) Devices Sales (K Units), Revenue (Million USD), Price (USD/Unit) and Gross Margin (2018-2023)
Table 132. Cirrus Logic Micro-Electromechanical Systems (MEMS) Devices Product
Table 133. Cirrus Logic Recent Development
Table 134. Hosiden Company Information
Table 135. Hosiden Introduction and Business Overview
Table 136. Hosiden Micro-Electromechanical Systems (MEMS) Devices Sales (K Units), Revenue (Million USD), Price (USD/Unit) and Gross Margin (2018-2023)
Table 137. Hosiden Micro-Electromechanical Systems (MEMS) Devices Product
Table 138. Hosiden Recent Development
Table 139. Bosch (Akustica) Company Information
Table 140. Bosch (Akustica) Introduction and Business Overview
Table 141. Bosch (Akustica) Micro-Electromechanical Systems (MEMS) Devices Sales (K Units), Revenue (Million USD), Price (USD/Unit) and Gross Margin (2018-2023)
Table 142. Bosch (Akustica) Micro-Electromechanical Systems (MEMS) Devices Product
Table 143. Bosch (Akustica) Recent Development
Table 144. Sanico Electronics Company Information
Table 145. Sanico Electronics Introduction and Business Overview
Table 146. Sanico Electronics Micro-Electromechanical Systems (MEMS) Devices Sales (K Units), Revenue (Million USD), Price (USD/Unit) and Gross Margin (2018-2023)
Table 147. Sanico Electronics Micro-Electromechanical Systems (MEMS) Devices Product
Table 148. Sanico Electronics Recent Development
Table 149. 3S Company Information
Table 150. 3S Introduction and Business Overview
Table 151. 3S Micro-Electromechanical Systems (MEMS) Devices Sales (K Units), Revenue (Million USD), Price (USD/Unit) and Gross Margin (2018-2023)
Table 152. 3S Micro-Electromechanical Systems (MEMS) Devices Product
Table 153. 3S Recent Development
Table 154. Goertek Company Information
Table 155. Goertek Introduction and Business Overview
Table 156. Goertek Micro-Electromechanical Systems (MEMS) Devices Sales (K Units), Revenue (Million USD), Price (USD/Unit) and Gross Margin (2018-2023)
Table 157. Goertek Micro-Electromechanical Systems (MEMS) Devices Product
Table 158. Goertek Recent Development
Table 159. AAC Company Information
Table 160. AAC Introduction and Business Overview
Table 161. AAC Micro-Electromechanical Systems (MEMS) Devices Sales (K Units), Revenue (Million USD), Price (USD/Unit) and Gross Margin (2018-2023)
Table 162. AAC Micro-Electromechanical Systems (MEMS) Devices Product
Table 163. AAC Recent Development
Table 164. MEMSensing Company Information
Table 165. MEMSensing Introduction and Business Overview
Table 166. MEMSensing Micro-Electromechanical Systems (MEMS) Devices Sales (K Units), Revenue (Million USD), Price (USD/Unit) and Gross Margin (2018-2023)
Table 167. MEMSensing Micro-Electromechanical Systems (MEMS) Devices Product
Table 168. MEMSensing Recent Development
Table 169. NeoMEMS Company Information
Table 170. NeoMEMS Introduction and Business Overview
Table 171. NeoMEMS Micro-Electromechanical Systems (MEMS) Devices Sales (K Units), Revenue (Million USD), Price (USD/Unit) and Gross Margin (2018-2023)
Table 172. NeoMEMS Micro-Electromechanical Systems (MEMS) Devices Product
Table 173. NeoMEMS Recent Development
Table 174. Gettop Company Information
Table 175. Gettop Introduction and Business Overview
Table 176. Gettop Micro-Electromechanical Systems (MEMS) Devices Sales (K Units), Revenue (Million USD), Price (USD/Unit) and Gross Margin (2018-2023)
Table 177. Gettop Micro-Electromechanical Systems (MEMS) Devices Product
Table 178. Gettop Recent Development
Table 179. InvenSense Company Information
Table 180. InvenSense Introduction and Business Overview
Table 181. InvenSense Micro-Electromechanical Systems (MEMS) Devices Sales (K Units), Revenue (Million USD), Price (USD/Unit) and Gross Margin (2018-2023)
Table 182. InvenSense Micro-Electromechanical Systems (MEMS) Devices Product
Table 183. InvenSense Recent Development
Table 184. NXP (Freescale) Company Information
Table 185. NXP (Freescale) Introduction and Business Overview
Table 186. NXP (Freescale) Micro-Electromechanical Systems (MEMS) Devices Sales (K Units), Revenue (Million USD), Price (USD/Unit) and Gross Margin (2018-2023)
Table 187. NXP (Freescale) Micro-Electromechanical Systems (MEMS) Devices Product
Table 188. NXP (Freescale) Recent Development
Table 189. Murata (VTI) Company Information
Table 190. Murata (VTI) Introduction and Business Overview
Table 191. Murata (VTI) Micro-Electromechanical Systems (MEMS) Devices Sales (K Units), Revenue (Million USD), Price (USD/Unit) and Gross Margin (2018-2023)
Table 192. Murata (VTI) Micro-Electromechanical Systems (MEMS) Devices Product
Table 193. Murata (VTI) Recent Development
Table 194. ADI Company Information
Table 195. ADI Introduction and Business Overview
Table 196. ADI Micro-Electromechanical Systems (MEMS) Devices Sales (K Units), Revenue (Million USD), Price (USD/Unit) and Gross Margin (2018-2023)
Table 197. ADI Micro-Electromechanical Systems (MEMS) Devices Product
Table 198. ADI Recent Development
Table 199. ROHM (Kionix) Company Information
Table 200. ROHM (Kionix) Introduction and Business Overview
Table 201. ROHM (Kionix) Micro-Electromechanical Systems (MEMS) Devices Sales (K Units), Revenue (Million USD), Price (USD/Unit) and Gross Margin (2018-2023)
Table 202. ROHM (Kionix) Micro-Electromechanical Systems (MEMS) Devices Product
Table 203. ROHM (Kionix) Recent Development
Table 204. Mcube Company Information
Table 205. Mcube Introduction and Business Overview
Table 206. Mcube Micro-Electromechanical Systems (MEMS) Devices Sales (K Units), Revenue (Million USD), Price (USD/Unit) and Gross Margin (2018-2023)
Table 207. Mcube Micro-Electromechanical Systems (MEMS) Devices Product
Table 208. Mcube Recent Development
Table 209. Memsic Company Information
Table 210. Memsic Introduction and Business Overview
Table 211. Memsic Micro-Electromechanical Systems (MEMS) Devices Sales (K Units), Revenue (Million USD), Price (USD/Unit) and Gross Margin (2018-2023)
Table 212. Memsic Micro-Electromechanical Systems (MEMS) Devices Product
Table 213. Memsic Recent Development
Table 214. MiraMEMS Company Information
Table 215. MiraMEMS Introduction and Business Overview
Table 216. MiraMEMS Micro-Electromechanical Systems (MEMS) Devices Sales (K Units), Revenue (Million USD), Price (USD/Unit) and Gross Margin (2018-2023)
Table 217. MiraMEMS Micro-Electromechanical Systems (MEMS) Devices Product
Table 218. MiraMEMS Recent Development
Table 219. QST Company Information
Table 220. QST Introduction and Business Overview
Table 221. QST Micro-Electromechanical Systems (MEMS) Devices Sales (K Units), Revenue (Million USD), Price (USD/Unit) and Gross Margin (2018-2023)
Table 222. QST Micro-Electromechanical Systems (MEMS) Devices Product
Table 223. QST Recent Development
Table 224. Microchip Company Information
Table 225. Microchip Introduction and Business Overview
Table 226. Microchip Micro-Electromechanical Systems (MEMS) Devices Sales (K Units), Revenue (Million USD), Price (USD/Unit) and Gross Margin (2018-2023)
Table 227. Microchip Micro-Electromechanical Systems (MEMS) Devices Product
Table 228. Microchip Recent Development
Table 229. SiTime(Mega) Introduction and Business Overview
Table 230. SiTime(Mega) Micro-Electromechanical Systems (MEMS) Devices Sales (K Units), Revenue (Million USD), Price (USD/Unit) and Gross Margin (2018-2023)
Table 231. SiTime(Mega) Micro-Electromechanical Systems (MEMS) Devices Product
Table 232. SiTime(Mega) Recent Development
Table 233. SiTime(Mega) Company Information
Table 234. Kyocera Corporation Company Information
Table 235. Kyocera Corporation Introduction and Business Overview
Table 236. Kyocera Corporation Micro-Electromechanical Systems (MEMS) Devices Sales (K Units), Revenue (Million USD), Price (USD/Unit) and Gross Margin (2018-2023)
Table 237. Kyocera Corporation Micro-Electromechanical Systems (MEMS) Devices Product
Table 238. Kyocera Corporation Recent Development
Table 239. ON Semiconductor Company Information
Table 240. ON Semiconductor Introduction and Business Overview
Table 241. ON Semiconductor Micro-Electromechanical Systems (MEMS) Devices Sales (K Units), Revenue (Million USD), Price (USD/Unit) and Gross Margin (2018-2023)
Table 242. ON Semiconductor Micro-Electromechanical Systems (MEMS) Devices Product
Table 243. ON Semiconductor Recent Development
Table 244. Key Raw Materials Lists
Table 245. Raw Materials Key Suppliers Lists
Table 246. Micro-Electromechanical Systems (MEMS) Devices Market Trends
Table 247. Micro-Electromechanical Systems (MEMS) Devices Market Drivers
Table 248. Micro-Electromechanical Systems (MEMS) Devices Market Challenges
Table 249. Micro-Electromechanical Systems (MEMS) Devices Market Restraints
Table 250. Micro-Electromechanical Systems (MEMS) Devices Distributors List
Table 251. Micro-Electromechanical Systems (MEMS) Devices Downstream Customers
Table 252. Research Programs/Design for This Report
Table 253. Key Data Information from Secondary Sources
Table 254. Key Data Information from Primary Sources
List of Figures
Figure 1. Micro-Electromechanical Systems (MEMS) Devices Product Picture
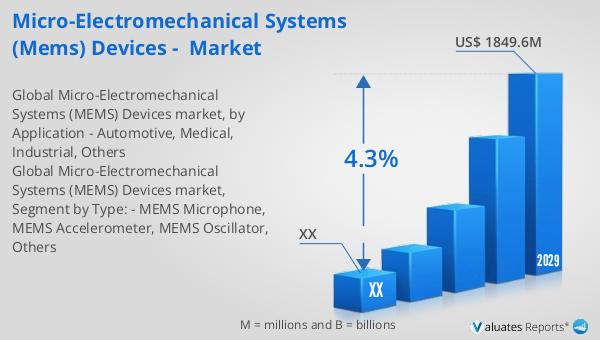
Figure 2. Global Micro-Electromechanical Systems (MEMS) Devices Market Size, 2018 VS 2022 VS 2029 (US$ Million)
Figure 3. Global Micro-Electromechanical Systems (MEMS) Devices Market Size Status and Outlook (2018-2029) & (US$ Million)
Figure 4. Global Micro-Electromechanical Systems (MEMS) Devices Sales Status and Outlook (2018-2029) & (K Units)
Figure 5. Product Picture of MEMS Microphone
Figure 6. Global MEMS Microphone Sales YoY Growth (2018-2029) & (K Units)
Figure 7. Product Picture of MEMS Accelerometer
Figure 8. Global MEMS Accelerometer Sales YoY Growth (2018-2029) & (K Units)
Figure 9. Product Picture of MEMS Oscillator
Figure 10. Global MEMS Oscillator Sales YoY Growth (2018-2029) & (K Units)
Figure 11. Product Picture of Others
Figure 12. Global Others Sales YoY Growth (2018-2029) & (K Units)
Figure 13. Global Micro-Electromechanical Systems (MEMS) Devices Sales by Type (2018-2029) & (US$ Million)
Figure 14. Global Micro-Electromechanical Systems (MEMS) Devices Sales Market Share by Type in 2022 & 2029
Figure 15. North America Micro-Electromechanical Systems (MEMS) Devices Sales Market Share in Volume by Type in 2022
Figure 16. North America Micro-Electromechanical Systems (MEMS) Devices Sales Market Share in Value by Type in 2022
Figure 17. Europe Micro-Electromechanical Systems (MEMS) Devices Sales Market Share in Volume by Type in 2022
Figure 18. Europe Micro-Electromechanical Systems (MEMS) Devices Sales Market Share in Value by Type in 2022
Figure 19. Asia-Pacific Micro-Electromechanical Systems (MEMS) Devices Sales Market Share in Volume by Type in 2022
Figure 20. Asia-Pacific Micro-Electromechanical Systems (MEMS) Devices Sales Market Share in Value by Type in 2022
Figure 21. Latin America Micro-Electromechanical Systems (MEMS) Devices Sales Market Share in Volume by Type in 2022
Figure 22. Latin America Micro-Electromechanical Systems (MEMS) Devices Sales Market Share in Value by Type in 2022
Figure 23. Middle East and Africa Micro-Electromechanical Systems (MEMS) Devices Sales Market Share in Volume by Type in 2022
Figure 24. Middle East and Africa Micro-Electromechanical Systems (MEMS) Devices Sales Market Share in Value by Type in 2022
Figure 25. The 5 and 10 Largest Manufacturers in the World: Market Share by Micro-Electromechanical Systems (MEMS) Devices Sales in 2022
Figure 26. The 5 and 10 Largest Manufacturers in the World: Market Share by Micro-Electromechanical Systems (MEMS) Devices Revenue in 2022
Figure 27. Micro-Electromechanical Systems (MEMS) Devices Market Share by Company Type (Tier 1, Tier 2, and Tier 3): 2018 VS 2022
Figure 28. Product Picture of Automotive
Figure 29. Global Automotive Sales YoY Growth (2018-2029) & (K Units)
Figure 30. Product Picture of Medical
Figure 31. Global Medical Sales YoY Growth (2018-2029) & (K Units)
Figure 32. Product Picture of Industrial
Figure 33. Global Industrial Sales YoY Growth (2018-2029) & (K Units)
Figure 34. Product Picture of Others
Figure 35. Global Others Sales YoY Growth (2018-2029) & (K Units)
Figure 36. Global Micro-Electromechanical Systems (MEMS) Devices Sales by Application (2018-2029) & (US$ Million)
Figure 37. Global Micro-Electromechanical Systems (MEMS) Devices Sales Market Share by Application in 2022 & 2029
Figure 38. North America Micro-Electromechanical Systems (MEMS) Devices Sales Market Share in Volume by Application in 2022
Figure 39. North America Micro-Electromechanical Systems (MEMS) Devices Sales Market Share in Value by Application in 2022
Figure 40. Europe Micro-Electromechanical Systems (MEMS) Devices Sales Market Share in Volume by Application in 2022
Figure 41. Europe Micro-Electromechanical Systems (MEMS) Devices Sales Market Share in Value by Application in 2022
Figure 42. Asia-Pacific Micro-Electromechanical Systems (MEMS) Devices Sales Market Share in Volume by Application in 2022
Figure 43. Asia-Pacific Micro-Electromechanical Systems (MEMS) Devices Sales Market Share in Value by Application in 2022
Figure 44. Latin America Micro-Electromechanical Systems (MEMS) Devices Sales Market Share in Volume by Application in 2022
Figure 45. Latin America Micro-Electromechanical Systems (MEMS) Devices Sales Market Share in Value by Application in 2022
Figure 46. Middle East and Africa Micro-Electromechanical Systems (MEMS) Devices Sales Market Share in Value by Application in 2022
Figure 47. Key Raw Materials Price
Figure 48. Micro-Electromechanical Systems (MEMS) Devices Manufacturing Cost Structure
Figure 49. Micro-Electromechanical Systems (MEMS) Devices Industrial Chain Analysis
Figure 50. Channels of Distribution
Figure 51. Distributors Profiles
Figure 52. Bottom-up and Top-down Approaches for This Report
Figure 53. Data Triangulation
Figure 54. Key Executives Interviewed