List of Tables
Table 1. Global Sand Paper Market Value by Abrasive Grain (US$ Million), 2025 vs 2032
Table 2. Global Sand Paper Market Value by Grit (FEPA P-grade) (US$ Million), 2025 vs 2032
Table 3. Global Sand Paper Market Value by Water Resistance (US$ Million), 2025 vs 2032
Table 4. Global Sand Paper Market Value by Application (US$ Million), 2025 vs 2032
Table 5. Global Sand Paper Market Competitive Situation by Manufacturers in 2025
Table 6. Global Sand Paper Sales (Million sqm) of Key Manufacturers (2021–2026)
Table 7. Global Sand Paper Sales Market Share by Manufacturers (2021–2026)
Table 8. Global Sand Paper Revenue (US$ Million) by Manufacturers (2021–2026)
Table 9. Global Sand Paper Revenue Share by Manufacturers (2021–2026)
Table 10. Global Market Sand Paper Average Price (USD/K sqm) of Key Manufacturers (2021–2026)
Table 11. Global Key Players of Sand Paper, Industry Ranking, 2023 vs 2024 vs 2025
Table 12. Global Key Manufacturers of Sand Paper, Manufacturing Sites and Headquarters
Table 13. Global Key Manufacturers of Sand Paper, Product Types and Applications
Table 14. Global Key Manufacturers of Sand Paper, Date of Entry into the Industry
Table 15. Global Manufacturers Market Concentration Ratio (CR5 and HHI)
Table 16. Global Sand Paper Companies by Tier (Tier 1, Tier 2, Tier 3), based on Sand Paper Revenue, 2025
Table 17. Manufacturers Mergers & Acquisitions, Expansion Plans
Table 18. Global Sand Paper Market Size by Region (US$ Million): 2021 vs 2025 vs 2032
Table 19. Global Sand Paper Sales by Region (Million sqm), 2021–2026
Table 20. Global Sand Paper Sales Market Share by Region (2021–2026)
Table 21. Global Sand Paper Sales by Region (Million sqm), 2027–2032
Table 22. Global Sand Paper Sales Market Share by Region (2027–2032)
Table 23. Global Sand Paper Revenue by Region (US$ Million), 2021–2026
Table 24. Global Sand Paper Revenue Market Share by Region (2021–2026)
Table 25. Global Sand Paper Revenue by Region (US$ Million), 2027–2032
Table 26. Global Sand Paper Revenue Market Share by Region (2027–2032)
Table 27. North America Sand Paper Revenue by Country: 2021 vs 2025 vs 2032 (US$ Million)
Table 28. North America Sand Paper Sales by Country (Million sqm), 2021–2026
Table 29. North America Sand Paper Sales by Country (Million sqm), 2027–2032
Table 30. North America Sand Paper Revenue by Country (US$ Million), 2021–2026
Table 31. North America Sand Paper Revenue by Country (US$ Million), 2027–2032
Table 32. Europe Sand Paper Revenue by Country: 2021 vs 2025 vs 2032 (US$ Million)
Table 33. Europe Sand Paper Sales by Country (Million sqm), 2021–2026
Table 34. Europe Sand Paper Sales by Country (Million sqm), 2027–2032
Table 35. Europe Sand Paper Revenue by Country (US$ Million), 2021–2026
Table 36. Europe Sand Paper Revenue by Country (US$ Million), 2027–2032
Table 37. Asia Pacific Sand Paper Revenue by Region: 2021 vs 2025 vs 2032 (US$ Million)
Table 38. Asia Pacific Sand Paper Sales by Region (Million sqm), 2021–2026
Table 39. Asia Pacific Sand Paper Sales by Region (Million sqm), 2027–2032
Table 40. Asia Pacific Sand Paper Revenue by Region (US$ Million), 2021–2026
Table 41. Asia Pacific Sand Paper Revenue by Region (US$ Million), 2027–2032
Table 42. Latin America Sand Paper Revenue by Country: 2021 vs 2025 vs 2032 (US$ Million)
Table 43. Latin America Sand Paper Sales by Country (Million sqm), 2021–2026
Table 44. Latin America Sand Paper Sales by Country (Million sqm), 2027–2032
Table 45. Latin America Sand Paper Revenue by Country (US$ Million), 2021–2026
Table 46. Latin America Sand Paper Revenue by Country (US$ Million), 2027–2032
Table 47. Middle East and Africa Sand Paper Revenue by Country: 2021 vs 2025 vs 2032 (US$ Million)
Table 48. Middle East and Africa Sand Paper Sales by Country (Million sqm), 2021–2026
Table 49. Middle East and Africa Sand Paper Sales by Country (Million sqm), 2027–2032
Table 50. Middle East and Africa Sand Paper Revenue by Country (US$ Million), 2021–2026
Table 51. Middle East and Africa Sand Paper Revenue by Country (US$ Million), 2027–2032
Table 52. Global Sand Paper Sales (Million sqm) by Abrasive Grain (2021–2026)
Table 53. Global Sand Paper Sales (Million sqm) by Abrasive Grain (2027–2032)
Table 54. Global Sand Paper Sales Market Share by Abrasive Grain (2021–2026)
Table 55. Global Sand Paper Sales Market Share by Abrasive Grain (2027–2032)
Table 56. Global Sand Paper Revenue (US$ Million) by Abrasive Grain (2021–2026)
Table 57. Global Sand Paper Revenue (US$ Million) by Abrasive Grain (2027–2032)
Table 58. Global Sand Paper Revenue Market Share by Abrasive Grain (2021–2026)
Table 59. Global Sand Paper Revenue Market Share by Abrasive Grain (2027–2032)
Table 60. Global Sand Paper Price (USD/K sqm) by Abrasive Grain (2021–2026)
Table 61. Global Sand Paper Price (USD/K sqm) by Abrasive Grain (2027–2032)
Table 62. Global Sand Paper Sales (Million sqm) by Application (2021–2026)
Table 63. Global Sand Paper Sales (Million sqm) by Application (2027–2032)
Table 64. Global Sand Paper Sales Market Share by Application (2021–2026)
Table 65. Global Sand Paper Sales Market Share by Application (2027–2032)
Table 66. Global Sand Paper Revenue (US$ Million) by Application (2021–2026)
Table 67. Global Sand Paper Revenue (US$ Million) by Application (2027–2032)
Table 68. Global Sand Paper Revenue Market Share by Application (2021–2026)
Table 69. Global Sand Paper Revenue Market Share by Application (2027–2032)
Table 70. Global Sand Paper Price (USD/K sqm) by Application (2021–2026)
Table 71. Global Sand Paper Price (USD/K sqm) by Application (2027–2032)
Table 72. Saint-Gobain Abrasives Company Information
Table 73. Saint-Gobain Abrasives Description and Business Overview
Table 74. Saint-Gobain Abrasives Sand Paper Sales (Million sqm), Revenue (US$ Million), Price (USD/K sqm), and Gross Margin (2021–2026)
Table 75. Saint-Gobain Abrasives Sand Paper Product
Table 76. Saint-Gobain Abrasives Recent Developments/Updates
Table 77. 3M Abrasives Company Information
Table 78. 3M Abrasives Description and Business Overview
Table 79. 3M Abrasives Sand Paper Sales (Million sqm), Revenue (US$ Million), Price (USD/K sqm), and Gross Margin (2021–2026)
Table 80. 3M Abrasives Sand Paper Product
Table 81. 3M Abrasives Recent Developments/Updates
Table 82. Bosch Power Tools (sia Abrasives) Company Information
Table 83. Bosch Power Tools (sia Abrasives) Description and Business Overview
Table 84. Bosch Power Tools (sia Abrasives) Sand Paper Sales (Million sqm), Revenue (US$ Million), Price (USD/K sqm), and Gross Margin (2021–2026)
Table 85. Bosch Power Tools (sia Abrasives) Sand Paper Product
Table 86. Bosch Power Tools (sia Abrasives) Recent Developments/Updates
Table 87. KLINGSPOR Company Information
Table 88. KLINGSPOR Description and Business Overview
Table 89. KLINGSPOR Sand Paper Sales (Million sqm), Revenue (US$ Million), Price (USD/K sqm), and Gross Margin (2021–2026)
Table 90. KLINGSPOR Sand Paper Product
Table 91. KLINGSPOR Recent Developments/Updates
Table 92. Mirka (KWH Group) Company Information
Table 93. Mirka (KWH Group) Description and Business Overview
Table 94. Mirka (KWH Group) Sand Paper Sales (Million sqm), Revenue (US$ Million), Price (USD/K sqm), and Gross Margin (2021–2026)
Table 95. Mirka (KWH Group) Sand Paper Product
Table 96. Mirka (KWH Group) Recent Developments/Updates
Table 97. Hermes Schleifmittel Company Information
Table 98. Hermes Schleifmittel Description and Business Overview
Table 99. Hermes Schleifmittel Sand Paper Sales (Million sqm), Revenue (US$ Million), Price (USD/K sqm), and Gross Margin (2021–2026)
Table 100. Hermes Schleifmittel Sand Paper Product
Table 101. Hermes Schleifmittel Recent Developments/Updates
Table 102. Tyrolit (Radiac) Company Information
Table 103. Tyrolit (Radiac) Description and Business Overview
Table 104. Tyrolit (Radiac) Sand Paper Sales (Million sqm), Revenue (US$ Million), Price (USD/K sqm), and Gross Margin (2021–2026)
Table 105. Tyrolit (Radiac) Sand Paper Product
Table 106. Tyrolit (Radiac) Recent Developments/Updates
Table 107. PFERD Company Information
Table 108. PFERD Description and Business Overview
Table 109. PFERD Sand Paper Sales (Million sqm), Revenue (US$ Million), Price (USD/K sqm), and Gross Margin (2021–2026)
Table 110. PFERD Sand Paper Product
Table 111. PFERD Recent Developments/Updates
Table 112. Rhodius Company Information
Table 113. Rhodius Description and Business Overview
Table 114. Rhodius Sand Paper Sales (Million sqm), Revenue (US$ Million), Price (USD/K sqm), and Gross Margin (2021–2026)
Table 115. Rhodius Sand Paper Product
Table 116. Rhodius Recent Developments/Updates
Table 117. Mipox Company Information
Table 118. Mipox Description and Business Overview
Table 119. Mipox Sand Paper Sales (Million sqm), Revenue (US$ Million), Price (USD/K sqm), and Gross Margin (2021–2026)
Table 120. Mipox Sand Paper Product
Table 121. Mipox Recent Developments/Updates
Table 122. Deerfos Company Information
Table 123. Deerfos Description and Business Overview
Table 124. Deerfos Sand Paper Sales (Million sqm), Revenue (US$ Million), Price (USD/K sqm), and Gross Margin (2021–2026)
Table 125. Deerfos Sand Paper Product
Table 126. Deerfos Recent Developments/Updates
Table 127. INDASA Company Information
Table 128. INDASA Description and Business Overview
Table 129. INDASA Sand Paper Sales (Million sqm), Revenue (US$ Million), Price (USD/K sqm), and Gross Margin (2021–2026)
Table 130. INDASA Sand Paper Product
Table 131. INDASA Recent Developments/Updates
Table 132. Smirdex Company Information
Table 133. Smirdex Description and Business Overview
Table 134. Smirdex Sand Paper Sales (Million sqm), Revenue (US$ Million), Price (USD/K sqm), and Gross Margin (2021–2026)
Table 135. Smirdex Sand Paper Product
Table 136. Smirdex Recent Developments/Updates
Table 137. SAIT Abrasivi Company Information
Table 138. SAIT Abrasivi Description and Business Overview
Table 139. SAIT Abrasivi Sand Paper Sales (Million sqm), Revenue (US$ Million), Price (USD/K sqm), and Gross Margin (2021–2026)
Table 140. SAIT Abrasivi Sand Paper Product
Table 141. SAIT Abrasivi Recent Developments/Updates
Table 142. CUMI (Carborundum Universal) Company Information
Table 143. CUMI (Carborundum Universal) Description and Business Overview
Table 144. CUMI (Carborundum Universal) Sand Paper Sales (Million sqm), Revenue (US$ Million), Price (USD/K sqm), and Gross Margin (2021–2026)
Table 145. CUMI (Carborundum Universal) Sand Paper Product
Table 146. CUMI (Carborundum Universal) Recent Developments/Updates
Table 147. Sun Abrasives (Sunmight) Company Information
Table 148. Sun Abrasives (Sunmight) Description and Business Overview
Table 149. Sun Abrasives (Sunmight) Sand Paper Sales (Million sqm), Revenue (US$ Million), Price (USD/K sqm), and Gross Margin (2021–2026)
Table 150. Sun Abrasives (Sunmight) Sand Paper Product
Table 151. Sun Abrasives (Sunmight) Recent Developments/Updates
Table 152. Ekamant Company Information
Table 153. Ekamant Description and Business Overview
Table 154. Ekamant Sand Paper Sales (Million sqm), Revenue (US$ Million), Price (USD/K sqm), and Gross Margin (2021–2026)
Table 155. Ekamant Sand Paper Product
Table 156. Ekamant Recent Developments/Updates
Table 157. VSM AG Company Information
Table 158. VSM AG Description and Business Overview
Table 159. VSM AG Sand Paper Sales (Million sqm), Revenue (US$ Million), Price (USD/K sqm), and Gross Margin (2021–2026)
Table 160. VSM AG Sand Paper Product
Table 161. VSM AG Recent Developments/Updates
Table 162. Starcke (Matador) Company Information
Table 163. Starcke (Matador) Description and Business Overview
Table 164. Starcke (Matador) Sand Paper Sales (Million sqm), Revenue (US$ Million), Price (USD/K sqm), and Gross Margin (2021–2026)
Table 165. Starcke (Matador) Sand Paper Product
Table 166. Starcke (Matador) Recent Developments/Updates
Table 167. Karbosan Company Information
Table 168. Karbosan Description and Business Overview
Table 169. Karbosan Sand Paper Sales (Million sqm), Revenue (US$ Million), Price (USD/K sqm), and Gross Margin (2021–2026)
Table 170. Karbosan Sand Paper Product
Table 171. Karbosan Recent Developments/Updates
Table 172. Fuji Star Abrasives Company Information
Table 173. Fuji Star Abrasives Description and Business Overview
Table 174. Fuji Star Abrasives Sand Paper Sales (Million sqm), Revenue (US$ Million), Price (USD/K sqm), and Gross Margin (2021–2026)
Table 175. Fuji Star Abrasives Sand Paper Product
Table 176. Fuji Star Abrasives Recent Developments/Updates
Table 177. White Dove Abrasives Company Information
Table 178. White Dove Abrasives Description and Business Overview
Table 179. White Dove Abrasives Sand Paper Sales (Million sqm), Revenue (US$ Million), Price (USD/K sqm), and Gross Margin (2021–2026)
Table 180. White Dove Abrasives Sand Paper Product
Table 181. White Dove Abrasives Recent Developments/Updates
Table 182. Shandong Luxin Four Sand Taishan Company Information
Table 183. Shandong Luxin Four Sand Taishan Description and Business Overview
Table 184. Shandong Luxin Four Sand Taishan Sand Paper Sales (Million sqm), Revenue (US$ Million), Price (USD/K sqm), and Gross Margin (2021–2026)
Table 185. Shandong Luxin Four Sand Taishan Sand Paper Product
Table 186. Shandong Luxin Four Sand Taishan Recent Developments/Updates
Table 187. Jiangsu Fengmang Group Company Information
Table 188. Jiangsu Fengmang Group Description and Business Overview
Table 189. Jiangsu Fengmang Group Sand Paper Sales (Million sqm), Revenue (US$ Million), Price (USD/K sqm), and Gross Margin (2021–2026)
Table 190. Jiangsu Fengmang Group Sand Paper Product
Table 191. Jiangsu Fengmang Group Recent Developments/Updates
Table 192. Hubei Yuli Abrasive Belts Group Company Information
Table 193. Hubei Yuli Abrasive Belts Group Description and Business Overview
Table 194. Hubei Yuli Abrasive Belts Group Sand Paper Sales (Million sqm), Revenue (US$ Million), Price (USD/K sqm), and Gross Margin (2021–2026)
Table 195. Hubei Yuli Abrasive Belts Group Sand Paper Product
Table 196. Hubei Yuli Abrasive Belts Group Recent Developments/Updates
Table 197. Jiangsu Sanling Abrasive Company Information
Table 198. Jiangsu Sanling Abrasive Description and Business Overview
Table 199. Jiangsu Sanling Abrasive Sand Paper Sales (Million sqm), Revenue (US$ Million), Price (USD/K sqm), and Gross Margin (2021–2026)
Table 200. Jiangsu Sanling Abrasive Sand Paper Product
Table 201. Jiangsu Sanling Abrasive Recent Developments/Updates
Table 202. Changzhou Kingcattle Abrasives Company Information
Table 203. Changzhou Kingcattle Abrasives Description and Business Overview
Table 204. Changzhou Kingcattle Abrasives Sand Paper Sales (Million sqm), Revenue (US$ Million), Price (USD/K sqm), and Gross Margin (2021–2026)
Table 205. Changzhou Kingcattle Abrasives Sand Paper Product
Table 206. Changzhou Kingcattle Abrasives Recent Developments/Updates
Table 207. Dongguan Golden Sun Abrasives Company Information
Table 208. Dongguan Golden Sun Abrasives Description and Business Overview
Table 209. Dongguan Golden Sun Abrasives Sand Paper Sales (Million sqm), Revenue (US$ Million), Price (USD/K sqm), and Gross Margin (2021–2026)
Table 210. Dongguan Golden Sun Abrasives Sand Paper Product
Table 211. Dongguan Golden Sun Abrasives Recent Developments/Updates
Table 212. Key Raw Materials Lists
Table 213. Raw Materials Key Suppliers Lists
Table 214. Sand Paper Distributors List
Table 215. Sand Paper Customers List
Table 216. Sand Paper Market Trends
Table 217. Sand Paper Market Drivers
Table 218. Sand Paper Market Challenges
Table 219. Sand Paper Market Restraints
Table 220. Research Programs/Design for This Report
Table 221. Key Data Information from Secondary Sources
Table 222. Key Data Information from Primary Sources
Table 223. Authors List of This Report
List of Figures
Figure 1. Product Picture of Sand Paper
Figure 2. Global Sand Paper Market Value by Abrasive Grain (US$ Million), 2021–2032
Figure 3. Global Sand Paper Market Share by Abrasive Grain: 2025 & 2032
Figure 4. Aluminum Oxide Product Picture
Figure 5. Silicon Carbide Product Picture
Figure 6. Ceramic Alumina Product Picture
Figure 7. Garnet Product Picture
Figure 8. Others Product Picture
Figure 9. Global Sand Paper Market Value by Grit (FEPA P-grade) (US$ Million), 2021–2032
Figure 10. Global Sand Paper Market Share by Grit (FEPA P-grade): 2025 vs 2032
Figure 11. Macrogrit P12–P80 Product Picture
Figure 12. Macrogrit P100–P220 Product Picture
Figure 13. Microgrit P240–P800 Product Picture
Figure 14. Microgrit P1000–P2500+ Product Picture
Figure 15. Global Sand Paper Market Value by Water Resistance (US$ Million), 2021–2032
Figure 16. Global Sand Paper Market Share by Water Resistance: 2025 vs 2032
Figure 17. Dry-only paper Product Picture
Figure 18. Wet & Dry (latex waterproof paper) Product Picture
Figure 19. Specialty waterproof (oil/coolant compatible) Product Picture
Figure 20. Global Sand Paper Market Value by Application (US$ Million), 2021–2032
Figure 21. Global Sand Paper Market Share by Application: 2025 & 2032
Figure 22. Automotive refinishing & collision repair
Figure 23. Woodworking & furniture
Figure 24. Metal fabrication & MRO
Figure 25. Construction & DIY
Figure 26. Composites & plastics finishing
Figure 27. Others
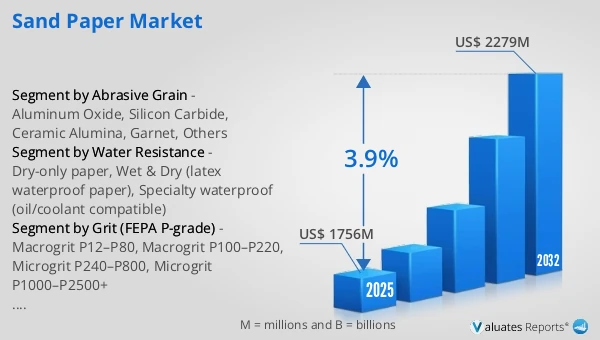
Figure 28. Global Sand Paper Revenue, (US$ Million), 2021 vs 2025 vs 2032
Figure 29. Global Sand Paper Market Size (US$ Million), 2021–2032
Figure 30. Global Sand Paper Sales (Million sqm), 2021–2032
Figure 31. Global Sand Paper Average Price (USD/K sqm), 2021–2032
Figure 32. Sand Paper Report Years Considered
Figure 33. Sand Paper Sales Share by Manufacturers in 2025
Figure 34. Global Sand Paper Revenue Share by Manufacturers in 2025
Figure 35. Top 5 and Top 10 Global Sand Paper Players: Market Share by Revenue in Sand Paper in 2025
Figure 36. Sand Paper Market Share by Company Type (Tier 1, Tier 2, and Tier 3): 2021 vs 2025
Figure 37. Global Sand Paper Market Size by Region (US$ Million): 2021 vs 2025 vs 2032
Figure 38. North America Sand Paper Sales Market Share by Country (2021–2032)
Figure 39. North America Sand Paper Revenue Market Share by Country (2021–2032)
Figure 40. U.S. Sand Paper Revenue Growth Rate (US$ Million), 2021–2032
Figure 41. Canada Sand Paper Revenue Growth Rate (US$ Million), 2021–2032
Figure 42. Europe Sand Paper Sales Market Share by Country (2021–2032)
Figure 43. Europe Sand Paper Revenue Market Share by Country (2021–2032)
Figure 44. Germany Sand Paper Revenue Growth Rate (US$ Million), 2021–2032
Figure 45. France Sand Paper Revenue Growth Rate (US$ Million), 2021–2032
Figure 46. U.K. Sand Paper Revenue Growth Rate (US$ Million), 2021–2032
Figure 47. Italy Sand Paper Revenue Growth Rate (US$ Million), 2021–2032
Figure 48. Russia Sand Paper Revenue Growth Rate (US$ Million), 2021–2032
Figure 49. Asia Pacific Sand Paper Sales Market Share by Region (2021–2032)
Figure 50. Asia Pacific Sand Paper Revenue Market Share by Region (2021–2032)
Figure 51. China Sand Paper Revenue Growth Rate (US$ Million), 2021–2032
Figure 52. Japan Sand Paper Revenue Growth Rate (US$ Million), 2021–2032
Figure 53. South Korea Sand Paper Revenue Growth Rate (US$ Million), 2021–2032
Figure 54. India Sand Paper Revenue Growth Rate (US$ Million), 2021–2032
Figure 55. Australia Sand Paper Revenue Growth Rate (US$ Million), 2021–2032
Figure 56. Taiwan Sand Paper Revenue Growth Rate (US$ Million), 2021–2032
Figure 57. Indonesia Sand Paper Revenue Growth Rate (US$ Million), 2021–2032
Figure 58. Thailand Sand Paper Revenue Growth Rate (US$ Million), 2021–2032
Figure 59. Malaysia Sand Paper Revenue Growth Rate (US$ Million), 2021–2032
Figure 60. Philippines Sand Paper Revenue Growth Rate (US$ Million), 2021–2032
Figure 61. Latin America Sand Paper Sales Market Share by Country (2021–2032)
Figure 62. Latin America Sand Paper Revenue Market Share by Country (2021–2032)
Figure 63. Mexico Sand Paper Revenue Growth Rate (US$ Million), 2021–2032
Figure 64. Brazil Sand Paper Revenue Growth Rate (US$ Million), 2021–2032
Figure 65. Argentina Sand Paper Revenue Growth Rate (US$ Million), 2021–2032
Figure 66. Middle East and Africa Sand Paper Sales Market Share by Country (2021–2032)
Figure 67. Middle East and Africa Sand Paper Revenue Market Share by Country (2021–2032)
Figure 68. Turkey Sand Paper Revenue Growth Rate (US$ Million), 2021–2032
Figure 69. Saudi Arabia Sand Paper Revenue Growth Rate (US$ Million), 2021–2032
Figure 70. U.A.E Sand Paper Revenue Growth Rate (US$ Million), 2021–2032
Figure 71. Global Sales Market Share of Sand Paper by Abrasive Grain (2021–2032)
Figure 72. Global Revenue Market Share of Sand Paper by Abrasive Grain (2021–2032)
Figure 73. Global Sand Paper Price (USD/K sqm) by Abrasive Grain (2021–2032)
Figure 74. Global Sales Market Share of Sand Paper by Application (2021–2032)
Figure 75. Global Revenue Market Share of Sand Paper by Application (2021–2032)
Figure 76. Global Sand Paper Price (USD/K sqm) by Application (2021–2032)
Figure 77. Sand Paper Value Chain
Figure 78. Channels of Distribution (Direct Vs Distribution)
Figure 79. Bottom-up and Top-down Approaches for This Report
Figure 80. Data Triangulation
Figure 81. Key Executives Interviewed