MRO Consumables Market Size
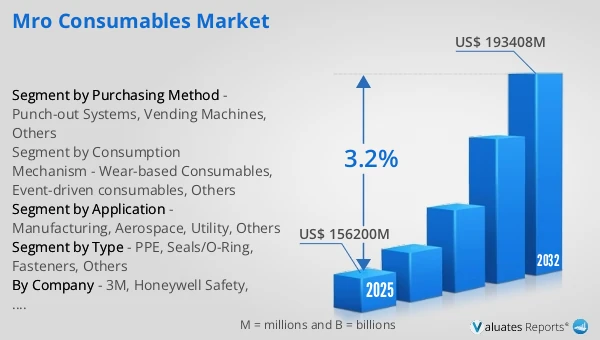
The global MRO Consumables market was valued at US$ 156200 million in 2025 and is anticipated to reach US$ 193408 million by 2032, at a CAGR of 3.2% from 2026 to 2032.
MRO Consumables Market
MRO consumables are industrial supplies that are regularly used up during the maintenance, repair, and daily operation of equipment and facilities but do not become part of the final product. They typically include lubricants, seals, fasteners, adhesives, cleaning chemicals, and personal protective equipment (PPE). Although individual items are low in unit value, MRO consumables are critical to operational continuity, as insufficient supply can lead to unplanned downtime. Their demand is characterized by high replacement frequency, standardized specifications, and strong emphasis on reliability, consistency, and stable supply rather than price alone.
Demand is primarily driven by rising reliability and compliance pressures in asset-intensive operations: organizations aim to reduce unplanned downtime by strengthening preventive maintenance and standardizing shopfloor practices, which sustains recurring consumption of lubricants, filtration items, fastening/sealing aids, repair/welding consumables, abrasives/cutting consumables, and PPE. In parallel, tighter EHS and audit requirements make safety and contamination-control consumables more non-discretionary, while digitized asset management and indirect procurement processes turn fragmented, high-turnover consumable buying into a more routine and scaled activity.
This report delivers a comprehensive overview of the global MRO Consumables market, with both quantitative and qualitative analyses, to help readers develop growth strategies, assess the competitive landscape, evaluate their position in the current market, and make informed business decisions regarding MRO Consumables. The MRO Consumables market size, estimates, and forecasts are provided in terms of revenue (US$ millions), with 2025 as the base year and historical and forecast data for 2021–2032.
The report segments the global MRO Consumables market comprehensively. Regional market sizes by Type, by Application, by Purchasing Method, and by player are also provided. For deeper insight, the report profiles the competitive landscape, key competitors, and their respective market rankings, and discusses technological trends and new product developments.
This report will assist MRO Consumables manufacturers, new entrants, and companies across the industry value chain with information on revenues, sales volume, and average prices for the overall market and its sub-segments, by company, by Type, by Application, and by region.
Market Segmentation
Scope of MRO Consumables Market Report
| Report Metric |
Details |
| Report Name |
MRO Consumables Market |
| Accounted market size in 2025 |
US$ 156200 million |
| Forecasted market size in 2032 |
US$ 193408 million |
| CAGR |
3.2% |
| Base Year |
2025 |
| Forecasted years |
2026 - 2032 |
| Segment by Type |
- PPE
- Seals/O-Ring
- Fasteners
- Others
|
| Segment by Purchasing Method |
- Punch-out Systems
- Vending Machines
- Others
|
| Segment by Consumption Mechanism |
- Wear-based Consumables
- Event-driven consumables
- Others
|
| Segment by Application |
- Manufacturing
- Aerospace
- Utility
- Others
|
| By Region |
- North America (United States, Canada)
- Europe (Germany, France, UK, Italy, Russia) Rest of Europe
- Nordic Countries
- Asia-Pacific (China, Japan, South Korea)
- Southeast Asia (India, Australia)
- Rest of Asia
- Latin America (Mexico, Brazil)
- Rest of Latin America
- Middle East & Africa (Turkey, Saudi Arabia, UAE, Rest of MEA)
|
| By Company |
3M, Honeywell Safety, MSA Safety, Ansell, DuPont, Dow, Henkel(Loctite), CRC Industries, SINOPHARM, Würth Group, Bossard Group, ITW (Illinois Tool Works), Stanley Engineered Fastening, Nifco, Freudenberg Sealing Technologies, Parker Hannifin, Trelleborg, NOK Corporation, ElringKlinger, Garlock |
| Forecast units |
USD million in value |
| Report coverage |
Revenue and volume forecast, company share, competitive landscape, growth factors and trends |
Chapter Outline
- Chapter 1: Defines the scope of the report and presents an executive summary of market segments (by Type, by Application, by Purchasing Method, etc.), including the size of each segment and its future growth potential. It offers a high-level view of the current market and its likely evolution in the short, medium, and long term.
- Chapter 2: Summarizes global and regional market size and outlines market dynamics and recent developments, including key drivers, restraints, challenges and risks for industry participants, and relevant policy analysis.
- Chapter 3: Provides a detailed view of the competitive landscape for MRO Consumables companies, covering revenue share, development plans, and mergers and acquisitions.
- Chapter 4: Analyzes segments by Type, detailing the size and growth potential of each segment to help readers identify blue-ocean opportunities.
- Chapter 5: Analyzes segments by Application, detailing the size and growth potential of each downstream segment to help readers identify blue-ocean opportunities.
- Chapter 6–10: Regional deep dives (North America, Europe, Asia Pacific, Latin America, Middle East & Africa) broken down by country. Each chapter quantifies market size and growth potential by region and key countries, and outlines market development, outlook, addressable space, and capacity.
- Chapter 11: Profiles key players, presenting essential information on leading companies, including product/ service offerings, revenue, gross margin, product introductions/portfolios, recent developments, etc.
- Chapter 12: Key findings and conclusions of the report.
FAQ for this report
How fast is MRO Consumables Market growing?
Ans: The MRO Consumables Market witnessing a CAGR of 3.2% during the forecast period 2026-2032.
What is the MRO Consumables Market size in 2032?
Ans: The MRO Consumables Market size in 2032 will be US$ 193408 million.
Who are the main players in the MRO Consumables Market report?
Ans: The main players in the MRO Consumables Market are 3M, Honeywell Safety, MSA Safety, Ansell, DuPont, Dow, Henkel(Loctite), CRC Industries, SINOPHARM, Würth Group, Bossard Group, ITW (Illinois Tool Works), Stanley Engineered Fastening, Nifco, Freudenberg Sealing Technologies, Parker Hannifin, Trelleborg, NOK Corporation, ElringKlinger, Garlock
What are the Application segmentation covered in the MRO Consumables Market report?
Ans: The Applications covered in the MRO Consumables Market report are Manufacturing, Aerospace, Utility, Others
What are the Type segmentation covered in the MRO Consumables Market report?
Ans: The Types covered in the MRO Consumables Market report are PPE, Seals/O-Ring, Fasteners, Others

