1 Market Overview
1.1 Nozzle Ionizers Product Introduction
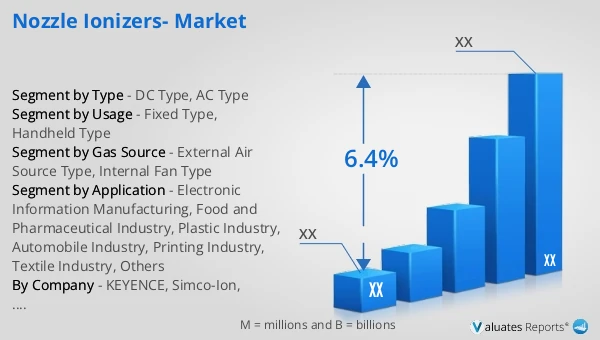
1.2 Global Nozzle Ionizers Market Size Forecast
1.2.1 Global Nozzle Ionizers Sales Value (2021–2032)
1.2.2 Global Nozzle Ionizers Sales Volume (2021–2032)
1.2.3 Global Nozzle Ionizers Sales Price (2021–2032)
1.3 Nozzle Ionizers Market Trends & Drivers
1.3.1 Nozzle Ionizers Industry Trends
1.3.2 Nozzle Ionizers Market Drivers & Opportunities
1.3.3 Nozzle Ionizers Market Challenges
1.3.4 Nozzle Ionizers Market Restraints
1.3.5 Impact of U.S. Tariffs
1.4 Assumptions and Limitations
1.5 Study Objectives
1.6 Years Considered
2 Competitive Analysis by Company
2.1 Global Nozzle Ionizers Players Revenue Ranking (2025)
2.2 Global Nozzle Ionizers Revenue by Company (2021–2026)
2.3 Global Nozzle Ionizers Sales Volume Ranking of Players (2025)
2.4 Global Nozzle Ionizers Sales Volume by Company (2021–2026)
2.5 Global Nozzle Ionizers Average Price by Company (2021–2026)
2.6 Key Manufacturers Nozzle Ionizers Manufacturing Base and Headquarters
2.7 Key Manufacturers Nozzle Ionizers Product Offerings
2.8 Key Manufacturers Start of Mass Production of Nozzle Ionizers
2.9 Nozzle Ionizers Market Competitive Analysis
2.9.1 Nozzle Ionizers Market Concentration Rate (2021–2026)
2.9.2 Global 5 and 10 Largest Manufacturers by Nozzle Ionizers Revenue in 2025
2.9.3 Global Companies by Tier (Tier 1, Tier 2, Tier 3), based on Nozzle Ionizers revenue, 2025
2.10 Mergers & Acquisitions and Expansion
3 Segmentation Nozzle Ionizers Market Classification
3.1 Introduction by Type
3.1.1 DC Type
3.1.2 AC Type
3.1.3 Global Nozzle Ionizers Sales Value by Type
3.1.3.1 Global Nozzle Ionizers Sales Value by Type (2021 vs 2025 vs 2032)
3.1.3.2 Global Nozzle Ionizers Sales Value, by Type (2021–2032)
3.1.3.3 Global Nozzle Ionizers Sales Value, by Type (%), 2021–2032
3.1.4 Global Nozzle Ionizers Sales Volume by Type
3.1.4.1 Global Nozzle Ionizers Sales Volume by Type (2021 vs 2025 vs 2032)
3.1.4.2 Global Nozzle Ionizers Sales Volume, by Type (2021–2032)
3.1.4.3 Global Nozzle Ionizers Sales Volume, by Type (%), 2021–2032
3.1.5 Global Nozzle Ionizers Average Price by Type (2021–2032)
3.2 Introduction by Gas Source
3.2.1 External Air Source Type
3.2.2 Internal Fan Type
3.2.3 Global Nozzle Ionizers Sales Value by Gas Source
3.2.3.1 Global Nozzle Ionizers Sales Value by Gas Source (2021 vs 2025 vs 2032)
3.2.3.2 Global Nozzle Ionizers Sales Value, by Gas Source (2021–2032)
3.2.3.3 Global Nozzle Ionizers Sales Value, by Gas Source (%), 2021–2032
3.2.4 Global Nozzle Ionizers Sales Volume by Gas Source
3.2.4.1 Global Nozzle Ionizers Sales Volume by Gas Source (2021 vs 2025 vs 2032)
3.2.4.2 Global Nozzle Ionizers Sales Volume, by Gas Source (2021–2032)
3.2.4.3 Global Nozzle Ionizers Sales Volume, by Gas Source (%), 2021–2032
3.2.5 Global Nozzle Ionizers Average Price by Gas Source (2021–2032)
3.3 Introduction by Usage
3.3.1 Fixed Type
3.3.2 Handheld Type
3.3.3 Global Nozzle Ionizers Sales Value by Usage
3.3.3.1 Global Nozzle Ionizers Sales Value by Usage (2021 vs 2025 vs 2032)
3.3.3.2 Global Nozzle Ionizers Sales Value, by Usage (2021–2032)
3.3.3.3 Global Nozzle Ionizers Sales Value, by Usage (%), 2021–2032
3.3.4 Global Nozzle Ionizers Sales Volume by Usage
3.3.4.1 Global Nozzle Ionizers Sales Volume by Usage (2021 vs 2025 vs 2032)
3.3.4.2 Global Nozzle Ionizers Sales Volume, by Usage (2021–2032)
3.3.4.3 Global Nozzle Ionizers Sales Volume, by Usage (%), 2021–2032
3.3.5 Global Nozzle Ionizers Average Price by Usage (2021–2032)
4 Segmentation by Application
4.1 Introduction by Application
4.1.1 Electronic Information Manufacturing
4.1.2 Food and Pharmaceutical Industry
4.1.3 Plastic Industry
4.1.4 Automobile Industry
4.1.5 Printing Industry
4.1.6 Textile Industry
4.1.7 Others
4.2 Global Nozzle Ionizers Sales Value by Application
4.2.1 Global Nozzle Ionizers Sales Value by Application (2021 vs 2025 vs 2032)
4.2.2 Global Nozzle Ionizers Sales Value, by Application (2021–2032)
4.2.3 Global Nozzle Ionizers Sales Value, by Application (%), 2021–2032
4.3 Global Nozzle Ionizers Sales Volume by Application
4.3.1 Global Nozzle Ionizers Sales Volume by Application (2021 vs 2025 vs 2032)
4.3.2 Global Nozzle Ionizers Sales Volume, by Application (2021–2032)
4.3.3 Global Nozzle Ionizers Sales Volume, by Application (%), 2021–2032
4.4 Global Nozzle Ionizers Average Price by Application (2021–2032)
5 Segmentation by Region
5.1 Global Nozzle Ionizers Sales Value by Region
5.1.1 Global Nozzle Ionizers Sales Value by Region: 2021 vs 2025 vs 2032
5.1.2 Global Nozzle Ionizers Sales Value by Region (2021–2026)
5.1.3 Global Nozzle Ionizers Sales Value by Region (2027–2032)
5.1.4 Global Nozzle Ionizers Sales Value by Region (%), 2021–2032
5.2 Global Nozzle Ionizers Sales Volume by Region
5.2.1 Global Nozzle Ionizers Sales Volume by Region: 2021 vs 2025 vs 2032
5.2.2 Global Nozzle Ionizers Sales Volume by Region (2021–2026)
5.2.3 Global Nozzle Ionizers Sales Volume by Region (2027–2032)
5.2.4 Global Nozzle Ionizers Sales Volume by Region (%), 2021–2032
5.3 Global Nozzle Ionizers Average Price by Region (2021–2032)
5.4 North America
5.4.1 North America Nozzle Ionizers Sales Value, 2021–2032
5.4.2 North America Nozzle Ionizers Sales Value by Country (%), 2025 vs 2032
5.5 Europe
5.5.1 Europe Nozzle Ionizers Sales Value, 2021–2032
5.5.2 Europe Nozzle Ionizers Sales Value by Country (%), 2025 vs 2032
5.6 Asia Pacific
5.6.1 Asia Pacific Nozzle Ionizers Sales Value, 2021–2032
5.6.2 Asia Pacific Nozzle Ionizers Sales Value by Region (%), 2025 vs 2032
5.7 South America
5.7.1 South America Nozzle Ionizers Sales Value, 2021–2032
5.7.2 South America Nozzle Ionizers Sales Value by Country (%), 2025 vs 2032
5.8 Middle East & Africa
5.8.1 Middle East & Africa Nozzle Ionizers Sales Value, 2021–2032
5.8.2 Middle East & Africa Nozzle Ionizers Sales Value by Country (%), 2025 vs 2032
6 Segmentation by Key Countries/Regions
6.1 Key Countries/Regions Nozzle Ionizers Sales Value Growth Trends, 2021 vs 2025 vs 2032
6.2 Key Countries/Regions Nozzle Ionizers Sales Value and Sales Volume
6.2.1 Key Countries/Regions Nozzle Ionizers Sales Value, 2021–2032
6.2.2 Key Countries/Regions Nozzle Ionizers Sales Volume, 2021–2032
6.3 United States
6.3.1 United States Nozzle Ionizers Sales Value, 2021–2032
6.3.2 United States Nozzle Ionizers Sales Value by Type (%), 2025 vs 2032
6.3.3 United States Nozzle Ionizers Sales Value by Application, 2025 vs 2032
6.4 Europe
6.4.1 Europe Nozzle Ionizers Sales Value, 2021–2032
6.4.2 Europe Nozzle Ionizers Sales Value by Type (%), 2025 vs 2032
6.4.3 Europe Nozzle Ionizers Sales Value by Application, 2025 vs 2032
6.5 China
6.5.1 China Nozzle Ionizers Sales Value, 2021–2032
6.5.2 China Nozzle Ionizers Sales Value by Type (%), 2025 vs 2032
6.5.3 China Nozzle Ionizers Sales Value by Application, 2025 vs 2032
6.6 Japan
6.6.1 Japan Nozzle Ionizers Sales Value, 2021–2032
6.6.2 Japan Nozzle Ionizers Sales Value by Type (%), 2025 vs 2032
6.6.3 Japan Nozzle Ionizers Sales Value by Application, 2025 vs 2032
6.7 South Korea
6.7.1 South Korea Nozzle Ionizers Sales Value, 2021–2032
6.7.2 South Korea Nozzle Ionizers Sales Value by Type (%), 2025 vs 2032
6.7.3 South Korea Nozzle Ionizers Sales Value by Application, 2025 vs 2032
6.8 Southeast Asia
6.8.1 Southeast Asia Nozzle Ionizers Sales Value, 2021–2032
6.8.2 Southeast Asia Nozzle Ionizers Sales Value by Type (%), 2025 vs 2032
6.8.3 Southeast Asia Nozzle Ionizers Sales Value by Application, 2025 vs 2032
6.9 India
6.9.1 India Nozzle Ionizers Sales Value, 2021–2032
6.9.2 India Nozzle Ionizers Sales Value by Type (%), 2025 vs 2032
6.9.3 India Nozzle Ionizers Sales Value by Application, 2025 vs 2032
7 Company Profiles
7.1 KEYENCE
7.1.1 KEYENCE Company Information
7.1.2 KEYENCE Introduction and Business Overview
7.1.3 KEYENCE Nozzle Ionizers Sales, Revenue, Price and Gross Margin (2021–2026)
7.1.4 KEYENCE Nozzle Ionizers Product Offerings
7.1.5 KEYENCE Recent Developments
7.2 Simco-Ion
7.2.1 Simco-Ion Company Information
7.2.2 Simco-Ion Introduction and Business Overview
7.2.3 Simco-Ion Nozzle Ionizers Sales, Revenue, Price and Gross Margin (2021–2026)
7.2.4 Simco-Ion Nozzle Ionizers Product Offerings
7.2.5 Simco-Ion Recent Developments
7.3 SMC
7.3.1 SMC Company Information
7.3.2 SMC Introduction and Business Overview
7.3.3 SMC Nozzle Ionizers Sales, Revenue, Price and Gross Margin (2021–2026)
7.3.4 SMC Nozzle Ionizers Product Offerings
7.3.5 SMC Recent Developments
7.4 Panasonic
7.4.1 Panasonic Company Information
7.4.2 Panasonic Introduction and Business Overview
7.4.3 Panasonic Nozzle Ionizers Sales, Revenue, Price and Gross Margin (2021–2026)
7.4.4 Panasonic Nozzle Ionizers Product Offerings
7.4.5 Panasonic Recent Developments
7.5 OMRON
7.5.1 OMRON Company Information
7.5.2 OMRON Introduction and Business Overview
7.5.3 OMRON Nozzle Ionizers Sales, Revenue, Price and Gross Margin (2021–2026)
7.5.4 OMRON Nozzle Ionizers Product Offerings
7.5.5 OMRON Recent Developments
7.6 Shishido Electrostatic
7.6.1 Shishido Electrostatic Company Information
7.6.2 Shishido Electrostatic Introduction and Business Overview
7.6.3 Shishido Electrostatic Nozzle Ionizers Sales, Revenue, Price and Gross Margin (2021–2026)
7.6.4 Shishido Electrostatic Nozzle Ionizers Product Offerings
7.6.5 Shishido Electrostatic Recent Developments
7.7 Sunje HI-TEK CO.,Ltd
7.7.1 Sunje HI-TEK CO.,Ltd Company Information
7.7.2 Sunje HI-TEK CO.,Ltd Introduction and Business Overview
7.7.3 Sunje HI-TEK CO.,Ltd Nozzle Ionizers Sales, Revenue, Price and Gross Margin (2021–2026)
7.7.4 Sunje HI-TEK CO.,Ltd Nozzle Ionizers Product Offerings
7.7.5 Sunje HI-TEK CO.,Ltd Recent Developments
7.8 Meech International
7.8.1 Meech International Company Information
7.8.2 Meech International Introduction and Business Overview
7.8.3 Meech International Nozzle Ionizers Sales, Revenue, Price and Gross Margin (2021–2026)
7.8.4 Meech International Nozzle Ionizers Product Offerings
7.8.5 Meech International Recent Developments
7.9 KASUGA DENKI
7.9.1 KASUGA DENKI Company Information
7.9.2 KASUGA DENKI Introduction and Business Overview
7.9.3 KASUGA DENKI Nozzle Ionizers Sales, Revenue, Price and Gross Margin (2021–2026)
7.9.4 KASUGA DENKI Nozzle Ionizers Product Offerings
7.9.5 KASUGA DENKI Recent Developments
7.10 VESSEL
7.10.1 VESSEL Company Information
7.10.2 VESSEL Introduction and Business Overview
7.10.3 VESSEL Nozzle Ionizers Sales, Revenue, Price and Gross Margin (2021–2026)
7.10.4 VESSEL Nozzle Ionizers Product Offerings
7.10.5 VESSEL Recent Developments
7.11 TRINK
7.11.1 TRINK Company Information
7.11.2 TRINK Introduction and Business Overview
7.11.3 TRINK Nozzle Ionizers Sales, Revenue, Price and Gross Margin (2021–2026)
7.11.4 TRINK Nozzle Ionizers Product Offerings
7.11.5 TRINK Recent Developments
7.12 VSI
7.12.1 VSI Company Information
7.12.2 VSI Introduction and Business Overview
7.12.3 VSI Nozzle Ionizers Sales, Revenue, Price and Gross Margin (2021–2026)
7.12.4 VSI Nozzle Ionizers Product Offerings
7.12.5 VSI Recent Developments
7.13 NRD
7.13.1 NRD Company Information
7.13.2 NRD Introduction and Business Overview
7.13.3 NRD Nozzle Ionizers Sales, Revenue, Price and Gross Margin (2021–2026)
7.13.4 NRD Nozzle Ionizers Product Offerings
7.13.5 NRD Recent Developments
7.14 KOGANEI
7.14.1 KOGANEI Company Information
7.14.2 KOGANEI Introduction and Business Overview
7.14.3 KOGANEI Nozzle Ionizers Sales, Revenue, Price and Gross Margin (2021–2026)
7.14.4 KOGANEI Nozzle Ionizers Product Offerings
7.14.5 KOGANEI Recent Developments
7.15 HAUG
7.15.1 HAUG Company Information
7.15.2 HAUG Introduction and Business Overview
7.15.3 HAUG Nozzle Ionizers Sales, Revenue, Price and Gross Margin (2021–2026)
7.15.4 HAUG Nozzle Ionizers Product Offerings
7.15.5 HAUG Recent Developments
7.16 Fraser
7.16.1 Fraser Company Information
7.16.2 Fraser Introduction and Business Overview
7.16.3 Fraser Nozzle Ionizers Sales, Revenue, Price and Gross Margin (2021–2026)
7.16.4 Fraser Nozzle Ionizers Product Offerings
7.16.5 Fraser Recent Developments
7.17 Hamamatsu Photonics
7.17.1 Hamamatsu Photonics Company Information
7.17.2 Hamamatsu Photonics Introduction and Business Overview
7.17.3 Hamamatsu Photonics Nozzle Ionizers Sales, Revenue, Price and Gross Margin (2021–2026)
7.17.4 Hamamatsu Photonics Nozzle Ionizers Product Offerings
7.17.5 Hamamatsu Photonics Recent Developments
7.18 Suzhou TA&A Ultra Clean Technology
7.18.1 Suzhou TA&A Ultra Clean Technology Company Information
7.18.2 Suzhou TA&A Ultra Clean Technology Introduction and Business Overview
7.18.3 Suzhou TA&A Ultra Clean Technology Nozzle Ionizers Sales, Revenue, Price and Gross Margin (2021–2026)
7.18.4 Suzhou TA&A Ultra Clean Technology Nozzle Ionizers Product Offerings
7.18.5 Suzhou TA&A Ultra Clean Technology Recent Developments
7.19 Shimadzu
7.19.1 Shimadzu Company Information
7.19.2 Shimadzu Introduction and Business Overview
7.19.3 Shimadzu Nozzle Ionizers Sales, Revenue, Price and Gross Margin (2021–2026)
7.19.4 Shimadzu Nozzle Ionizers Product Offerings
7.19.5 Shimadzu Recent Developments
7.20 Desco Industries
7.20.1 Desco Industries Company Information
7.20.2 Desco Industries Introduction and Business Overview
7.20.3 Desco Industries Nozzle Ionizers Sales, Revenue, Price and Gross Margin (2021–2026)
7.20.4 Desco Industries Nozzle Ionizers Product Offerings
7.20.5 Desco Industries Recent Developments
7.21 KESD
7.21.1 KESD Company Information
7.21.2 KESD Introduction and Business Overview
7.21.3 KESD Nozzle Ionizers Sales, Revenue, Price and Gross Margin (2021–2026)
7.21.4 KESD Nozzle Ionizers Product Offerings
7.21.5 KESD Recent Developments
7.22 ELCOWA
7.22.1 ELCOWA Company Information
7.22.2 ELCOWA Introduction and Business Overview
7.22.3 ELCOWA Nozzle Ionizers Sales, Revenue, Price and Gross Margin (2021–2026)
7.22.4 ELCOWA Nozzle Ionizers Product Offerings
7.22.5 ELCOWA Recent Developments
7.23 Shanghai Anping Static Technology
7.23.1 Shanghai Anping Static Technology Company Information
7.23.2 Shanghai Anping Static Technology Introduction and Business Overview
7.23.3 Shanghai Anping Static Technology Nozzle Ionizers Sales, Revenue, Price and Gross Margin (2021–2026)
7.23.4 Shanghai Anping Static Technology Nozzle Ionizers Product Offerings
7.23.5 Shanghai Anping Static Technology Recent Developments
7.24 EXAIR
7.24.1 EXAIR Company Information
7.24.2 EXAIR Introduction and Business Overview
7.24.3 EXAIR Nozzle Ionizers Sales, Revenue, Price and Gross Margin (2021–2026)
7.24.4 EXAIR Nozzle Ionizers Product Offerings
7.24.5 EXAIR Recent Developments
7.25 Transforming Technologies
7.25.1 Transforming Technologies Company Information
7.25.2 Transforming Technologies Introduction and Business Overview
7.25.3 Transforming Technologies Nozzle Ionizers Sales, Revenue, Price and Gross Margin (2021–2026)
7.25.4 Transforming Technologies Nozzle Ionizers Product Offerings
7.25.5 Transforming Technologies Recent Developments
7.26 Shanghai qipu electrostatic technology
7.26.1 Shanghai qipu electrostatic technology Company Information
7.26.2 Shanghai qipu electrostatic technology Introduction and Business Overview
7.26.3 Shanghai qipu electrostatic technology Nozzle Ionizers Sales, Revenue, Price and Gross Margin (2021–2026)
7.26.4 Shanghai qipu electrostatic technology Nozzle Ionizers Product Offerings
7.26.5 Shanghai qipu electrostatic technology Recent Developments
7.27 Shanghai SODRON Automatic
7.27.1 Shanghai SODRON Automatic Company Information
7.27.2 Shanghai SODRON Automatic Introduction and Business Overview
7.27.3 Shanghai SODRON Automatic Nozzle Ionizers Sales, Revenue, Price and Gross Margin (2021–2026)
7.27.4 Shanghai SODRON Automatic Nozzle Ionizers Product Offerings
7.27.5 Shanghai SODRON Automatic Recent Developments
7.28 Core Insight
7.28.1 Core Insight Company Information
7.28.2 Core Insight Introduction and Business Overview
7.28.3 Core Insight Nozzle Ionizers Sales, Revenue, Price and Gross Margin (2021–2026)
7.28.4 Core Insight Nozzle Ionizers Product Offerings
7.28.5 Core Insight Recent Developments
7.29 Tronovo
7.29.1 Tronovo Company Information
7.29.2 Tronovo Introduction and Business Overview
7.29.3 Tronovo Nozzle Ionizers Sales, Revenue, Price and Gross Margin (2021–2026)
7.29.4 Tronovo Nozzle Ionizers Product Offerings
7.29.5 Tronovo Recent Developments
7.30 Bondline Electronics Ltd
7.30.1 Bondline Electronics Ltd Company Information
7.30.2 Bondline Electronics Ltd Introduction and Business Overview
7.30.3 Bondline Electronics Ltd Nozzle Ionizers Sales, Revenue, Price and Gross Margin (2021–2026)
7.30.4 Bondline Electronics Ltd Nozzle Ionizers Product Offerings
7.30.5 Bondline Electronics Ltd Recent Developments
7.31 SHENZHEN SENPUM ELECTIRC
7.31.1 SHENZHEN SENPUM ELECTIRC Company Information
7.31.2 SHENZHEN SENPUM ELECTIRC Introduction and Business Overview
7.31.3 SHENZHEN SENPUM ELECTIRC Nozzle Ionizers Sales, Revenue, Price and Gross Margin (2021–2026)
7.31.4 SHENZHEN SENPUM ELECTIRC Nozzle Ionizers Product Offerings
7.31.5 SHENZHEN SENPUM ELECTIRC Recent Developments
7.32 Wuxi Yanping Electronic Technology
7.32.1 Wuxi Yanping Electronic Technology Company Information
7.32.2 Wuxi Yanping Electronic Technology Introduction and Business Overview
7.32.3 Wuxi Yanping Electronic Technology Nozzle Ionizers Sales, Revenue, Price and Gross Margin (2021–2026)
7.32.4 Wuxi Yanping Electronic Technology Nozzle Ionizers Product Offerings
7.32.5 Wuxi Yanping Electronic Technology Recent Developments
7.33 Shenzhen Horb Technology
7.33.1 Shenzhen Horb Technology Company Information
7.33.2 Shenzhen Horb Technology Introduction and Business Overview
7.33.3 Shenzhen Horb Technology Nozzle Ionizers Sales, Revenue, Price and Gross Margin (2021–2026)
7.33.4 Shenzhen Horb Technology Nozzle Ionizers Product Offerings
7.33.5 Shenzhen Horb Technology Recent Developments
8 Industry Chain Analysis
8.1 Nozzle Ionizers Industrial Chain
8.2 Nozzle Ionizers Upstream Analysis
8.2.1 Key Raw Materials
8.2.2 Key Suppliers of Raw Materials
8.2.3 Manufacturing Cost Structure
8.3 Midstream Analysis
8.4 Downstream Analysis (Customer Analysis)
8.5 Sales Model and Sales Channelss
8.5.1 Nozzle Ionizers Sales Model
8.5.2 Sales Channels
8.5.3 Nozzle Ionizers Distributors
9 Research Findings and Conclusion
10 Appendix
10.1 Research Methodology
10.1.1 Methodology/Research Approach
10.1.1.1 Research Programs/Design
10.1.1.2 Market Size Estimation
10.1.1.3 Market Breakdown and Data Triangulation
10.1.2 Data Source
10.1.2.1 Secondary Sources
10.1.2.2 Primary Sources
10.2 Author Details
10.3 Disclaimer