
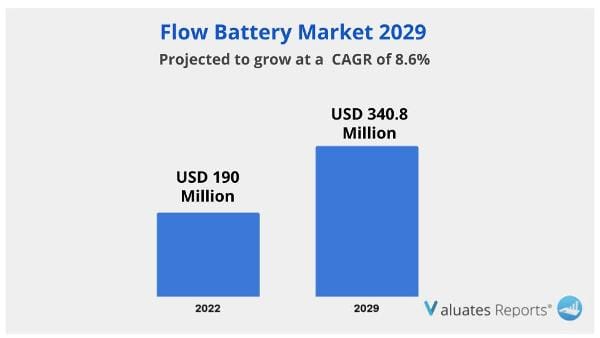
The global Flow Battery market is projected to grow from US$ 207.7 million in 2023 to US$ 340.8 million by 2029, at a Compound Annual Growth Rate (CAGR) of 8.6% during the forecast period.
The market for flow batteries is growing as a consequence of more flow batteries being used in utility applications and more telecommunication towers being built.
The residential use of flow batteries is anticipated to expand in popularity, driving the growth of the Flow Battery Market.
Utility firms are one of the first industries to use flow batteries as they cope with the grid integration of renewable energy. In utilities, flow batteries are ideal for extended discharge durations in MW scale power increments. They also transmit energy when grid services are disrupted and stop interrupted power delivery. Up to this point, the vast majority of flow battery installation projects have been for utility purposes. As a consequence of the rising need for electrification in rural and urban regions, corporate and government organizations have recently improved the electrical grid infrastructure to satisfy energy demands. Numerous governments are also making significant investments in grid construction as a result of the rising demand for power. The market for flow batteries is anticipated to develop as a result of this aspect.
Traditional power systems will be replaced in the next decades by renewable energy sources like solar and wind. Since such sources can only generate energy when it is sunny or windy, a system that can distribute power continuously needs a mechanism to store electricity while resources are available and provide it later when they are not. A viable technique for achieving that goal is the flow battery, an electrochemical device that has the energy storage capacity to operate thousands of homes for many hours on a single charge while also storing hundreds of megawatt-hours of energy. This element is anticipated to fuel the market for flow batteries.
The cycle life of flow batteries is also significantly longer than that of many other battery technologies. Since they are in a liquid form, the liquid electroactive materials do not degrade as quickly as the solid electrodes in traditional batteries. The usage of flow batteries for load-shifting and other applications that need frequent cycling is made appealing by this property. Another advantage of flow batteries is that they provide different power and energy scalability. By adjusting the size of the electrolyte tanks and the flow rates, a flow battery system may be optimised for either high power output or long-duration energy storage, depending on the demands of the application. The Flow Battery Market is anticipated to increase as a result of this cause.
The largest market, with a share of more than 78%, is in Asia-Pacific. Over the course of the projection period, it is predicted that a growth in the usage of energy storage technologies in utilities and industrial settings, as well as an increase in the number of operational projects utilizing flow battery installations, will propel regional market expansion. Countries like China, Japan, India, and Australia are striving to develop their capacity for large-scale energy storage through the use of battery technology, which might enhance electric stability.
With a share of around 90%, the vanadium flow battery market is the largest. Vanadium redox flow batteries (VRFBs) offer a larger energy capacity and a lesser environmental effect during battery discharge due to their enormous electrolyte storage capacity. In contrast to lead-acid and lithium-ion batteries, they are less damaging to the environment since they don't contain any hazardous or highly reactive elements, and they don't offer a risk of exploding.
Some of the key players in the worldwide flow battery market are Dalian Rongke Power, Primus Power, Sumitomo Electric, VRB ENERGY, Largo Clean Energy, etc. These companies collectively control roughly 95% of the market.
Utility facilities account for more than 80% of applications, making them the most common. Flow batteries are generally used in utility applications as a buffer between the supply of energy from the electric grid and the demand for electricity. Given that flow batteries can reliably store and release electricity, utility operators may reduce the quantity of excess electricity generated. Additionally, utilities require batteries that can handle a high penetration of renewable energy across the system and are durable, robust, and strong.
| Report Metric | Details |
| Report Name | Global Flow Battery Market |
| Base Year | 2022 |
| Forecasted years | 2023-2029 |
| By Company |
|
| Segment by Type |
|
| Segment by Application |
|
| By Region |
|
| Forecast units | USD million in value |
| Report coverage | Revenue and volume forecast, company share, competitive landscape, growth factors and trends |
Chapter 1: Introduces the report scope of the report, executive summary of different market segments (by region, by type, by application, etc), including the market size of each market segment, future development potential, and so on. It offers a high-level view of the current state of the market and its likely evolution in the short to mid-term, and long term.
Chapter 2: Detailed analysis of Flow Battery manufacturers competitive landscape, price, production and value market share, latest development plan, merger, and acquisition information, etc.
Chapter 3: Production/output, value of Flow Battery by region/country. It provides a quantitative analysis of the market size and development potential of each region in the next six years.
Chapter 4: Consumption of Flow Battery in regional level and country level. It provides a quantitative analysis of the market size and development potential of each region and its main countries and introduces the market development, future development prospects, market space, and production of each country in the world.
Chapter 5: Provides the analysis of various market segments by type, covering the market size and development potential of each market segment, to help readers find the blue ocean market in different market segments.
Chapter 6: Provides the analysis of various market segments by application, covering the market size and development potential of each market segment, to help readers find the blue ocean market in different downstream markets.
Chapter 7: Provides profiles of key players, introducing the basic situation of the key companies in the market in detail, including product production/output, value, price, gross margin, product introduction, recent development, etc.
Chapter 8: Analysis of industrial chain, including the upstream and downstream of the industry.
Chapter 9: Introduces the market dynamics, latest developments of the market, the driving factors and restrictive factors of the market, the challenges and risks faced by manufacturers in the industry, and the analysis of relevant policies in the industry.
Chapter 10: The main points and conclusions of the report.
Ans. The global Flow Battery market was valued at US$ 190 million in 2022 and is anticipated to reach US$ 340.8 million by 2029, witnessing a CAGR of 8.6% during the forecast period 2023-2029.
Ans. Global flow battery main players include Dalian Rongke Power, Primus Power, Sumitomo Electric, VRB ENERGY, Largo Clean Energy, etc., totally accounting for about 95%.
Ans. Yes, the report includes a COVID-19 impact analysis. Also, it is further extended into every individual segment of the report.
Ans. Asia-Pacific is the largest market, with a share over 78%.
Ans. Vanadium flow battery is the largest segment, holding a share aboutr 90%.
Ans. The most common application is in utility facilities, taking a share over 80%.
1 Flow Battery Market Overview
1.1 Product Definition
1.2 Flow Battery Segment by Type
1.2.1 Global Flow Battery Market Value Growth Rate Analysis by Type 2022 VS 2029
1.2.2 Vanadium Flow Battery
1.2.3 Hybrid Flow Battery
1.3 Flow Battery Segment by Application
1.3.1 Global Flow Battery Market Value Growth Rate Analysis by Application: 2022 VS 2029
1.3.2 Utility Facilities
1.3.3 Renewable Energy Integration
1.3.4 Others
1.4 Global Market Growth Prospects
1.4.1 Global Flow Battery Production Value Estimates and Forecasts (2018-2029)
1.4.2 Global Flow Battery Production Capacity Estimates and Forecasts (2018-2029)
1.4.3 Global Flow Battery Production Estimates and Forecasts (2018-2029)
1.4.4 Global Flow Battery Market Average Price Estimates and Forecasts (2018-2029)
1.5 Assumptions and Limitations
2 Market Competition by Manufacturers
2.1 Global Flow Battery Production Market Share by Manufacturers (2018-2023)
2.2 Global Flow Battery Production Value Market Share by Manufacturers (2018-2023)
2.3 Global Key Players of Flow Battery, Industry Ranking, 2021 VS 2022 VS 2023
2.4 Global Flow Battery Market Share by Company Type (Tier 1, Tier 2 and Tier 3)
2.5 Global Flow Battery Average Price by Manufacturers (2018-2023)
2.6 Global Key Manufacturers of Flow Battery, Manufacturing Base Distribution and Headquarters
2.7 Global Key Manufacturers of Flow Battery, Product Offered and Application
2.8 Global Key Manufacturers of Flow Battery, Date of Enter into This Industry
2.9 Flow Battery Market Competitive Situation and Trends
2.9.1 Flow Battery Market Concentration Rate
2.9.2 Global 5 and 10 Largest Flow Battery Players Market Share by Revenue
2.10 Mergers & Acquisitions, Expansion
3 Flow Battery Production by Region
3.1 Global Flow Battery Production Value Estimates and Forecasts by Region: 2018 VS 2022 VS 2029
3.2 Global Flow Battery Production Value by Region (2018-2029)
3.2.1 Global Flow Battery Production Value Market Share by Region (2018-2023)
3.2.2 Global Forecasted Production Value of Flow Battery by Region (2024-2029)
3.3 Global Flow Battery Production Estimates and Forecasts by Region: 2018 VS 2022 VS 2029
3.4 Global Flow Battery Production by Region (2018-2029)
3.4.1 Global Flow Battery Production Market Share by Region (2018-2023)
3.4.2 Global Forecasted Production of Flow Battery by Region (2024-2029)
3.5 Global Flow Battery Market Price Analysis by Region (2018-2023)
3.6 Global Flow Battery Production and Value, Year-over-Year Growth
3.6.1 North America Flow Battery Production Value Estimates and Forecasts (2018-2029)
3.6.2 China Flow Battery Production Value Estimates and Forecasts (2018-2029)
3.6.3 Japan Flow Battery Production Value Estimates and Forecasts (2018-2029)
4 Flow Battery Consumption by Region
4.1 Global Flow Battery Consumption Estimates and Forecasts by Region: 2018 VS 2022 VS 2029
4.2 Global Flow Battery Consumption by Region (2018-2029)
4.2.1 Global Flow Battery Consumption by Region (2018-2023)
4.2.2 Global Flow Battery Forecasted Consumption by Region (2024-2029)
4.3 North America
4.3.1 North America Flow Battery Consumption Growth Rate by Country: 2018 VS 2022 VS 2029
4.3.2 North America Flow Battery Consumption by Country (2018-2029)
4.3.3 United States
4.3.4 Canada
4.4 Europe
4.4.1 Europe Flow Battery Consumption Growth Rate by Country: 2018 VS 2022 VS 2029
4.4.2 Europe Flow Battery Consumption by Country (2018-2029)
4.4.3 Germany
4.4.4 France
4.4.5 U.K.
4.4.6 Italy
4.4.7 Russia
4.5 Asia Pacific
4.5.1 Asia Pacific Flow Battery Consumption Growth Rate by Region: 2018 VS 2022 VS 2029
4.5.2 Asia Pacific Flow Battery Consumption by Region (2018-2029)
4.5.3 China
4.5.4 Japan
4.5.5 South Korea
4.5.6 China Taiwan
4.5.7 Southeast Asia
4.5.8 India
4.6 Latin America, Middle East & Africa
4.6.1 Latin America, Middle East & Africa Flow Battery Consumption Growth Rate by Country: 2018 VS 2022 VS 2029
4.6.2 Latin America, Middle East & Africa Flow Battery Consumption by Country (2018-2029)
4.6.3 Mexico
4.6.4 Brazil
4.6.5 Turkey
5 Segment by Type
5.1 Global Flow Battery Production by Type (2018-2029)
5.1.1 Global Flow Battery Production by Type (2018-2023)
5.1.2 Global Flow Battery Production by Type (2024-2029)
5.1.3 Global Flow Battery Production Market Share by Type (2018-2029)
5.2 Global Flow Battery Production Value by Type (2018-2029)
5.2.1 Global Flow Battery Production Value by Type (2018-2023)
5.2.2 Global Flow Battery Production Value by Type (2024-2029)
5.2.3 Global Flow Battery Production Value Market Share by Type (2018-2029)
5.3 Global Flow Battery Price by Type (2018-2029)
6 Segment by Application
6.1 Global Flow Battery Production by Application (2018-2029)
6.1.1 Global Flow Battery Production by Application (2018-2023)
6.1.2 Global Flow Battery Production by Application (2024-2029)
6.1.3 Global Flow Battery Production Market Share by Application (2018-2029)
6.2 Global Flow Battery Production Value by Application (2018-2029)
6.2.1 Global Flow Battery Production Value by Application (2018-2023)
6.2.2 Global Flow Battery Production Value by Application (2024-2029)
6.2.3 Global Flow Battery Production Value Market Share by Application (2018-2029)
6.3 Global Flow Battery Price by Application (2018-2029)
7 Key Companies Profiled
7.1 Dalian Rongke Power
7.1.1 Dalian Rongke Power Flow Battery Corporation Information
7.1.2 Dalian Rongke Power Flow Battery Product Portfolio
7.1.3 Dalian Rongke Power Flow Battery Production, Value, Price and Gross Margin (2018-2023)
7.1.4 Dalian Rongke Power Main Business and Markets Served
7.1.5 Dalian Rongke Power Recent Developments/Updates
7.2 Primus Power
7.2.1 Primus Power Flow Battery Corporation Information
7.2.2 Primus Power Flow Battery Product Portfolio
7.2.3 Primus Power Flow Battery Production, Value, Price and Gross Margin (2018-2023)
7.2.4 Primus Power Main Business and Markets Served
7.2.5 Primus Power Recent Developments/Updates
7.3 Sumitomo Electric
7.3.1 Sumitomo Electric Flow Battery Corporation Information
7.3.2 Sumitomo Electric Flow Battery Product Portfolio
7.3.3 Sumitomo Electric Flow Battery Production, Value, Price and Gross Margin (2018-2023)
7.3.4 Sumitomo Electric Main Business and Markets Served
7.3.5 Sumitomo Electric Recent Developments/Updates
7.4 VRB ENERGY
7.4.1 VRB ENERGY Flow Battery Corporation Information
7.4.2 VRB ENERGY Flow Battery Product Portfolio
7.4.3 VRB ENERGY Flow Battery Production, Value, Price and Gross Margin (2018-2023)
7.4.4 VRB ENERGY Main Business and Markets Served
7.4.5 VRB ENERGY Recent Developments/Updates
7.5 Largo Clean Energy
7.5.1 Largo Clean Energy Flow Battery Corporation Information
7.5.2 Largo Clean Energy Flow Battery Product Portfolio
7.5.3 Largo Clean Energy Flow Battery Production, Value, Price and Gross Margin (2018-2023)
7.5.4 Largo Clean Energy Main Business and Markets Served
7.5.5 Largo Clean Energy Recent Developments/Updates
8 Industry Chain and Sales Channels Analysis
8.1 Flow Battery Industry Chain Analysis
8.2 Flow Battery Key Raw Materials
8.2.1 Key Raw Materials
8.2.2 Raw Materials Key Suppliers
8.3 Flow Battery Production Mode & Process
8.4 Flow Battery Sales and Marketing
8.4.1 Flow Battery Sales Channels
8.4.2 Flow Battery Distributors
8.5 Flow Battery Customers
9 Flow Battery Market Dynamics
9.1 Flow Battery Industry Trends
9.2 Flow Battery Market Drivers
9.3 Flow Battery Market Challenges
9.4 Flow Battery Market Restraints
10 Research Finding and Conclusion
11 Methodology and Data Source
11.1 Methodology/Research Approach
11.1.1 Research Programs/Design
11.1.2 Market Size Estimation
11.1.3 Market Breakdown and Data Triangulation
11.2 Data Source
11.2.1 Secondary Sources
11.2.2 Primary Sources
11.3 Author List
11.4 Disclaimer
List of Tables
Table 1. Global Flow Battery Market Value by Type, (US$ Million) & (2022 VS 2029)
Table 2. Global Flow Battery Market Value by Application, (US$ Million) & (2022 VS 2029)
Table 3. Global Flow Battery Production Capacity (MWh) by Manufacturers in 2022
Table 4. Global Flow Battery Production by Manufacturers (2018-2023) & (MWh)
Table 5. Global Flow Battery Production Market Share by Manufacturers (2018-2023)
Table 6. Global Flow Battery Production Value by Manufacturers (2018-2023) & (US$ Million)
Table 7. Global Flow Battery Production Value Share by Manufacturers (2018-2023)
Table 8. Global Flow Battery Industry Ranking 2021 VS 2022 VS 2023
Table 9. Company Type (Tier 1, Tier 2 and Tier 3) & (based on the Revenue in Flow Battery as of 2022)
Table 10. Global Market Flow Battery Average Price by Manufacturers (US$/KWh) & (2018-2023)
Table 11. Manufacturers Flow Battery Production Sites and Area Served
Table 12. Manufacturers Flow Battery Product Types
Table 13. Global Flow Battery Manufacturers Market Concentration Ratio (CR5 and HHI)
Table 14. Mergers & Acquisitions, Expansion
Table 15. Global Flow Battery Production Value by Region: 2018 VS 2022 VS 2029 (US$ Million)
Table 16. Global Flow Battery Production Value (US$ Million) by Region (2018-2023)
Table 17. Global Flow Battery Production Value Market Share by Region (2018-2023)
Table 18. Global Flow Battery Production Value (US$ Million) Forecast by Region (2024-2029)
Table 19. Global Flow Battery Production Value Market Share Forecast by Region (2024-2029)
Table 20. Global Flow Battery Production Comparison by Region: 2018 VS 2022 VS 2029 (MWh)
Table 21. Global Flow Battery Production (MWh) by Region (2018-2023)
Table 22. Global Flow Battery Production Market Share by Region (2018-2023)
Table 23. Global Flow Battery Production (MWh) Forecast by Region (2024-2029)
Table 24. Global Flow Battery Production Market Share Forecast by Region (2024-2029)
Table 25. Global Flow Battery Market Average Price (US$/KWh) by Region (2018-2023)
Table 26. Global Flow Battery Market Average Price (US$/KWh) by Region (2024-2029)
Table 27. Global Flow Battery Consumption Growth Rate by Region: 2018 VS 2022 VS 2029 (MWh)
Table 28. Global Flow Battery Consumption by Region (2018-2023) & (MWh)
Table 29. Global Flow Battery Consumption Market Share by Region (2018-2023)
Table 30. Global Flow Battery Forecasted Consumption by Region (2024-2029) & (MWh)
Table 31. Global Flow Battery Forecasted Consumption Market Share by Region (2018-2023)
Table 32. North America Flow Battery Consumption Growth Rate by Country: 2018 VS 2022 VS 2029 (MWh)
Table 33. North America Flow Battery Consumption by Country (2018-2023) & (MWh)
Table 34. North America Flow Battery Consumption by Country (2024-2029) & (MWh)
Table 35. Europe Flow Battery Consumption Growth Rate by Country: 2018 VS 2022 VS 2029 (MWh)
Table 36. Europe Flow Battery Consumption by Country (2018-2023) & (MWh)
Table 37. Europe Flow Battery Consumption by Country (2024-2029) & (MWh)
Table 38. Asia Pacific Flow Battery Consumption Growth Rate by Region: 2018 VS 2022 VS 2029 (MWh)
Table 39. Asia Pacific Flow Battery Consumption by Region (2018-2023) & (MWh)
Table 40. Asia Pacific Flow Battery Consumption by Region (2024-2029) & (MWh)
Table 41. Latin America, Middle East & Africa Flow Battery Consumption Growth Rate by Country: 2018 VS 2022 VS 2029 (MWh)
Table 42. Latin America, Middle East & Africa Flow Battery Consumption by Country (2018-2023) & (MWh)
Table 43. Latin America, Middle East & Africa Flow Battery Consumption by Country (2024-2029) & (MWh)
Table 44. Global Flow Battery Production (MWh) by Type (2018-2023)
Table 45. Global Flow Battery Production (MWh) by Type (2024-2029)
Table 46. Global Flow Battery Production Market Share by Type (2018-2023)
Table 47. Global Flow Battery Production Market Share by Type (2024-2029)
Table 48. Global Flow Battery Production Value (US$ Million) by Type (2018-2023)
Table 49. Global Flow Battery Production Value (US$ Million) by Type (2024-2029)
Table 50. Global Flow Battery Production Value Share by Type (2018-2023)
Table 51. Global Flow Battery Production Value Share by Type (2024-2029)
Table 52. Global Flow Battery Price (US$/KWh) by Type (2018-2023)
Table 53. Global Flow Battery Price (US$/KWh) by Type (2024-2029)
Table 54. Global Flow Battery Production (MWh) by Application (2018-2023)
Table 55. Global Flow Battery Production (MWh) by Application (2024-2029)
Table 56. Global Flow Battery Production Market Share by Application (2018-2023)
Table 57. Global Flow Battery Production Market Share by Application (2024-2029)
Table 58. Global Flow Battery Production Value (US$ Million) by Application (2018-2023)
Table 59. Global Flow Battery Production Value (US$ Million) by Application (2024-2029)
Table 60. Global Flow Battery Production Value Share by Application (2018-2023)
Table 61. Global Flow Battery Production Value Share by Application (2024-2029)
Table 62. Global Flow Battery Price (US$/KWh) by Application (2018-2023)
Table 63. Global Flow Battery Price (US$/KWh) by Application (2024-2029)
Table 64. Dalian Rongke Power Flow Battery Corporation Information
Table 65. Dalian Rongke Power Specification and Application
Table 66. Dalian Rongke Power Flow Battery Production (MWh), Value (US$ Million), Price (US$/KWh) and Gross Margin (2018-2023)
Table 67. Dalian Rongke Power Main Business and Markets Served
Table 68. Dalian Rongke Power Recent Developments/Updates
Table 69. Primus Power Flow Battery Corporation Information
Table 70. Primus Power Specification and Application
Table 71. Primus Power Flow Battery Production (MWh), Value (US$ Million), Price (US$/KWh) and Gross Margin (2018-2023)
Table 72. Primus Power Main Business and Markets Served
Table 73. Primus Power Recent Developments/Updates
Table 74. Sumitomo Electric Flow Battery Corporation Information
Table 75. Sumitomo Electric Specification and Application
Table 76. Sumitomo Electric Flow Battery Production (MWh), Value (US$ Million), Price (US$/KWh) and Gross Margin (2018-2023)
Table 77. Sumitomo Electric Main Business and Markets Served
Table 78. Sumitomo Electric Recent Developments/Updates
Table 79. VRB ENERGY Flow Battery Corporation Information
Table 80. VRB ENERGY Specification and Application
Table 81. VRB ENERGY Flow Battery Production (MWh), Value (US$ Million), Price (US$/KWh) and Gross Margin (2018-2023)
Table 82. VRB ENERGY Main Business and Markets Served
Table 83. VRB ENERGY Recent Developments/Updates
Table 84. Largo Clean Energy Flow Battery Corporation Information
Table 85. Largo Clean Energy Specification and Application
Table 86. Largo Clean Energy Flow Battery Production (MWh), Value (US$ Million), Price (US$/KWh) and Gross Margin (2018-2023)
Table 87. Largo Clean Energy Main Business and Markets Served
Table 88. Largo Clean Energy Recent Developments/Updates
Table 89. Key Raw Materials Lists
Table 90. Raw Materials Key Suppliers Lists
Table 91. Flow Battery Distributors List
Table 92. Flow Battery Customers List
Table 93. Flow Battery Market Trends
Table 94. Flow Battery Market Drivers
Table 95. Flow Battery Market Challenges
Table 96. Flow Battery Market Restraints
Table 97. Research Programs/Design for This Report
Table 98. Key Data Information from Secondary Sources
Table 99. Key Data Information from Primary Sources
List of Figures
Figure 1. Product Picture of Flow Battery
Figure 2. Global Flow Battery Market Value by Type, (US$ Million) & (2022 VS 2029)
Figure 3. Global Flow Battery Market Share by Type: 2022 VS 2029
Figure 4. Vanadium Flow Battery Product Picture
Figure 5. Hybrid Flow Battery Product Picture
Figure 6. Global Flow Battery Market Value by Application, (US$ Million) & (2022 VS 2029)
Figure 7. Global Flow Battery Market Share by Application: 2022 VS 2029
Figure 8. Utility Facilities
Figure 9. Renewable Energy Integration
Figure 10. Others
Figure 11. Global Flow Battery Production Value (US$ Million), 2018 VS 2022 VS 2029
Figure 12. Global Flow Battery Production Value (US$ Million) & (2018-2029)
Figure 13. Global Flow Battery Production (MWh) & (2018-2029)
Figure 14. Global Flow Battery Average Price (US$/KWh) & (2018-2029)
Figure 15. Flow Battery Report Years Considered
Figure 16. Flow Battery Production Share by Manufacturers in 2022
Figure 17. Flow Battery Market Share by Company Type (Tier 1, Tier 2, and Tier 3): 2018 VS 2022
Figure 18. The Global 5 and 10 Largest Players: Market Share by Flow Battery Revenue in 2022
Figure 19. Global Flow Battery Production Value by Region: 2018 VS 2022 VS 2029 (US$ Million)
Figure 20. Global Flow Battery Production Value Market Share by Region: 2018 VS 2022 VS 2029
Figure 21. Global Flow Battery Production Comparison by Region: 2018 VS 2022 VS 2029 (MWh)
Figure 22. Global Flow Battery Production Market Share by Region: 2018 VS 2022 VS 2029
Figure 23. North America Flow Battery Production Value (US$ Million) Growth Rate (2018-2029)
Figure 24. China Flow Battery Production Value (US$ Million) Growth Rate (2018-2029)
Figure 25. Japan Flow Battery Production Value (US$ Million) Growth Rate (2018-2029)
Figure 26. Global Flow Battery Consumption by Region: 2018 VS 2022 VS 2029 (MWh)
Figure 27. Global Flow Battery Consumption Market Share by Region: 2018 VS 2022 VS 2029
Figure 28. North America Flow Battery Consumption and Growth Rate (2018-2023) & (MWh)
Figure 29. North America Flow Battery Consumption Market Share by Country (2018-2029)
Figure 30. Canada Flow Battery Consumption and Growth Rate (2018-2023) & (MWh)
Figure 31. U.S. Flow Battery Consumption and Growth Rate (2018-2023) & (MWh)
Figure 32. Europe Flow Battery Consumption and Growth Rate (2018-2023) & (MWh)
Figure 33. Europe Flow Battery Consumption Market Share by Country (2018-2029)
Figure 34. Germany Flow Battery Consumption and Growth Rate (2018-2023) & (MWh)
Figure 35. France Flow Battery Consumption and Growth Rate (2018-2023) & (MWh)
Figure 36. U.K. Flow Battery Consumption and Growth Rate (2018-2023) & (MWh)
Figure 37. Italy Flow Battery Consumption and Growth Rate (2018-2023) & (MWh)
Figure 38. Russia Flow Battery Consumption and Growth Rate (2018-2023) & (MWh)
Figure 39. Asia Pacific Flow Battery Consumption and Growth Rate (2018-2023) & (MWh)
Figure 40. Asia Pacific Flow Battery Consumption Market Share by Regions (2018-2029)
Figure 41. China Flow Battery Consumption and Growth Rate (2018-2023) & (MWh)
Figure 42. Japan Flow Battery Consumption and Growth Rate (2018-2023) & (MWh)
Figure 43. South Korea Flow Battery Consumption and Growth Rate (2018-2023) & (MWh)
Figure 44. China Taiwan Flow Battery Consumption and Growth Rate (2018-2023) & (MWh)
Figure 45. Southeast Asia Flow Battery Consumption and Growth Rate (2018-2023) & (MWh)
Figure 46. India Flow Battery Consumption and Growth Rate (2018-2023) & (MWh)
Figure 47. Latin America, Middle East & Africa Flow Battery Consumption and Growth Rate (2018-2023) & (MWh)
Figure 48. Latin America, Middle East & Africa Flow Battery Consumption Market Share by Country (2018-2029)
Figure 49. Mexico Flow Battery Consumption and Growth Rate (2018-2023) & (MWh)
Figure 50. Brazil Flow Battery Consumption and Growth Rate (2018-2023) & (MWh)
Figure 51. Turkey Flow Battery Consumption and Growth Rate (2018-2023) & (MWh)
Figure 52. GCC Countries Flow Battery Consumption and Growth Rate (2018-2023) & (MWh)
Figure 53. Global Production Market Share of Flow Battery by Type (2018-2029)
Figure 54. Global Production Value Market Share of Flow Battery by Type (2018-2029)
Figure 55. Global Flow Battery Price (US$/KWh) by Type (2018-2029)
Figure 56. Global Production Market Share of Flow Battery by Application (2018-2029)
Figure 57. Global Production Value Market Share of Flow Battery by Application (2018-2029)
Figure 58. Global Flow Battery Price (US$/KWh) by Application (2018-2029)
Figure 59. Flow Battery Value Chain
Figure 60. Flow Battery Production Process
Figure 61. Channels of Distribution (Direct Vs Distribution)
Figure 62. Distributors Profiles
Figure 63. Bottom-up and Top-down Approaches for This Report
Figure 64. Data Triangulation
$2900
$4350
$5800
HAVE A QUERY?
OUR CUSTOMER
