List of Tables
Table 1. Global Machine Vision Laser Market Size Growth Rate by Type (US$ Million): 2021 vs 2025 vs 2032
Table 2. Key Players of 405–450 nm (Violet/Blue)
Table 3. Key Players of 520 nm (Green)
Table 4. Key Players of 635–660 nm (Red)
Table 5. Key Players of 780–940 nm (Near-infrared)
Table 6. Global Machine Vision Laser Market Size Growth Rate by Projection Geometry (US$ Million): 2021 vs 2025 vs 2032
Table 7. Key Players of Spot
Table 8. Key Players of Line
Table 9. Key Players of Crosshair / Multi-line
Table 10. Key Players of Others
Table 11. Global Machine Vision Laser Market Size Growth Rate by Power Class (US$ Million): 2021 vs 2025 vs 2032
Table 12. Key Players of Low Power (less than 10mW)
Table 13. Key Players of Medium Power (10–200mW)
Table 14. Key Players of High Peak Pulse
Table 15. Global Machine Vision Laser Market Size Growth Rate by Integration (US$ Million): 2021 vs 2025 vs 2032
Table 16. Key Players of Independent Laser Module
Table 17. Key Players of Fiber-coupled Output
Table 18. Key Players of Others
Table 19. Global Machine Vision Laser Market Size Growth by Application (US$ Million): 2021 vs 2025 vs 2032
Table 20. Global Machine Vision Laser Market Size by Region (US$ Million): 2021 vs 2025 vs 2032
Table 21. Global Machine Vision Laser Market Size by Region (US$ Million), 2021–2026
Table 22. Global Machine Vision Laser Market Share by Region (2021–2026)
Table 23. Global Machine Vision Laser Forecasted Market Size by Region (US$ Million), 2027–2032
Table 24. Global Machine Vision Laser Market Share by Region (2027–2032)
Table 25. Machine Vision Laser Market Trends
Table 26. Machine Vision Laser Market Drivers
Table 27. Machine Vision Laser Market Challenges
Table 28. Machine Vision Laser Market Restraints
Table 29. Global Machine Vision Laser Revenue by Players (US$ Million), 2021–2026
Table 30. Global Machine Vision Laser Market Share by Players (2021–2026)
Table 31. Global Top Machine Vision Laser Players by Tier (Tier 1, Tier 2, and Tier 3), based on Machine Vision Laser Revenue, 2025
Table 32. Ranking of Global Top Machine Vision Laser Companies by Revenue (US$ Million) in 2025
Table 33. Global 5 Largest Players Market Share by Machine Vision Laser Revenue (CR5 and HHI), 2021–2026
Table 34. Global Key Players of Machine Vision Laser, Headquarters and Area Served
Table 35. Global Key Players of Machine Vision Laser, Products and Applications
Table 36. Global Key Players of Machine Vision Laser, Date of General Availability (GA)
Table 37. Mergers and Acquisitions, Expansion Plans
Table 38. Global Machine Vision Laser Market Size by Type (US$ Million), 2021–2026
Table 39. Global Machine Vision Laser Revenue Market Share by Type (2021–2026)
Table 40. Global Machine Vision Laser Forecasted Market Size by Type (US$ Million), 2027–2032
Table 41. Global Machine Vision Laser Revenue Market Share by Type (2027–2032)
Table 42. Global Machine Vision Laser Market Size by Application (US$ Million), 2021–2026
Table 43. Global Machine Vision Laser Revenue Market Share by Application (2021–2026)
Table 44. Global Machine Vision Laser Forecasted Market Size by Application (US$ Million), 2027–2032
Table 45. Global Machine Vision Laser Revenue Market Share by Application (2027–2032)
Table 46. North America Machine Vision Laser Market Size Growth Rate by Country (US$ Million): 2021 vs 2025 vs 2032
Table 47. North America Machine Vision Laser Market Size by Country (US$ Million), 2021–2026
Table 48. North America Machine Vision Laser Market Size by Country (US$ Million), 2027–2032
Table 49. Europe Machine Vision Laser Market Size Growth Rate by Country (US$ Million): 2021 vs 2025 vs 2032
Table 50. Europe Machine Vision Laser Market Size by Country (US$ Million), 2021–2026
Table 51. Europe Machine Vision Laser Market Size by Country (US$ Million), 2027–2032
Table 52. Asia-Pacific Machine Vision Laser Market Size Growth Rate by Region (US$ Million): 2021 vs 2025 vs 2032
Table 53. Asia-Pacific Machine Vision Laser Market Size by Region (US$ Million), 2021–2026
Table 54. Asia-Pacific Machine Vision Laser Market Size by Region (US$ Million), 2027–2032
Table 55. Latin America Machine Vision Laser Market Size Growth Rate by Country (US$ Million): 2021 vs 2025 vs 2032
Table 56. Latin America Machine Vision Laser Market Size by Country (US$ Million), 2021–2026
Table 57. Latin America Machine Vision Laser Market Size by Country (US$ Million), 2027–2032
Table 58. Middle East & Africa Machine Vision Laser Market Size Growth Rate by Country (US$ Million): 2021 vs 2025 vs 2032
Table 59. Middle East & Africa Machine Vision Laser Market Size by Country (US$ Million), 2021–2026
Table 60. Middle East & Africa Machine Vision Laser Market Size by Country (US$ Million), 2027–2032
Table 61. Cavitar Ltd. Company Details
Table 62. Cavitar Ltd. Business Overview
Table 63. Cavitar Ltd. Machine Vision Laser Product
Table 64. Cavitar Ltd. Revenue in Machine Vision Laser Business (US$ Million), 2021–2026
Table 65. Cavitar Ltd. Recent Development
Table 66. Laser Components GmbH Company Details
Table 67. Laser Components GmbH Business Overview
Table 68. Laser Components GmbH Machine Vision Laser Product
Table 69. Laser Components GmbH Revenue in Machine Vision Laser Business (US$ Million), 2021–2026
Table 70. Laser Components GmbH Recent Development
Table 71. Laserex Company Details
Table 72. Laserex Business Overview
Table 73. Laserex Machine Vision Laser Product
Table 74. Laserex Revenue in Machine Vision Laser Business (US$ Million), 2021–2026
Table 75. Laserex Recent Development
Table 76. ProPhotonix Company Details
Table 77. ProPhotonix Business Overview
Table 78. ProPhotonix Machine Vision Laser Product
Table 79. ProPhotonix Revenue in Machine Vision Laser Business (US$ Million), 2021–2026
Table 80. ProPhotonix Recent Development
Table 81. Z-Laser GmbH Company Details
Table 82. Z-Laser GmbH Business Overview
Table 83. Z-Laser GmbH Machine Vision Laser Product
Table 84. Z-Laser GmbH Revenue in Machine Vision Laser Business (US$ Million), 2021–2026
Table 85. Z-Laser GmbH Recent Development
Table 86. Schäfter+Kirchhoff Company Details
Table 87. Schäfter+Kirchhoff Business Overview
Table 88. Schäfter+Kirchhoff Machine Vision Laser Product
Table 89. Schäfter+Kirchhoff Revenue in Machine Vision Laser Business (US$ Million), 2021–2026
Table 90. Schäfter+Kirchhoff Recent Development
Table 91. Coherent Company Details
Table 92. Coherent Business Overview
Table 93. Coherent Machine Vision Laser Product
Table 94. Coherent Revenue in Machine Vision Laser Business (US$ Million), 2021–2026
Table 95. Coherent Recent Development
Table 96. Global Laser Solutions Company Details
Table 97. Global Laser Solutions Business Overview
Table 98. Global Laser Solutions Machine Vision Laser Product
Table 99. Global Laser Solutions Revenue in Machine Vision Laser Business (US$ Million), 2021–2026
Table 100. Global Laser Solutions Recent Development
Table 101. Power Technology, Inc Company Details
Table 102. Power Technology, Inc Business Overview
Table 103. Power Technology, Inc Machine Vision Laser Product
Table 104. Power Technology, Inc Revenue in Machine Vision Laser Business (US$ Million), 2021–2026
Table 105. Power Technology, Inc Recent Development
Table 106. Mxtlaser Company Details
Table 107. Mxtlaser Business Overview
Table 108. Mxtlaser Machine Vision Laser Product
Table 109. Mxtlaser Revenue in Machine Vision Laser Business (US$ Million), 2021–2026
Table 110. Mxtlaser Recent Development
Table 111. Osela Company Details
Table 112. Osela Business Overview
Table 113. Osela Machine Vision Laser Product
Table 114. Osela Revenue in Machine Vision Laser Business (US$ Million), 2021–2026
Table 115. Osela Recent Development
Table 116. Research Programs/Design for This Report
Table 117. Key Data Information from Secondary Sources
Table 118. Key Data Information from Primary Sources
Table 119. Authors List of This Report
List of Figures
Figure 1. Machine Vision Laser Picture
Figure 2. Global Machine Vision Laser Market Size Comparison by Type (US$ Million), 2021–2032
Figure 3. Global Machine Vision Laser Market Share by Type: 2025 vs 2032
Figure 4. 405–450 nm (Violet/Blue) Features
Figure 5. 520 nm (Green) Features
Figure 6. 635–660 nm (Red) Features
Figure 7. 780–940 nm (Near-infrared) Features
Figure 8. Global Machine Vision Laser Market Size Comparison by Projection Geometry (US$ Million), 2021–2032
Figure 9. Spot Features
Figure 10. Line Features
Figure 11. Crosshair / Multi-line Features
Figure 12. Others Features
Figure 13. Global Machine Vision Laser Market Size Comparison by Power Class (US$ Million), 2021–2032
Figure 14. Low Power (less than 10mW) Features
Figure 15. Medium Power (10–200mW) Features
Figure 16. High Peak Pulse Features
Figure 17. Global Machine Vision Laser Market Size Comparison by Integration (US$ Million), 2021–2032
Figure 18. Independent Laser Module Features
Figure 19. Fiber-coupled Output Features
Figure 20. Others Features
Figure 21. Global Machine Vision Laser Market Size by Application (US$ Million), 2021–2032
Figure 22. Global Machine Vision Laser Market Share by Application: 2025 vs 2032
Figure 23. Automotive Case Studies
Figure 24. Electronics and Semiconductor Case Studies
Figure 25. Food and Beverages Case Studies
Figure 26. Pharmaceuticals Case Studies
Figure 27. Logistics Case Studies
Figure 28. Others Case Studies
Figure 29. Machine Vision Laser Report Years Considered
Figure 30. Global Machine Vision Laser Market Size (US$ Million), Year-over-Year: 2021–2032
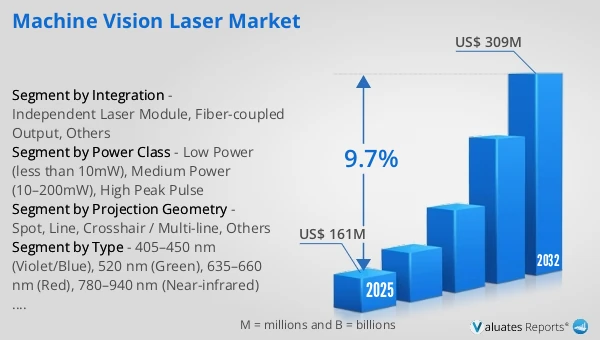
Figure 31. Global Machine Vision Laser Market Size, (US$ Million), 2021 vs 2025 vs 2032
Figure 32. Global Machine Vision Laser Market Share by Region: 2025 vs 2032
Figure 33. Global Machine Vision Laser Market Share by Players in 2025
Figure 34. Global Machine Vision Laser Market Share by Company Type (Tier 1, Tier 2, and Tier 3)
Figure 35. The Top 10 and 5 Players Market Share by Machine Vision Laser Revenue in 2025
Figure 36. North America Machine Vision Laser Market Size YoY Growth (US$ Million), 2021–2032
Figure 37. North America Machine Vision Laser Market Share by Country (2021–2032)
Figure 38. United States Machine Vision Laser Market Size YoY Growth (US$ Million), 2021–2032
Figure 39. Canada Machine Vision Laser Market Size YoY Growth (US$ Million), 2021–2032
Figure 40. Europe Machine Vision Laser Market Size YoY Growth (US$ Million), 2021–2032
Figure 41. Europe Machine Vision Laser Market Share by Country (2021–2032)
Figure 42. Germany Machine Vision Laser Market Size YoY Growth (US$ Million), 2021–2032
Figure 43. France Machine Vision Laser Market Size YoY Growth (US$ Million), 2021–2032
Figure 44. U.K. Machine Vision Laser Market Size YoY Growth (US$ Million), 2021–2032
Figure 45. Italy Machine Vision Laser Market Size YoY Growth (US$ Million), 2021–2032
Figure 46. Russia Machine Vision Laser Market Size YoY Growth (US$ Million), 2021–2032
Figure 47. Ireland Machine Vision Laser Market Size YoY Growth (US$ Million), 2021–2032
Figure 48. Asia-Pacific Machine Vision Laser Market Size YoY Growth (US$ Million), 2021–2032
Figure 49. Asia-Pacific Machine Vision Laser Market Share by Region (2021–2032)
Figure 50. China Machine Vision Laser Market Size YoY Growth (US$ Million), 2021–2032
Figure 51. Japan Machine Vision Laser Market Size YoY Growth (US$ Million), 2021–2032
Figure 52. South Korea Machine Vision Laser Market Size YoY Growth (US$ Million), 2021–2032
Figure 53. Southeast Asia Machine Vision Laser Market Size YoY Growth (US$ Million), 2021–2032
Figure 54. India Machine Vision Laser Market Size YoY Growth (US$ Million), 2021–2032
Figure 55. Australia & New Zealand Machine Vision Laser Market Size YoY Growth (US$ Million), 2021–2032
Figure 56. Latin America Machine Vision Laser Market Size YoY Growth (US$ Million), 2021–2032
Figure 57. Latin America Machine Vision Laser Market Share by Country (2021–2032)
Figure 58. Mexico Machine Vision Laser Market Size YoY Growth (US$ Million), 2021–2032
Figure 59. Brazil Machine Vision Laser Market Size YoY Growth (US$ Million), 2021–2032
Figure 60. Middle East & Africa Machine Vision Laser Market Size YoY Growth (US$ Million), 2021–2032
Figure 61. Middle East & Africa Machine Vision Laser Market Share by Country (2021–2032)
Figure 62. Israel Machine Vision Laser Market Size YoY Growth (US$ Million), 2021–2032
Figure 63. Saudi Arabia Machine Vision Laser Market Size YoY Growth (US$ Million), 2021–2032
Figure 64. UAE Machine Vision Laser Market Size YoY Growth (US$ Million), 2021–2032
Figure 65. Cavitar Ltd. Revenue Growth Rate in Machine Vision Laser Business (2021–2026)
Figure 66. Laser Components GmbH Revenue Growth Rate in Machine Vision Laser Business (2021–2026)
Figure 67. Laserex Revenue Growth Rate in Machine Vision Laser Business (2021–2026)
Figure 68. ProPhotonix Revenue Growth Rate in Machine Vision Laser Business (2021–2026)
Figure 69. Z-Laser GmbH Revenue Growth Rate in Machine Vision Laser Business (2021–2026)
Figure 70. Schäfter+Kirchhoff Revenue Growth Rate in Machine Vision Laser Business (2021–2026)
Figure 71. Coherent Revenue Growth Rate in Machine Vision Laser Business (2021–2026)
Figure 72. Global Laser Solutions Revenue Growth Rate in Machine Vision Laser Business (2021–2026)
Figure 73. Power Technology, Inc Revenue Growth Rate in Machine Vision Laser Business (2021–2026)
Figure 74. Mxtlaser Revenue Growth Rate in Machine Vision Laser Business (2021–2026)
Figure 75. Osela Revenue Growth Rate in Machine Vision Laser Business (2021–2026)
Figure 76. Bottom-up and Top-down Approaches for This Report
Figure 77. Data Triangulation
Figure 78. Key Executives Interviewed