0
U.S. (TOLL FREE)
+1 (315) 215-3225
Automative

0
U.S. (TOLL FREE)
+1 (315) 215-3225
Porous Filter Powder- Global Market Share and Ranking, Overall Sales and Demand Forecast 2026-2032
Published Date: 2026-01-13
|
Report Code: QYRE-Auto-20S14258
Home | Market Reports | Business & Industrial| Chemicals Industry
Global Porous Filter Powder Market Research Report 2023
BUY CHAPTERS

Porous Filter Powder- Global Market Share and Ranking, Overall Sales and Demand Forecast 2026-2032

Code: QYRE-Auto-20S14258
Report
2026-01-13
Pages:90
QYResearch
Buy Now with 15% Discount
DESCRIPTION
TABLE OF CONTENT
TABLES & FIGURES

Porous Filter Powder- Market Size

The global market for Porous Filter Powder was estimated to be worth US$ 53.32 million in 2025 and is projected to reach US$ 69.17 million, growing at a CAGR of 3.8% from 2026 to 2032.

Porous Filter Powder- Market

Porous Filter Powder- Market

The potential shifts in the 2025 U.S. tariff framework pose substantial volatility risks to global markets. This report provides a comprehensive assessment of recent tariff adjustments and international strategic countermeasures on Porous Filter Powder cross-border industrial footprints, capital allocation patterns, regional economic interdependencies, and supply chain reconfigurations.
Porous Filter Powder refers to engineered metal powders whose particle size distribution (PSD), morphology, and chemistry are tailored to create a stable porous filtration structure. The powder can be used directly as a packed filtration medium (e.g., metal powder filter packs) or consolidated into sintered porous metal media, enabling controlled pore structure and consistent filtration performance.
Upstream, these powders are typically produced from iron-based stainless steels or corrosion-resistant alloys via melt processing followed by powder-making routes (commonly atomization) and classification/sieving to achieve target PSD. Downstream, porous filter powders mainly go into hot polymer melt filtration, where multi-layer packs of different grain sizes are designed for specific polymers and operating conditions; and sintered metal filters, where controlled sintering forms solid-state diffusion bonds between particles, delivering permanent porous media with controllable permeability and bubble point, suitable for harsh environments and in-situ cleaning such as blowback.
In 2025, global sales of Porous Filter Powder reached approximately 5,681 tons, with an average global market price of around US$ 9,386/ton. Production capacity varies significantly among manufacturers, with gross profit margins ranging from approximately 25% to 40%.
Demand for porous filter powders is anchored in two value chains: hot polymer melt filtration and sintered porous metal filtration for process industries. The former prioritizes cleanliness and stable pressure behavior under high-temperature, high-viscosity conditions, where particle morphology and size distribution govern pore architecture, permeability, and service life. The latter favors corrosion resistance, pressure capability, and regenerability, making stainless and high-alloy systems increasingly attractive where polymer or fiber-based media struggle.
Competition is less about “having powder” and more about delivering repeatable, predictable pore structures. Leading suppliers focus on controlled irregular particle shapes, tight distribution management, and low-impurity/low-oxygen quality, often paired with stronger alloy designs to reduce collapse and fragmentation during filtration. Increasingly, powders are sold as part of an integrated filtration-performance package alongside media design, sintering know-how, and regeneration strategies.
Key constraints include alloy and energy cost volatility, lengthy qualification cycles for consistency and traceability, and the growing use of reclamation/reuse practices in certain downstream systems that can dampen fresh purchasing. Overall, harsher duty, longer-life, and higher cleanliness applications tend to favor porous metal media, supporting structural upside for higher-end porous filter powders.
This report provides a comprehensive view of the global market for Porous Filter Powder, covering total sales volume, sales revenue, pricing, the market share and ranking of key companies, along with analyses by region & country, by Type, and by Application.
The Porous Filter Powder market size, estimations, and forecasts are presented in terms of sales volume (Tons) and revenue ($ millions), with 2025 as the base year and historical and forecast data from 2021 to 2032. The report combines quantitative and qualitative analysis to help readers develop growth strategies, assess the competitive landscape, evaluate their position in the current marketplace, and make informed business decisions regarding Porous Filter Powder.
Market Segmentation

Scope of Porous Filter Powder- Market Report

Report Metric Details
Report Name Porous Filter Powder- Market
CAGR 3.8%
Segment by Type
  • Stainless Steels
  • Ni-based Superalloys
  • Titanium Alloys
  • Other
Segment by Powder Production Route
  • High-pressure Water Atomized Powder
  • Inert Gas Atomized Powder
Segment by Particle Size Range
  • Coarse Cut
  • Medium Cut
  • Fine Cut
Segment by Application
  • Filter
  • Porous Electrode
  • Fire Extinguishing Device
  • Antifreeze Device
  • Other
By Region
  • North America (United States, Canada)
  • Europe (Germany, France, UK, Italy, Russia) Rest of Europe
  • Nordic Countries
  • Asia-Pacific (China, Japan, South Korea)
  • Southeast Asia (India, Australia)
  • Rest of Asia
  • Latin America (Mexico, Brazil)
  • Rest of Latin America
  • Middle East & Africa (Turkey, Saudi Arabia, UAE, Rest of MEA)
Consumption by Region
  • North America (United States, Canada)
  • Europe (Germany, France, UK, Italy, Russia)
  • Asia-Pacific (China, Japan, South Korea, Taiwan)
  • Southeast Asia (India)
  • Latin America (Mexico, Brazil)
By Company AMETEK Specialty Metal Products, Höganäs, Sandvik, HLPOWDER, Hebei Zerich Industrial
Forecast units USD million in value
Report coverage Revenue and volume forecast, company share, competitive landscape, growth factors and trends

Chapter Outline

  • Chapter 1: Introduces the scope of the report and the global market size (value, volume, and price). It also summarizes market dynamics and Recent Developments; identifies key drivers and restraints; outlines challenges and risks for manufacturers; reviews relevant industry policies and U.S. tariff implications.
  • Chapter 2: Provides a detailed analysis of the Porous Filter Powder manufacturers' competitive landscape—including pricing, sales and revenue shares, Recent Developments plans, and mergers and acquisitions (M&A).
  • Chapter 3: Analyzes market segmentation by Type, presenting the size and growth potential of each segment to help readers identify blue-ocean opportunities.
  • Chapter 4: Analyzes market segmentation by Application, presenting the size and growth potential of each downstream segment to help readers identify blue-ocean opportunities.
  • Chapter 5: Presents Porous Filter Powder sales and revenue at the regional level. It offers a quantitative assessment of market size and growth potential by region and summarizes market development, future prospects, addressable space, and country-level market size worldwide.
  • Chapter 6: Presents Porous Filter Powder sales and revenue at the country level. It provides segmented data by Type and by Application for each country/region.
  • Chapter 7: Profiles key players, detailing the main companies' product sales, revenue, pricing, gross margin, product portfolios, Recent Developments, etc.
  • Chapter 8: Analyzes the industry value chain, including upstream suppliers and downstream applications/customers.
  • Chapter 9: Conclusion.

FAQ for this report

Who are the main players in the Porous Filter Powder- Market report?

Ans: The main players in the Porous Filter Powder- Market are AMETEK Specialty Metal Products, Höganäs, Sandvik, HLPOWDER, Hebei Zerich Industrial

What are the Application segmentation covered in the Porous Filter Powder- Market report?

Ans: The Applications covered in the Porous Filter Powder- Market report are Filter, Porous Electrode, Fire Extinguishing Device, Antifreeze Device, Other

What are the Type segmentation covered in the Porous Filter Powder- Market report?

Ans: The Types covered in the Porous Filter Powder- Market report are Stainless Steels, Ni-based Superalloys, Titanium Alloys, Other

1 Market Overview
1.1 Porous Filter Powder Product Introduction
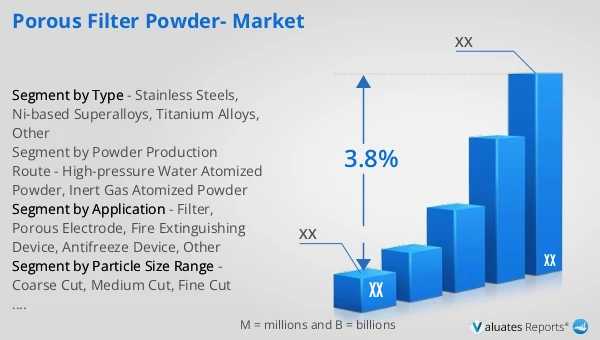
1.2 Global Porous Filter Powder Market Size Forecast
1.2.1 Global Porous Filter Powder Sales Value (2021–2032)
1.2.2 Global Porous Filter Powder Sales Volume (2021–2032)
1.2.3 Global Porous Filter Powder Sales Price (2021–2032)
1.3 Porous Filter Powder Market Trends & Drivers
1.3.1 Porous Filter Powder Industry Trends
1.3.2 Porous Filter Powder Market Drivers & Opportunities
1.3.3 Porous Filter Powder Market Challenges
1.3.4 Porous Filter Powder Market Restraints
1.3.5 Impact of U.S. Tariffs
1.4 Assumptions and Limitations
1.5 Study Objectives
1.6 Years Considered
2 Competitive Analysis by Company
2.1 Global Porous Filter Powder Players Revenue Ranking (2025)
2.2 Global Porous Filter Powder Revenue by Company (2021–2026)
2.3 Global Porous Filter Powder Sales Volume Ranking of Players (2025)
2.4 Global Porous Filter Powder Sales Volume by Company (2021–2026)
2.5 Global Porous Filter Powder Average Price by Company (2021–2026)
2.6 Key Manufacturers Porous Filter Powder Manufacturing Base and Headquarters
2.7 Key Manufacturers Porous Filter Powder Product Offerings
2.8 Key Manufacturers Start of Mass Production of Porous Filter Powder
2.9 Porous Filter Powder Market Competitive Analysis
2.9.1 Porous Filter Powder Market Concentration Rate (2021–2026)
2.9.2 Global 5 and 10 Largest Manufacturers by Porous Filter Powder Revenue in 2025
2.9.3 Global Companies by Tier (Tier 1, Tier 2, Tier 3), based on Porous Filter Powder revenue, 2025
2.10 Mergers & Acquisitions and Expansion
3 Segmentation Porous Filter Powder Market Classification
3.1 Introduction by Type
3.1.1 Stainless Steels
3.1.2 Ni-based Superalloys
3.1.3 Titanium Alloys
3.1.4 Other
3.1.5 Global Porous Filter Powder Sales Value by Type
3.1.5.1 Global Porous Filter Powder Sales Value by Type (2021 vs 2025 vs 2032)
3.1.5.2 Global Porous Filter Powder Sales Value, by Type (2021–2032)
3.1.5.3 Global Porous Filter Powder Sales Value, by Type (%), 2021–2032
3.1.6 Global Porous Filter Powder Sales Volume by Type
3.1.6.1 Global Porous Filter Powder Sales Volume by Type (2021 vs 2025 vs 2032)
3.1.6.2 Global Porous Filter Powder Sales Volume, by Type (2021–2032)
3.1.6.3 Global Porous Filter Powder Sales Volume, by Type (%), 2021–2032
3.1.7 Global Porous Filter Powder Average Price by Type (2021–2032)
3.2 Introduction by Powder Production Route
3.2.1 High-pressure Water Atomized Powder
3.2.2 Inert Gas Atomized Powder
3.2.3 Global Porous Filter Powder Sales Value by Powder Production Route
3.2.3.1 Global Porous Filter Powder Sales Value by Powder Production Route (2021 vs 2025 vs 2032)
3.2.3.2 Global Porous Filter Powder Sales Value, by Powder Production Route (2021–2032)
3.2.3.3 Global Porous Filter Powder Sales Value, by Powder Production Route (%), 2021–2032
3.2.4 Global Porous Filter Powder Sales Volume by Powder Production Route
3.2.4.1 Global Porous Filter Powder Sales Volume by Powder Production Route (2021 vs 2025 vs 2032)
3.2.4.2 Global Porous Filter Powder Sales Volume, by Powder Production Route (2021–2032)
3.2.4.3 Global Porous Filter Powder Sales Volume, by Powder Production Route (%), 2021–2032
3.2.5 Global Porous Filter Powder Average Price by Powder Production Route (2021–2032)
3.3 Introduction by Particle Size Range
3.3.1 Coarse Cut
3.3.2 Medium Cut
3.3.3 Fine Cut
3.3.4 Global Porous Filter Powder Sales Value by Particle Size Range
3.3.4.1 Global Porous Filter Powder Sales Value by Particle Size Range (2021 vs 2025 vs 2032)
3.3.4.2 Global Porous Filter Powder Sales Value, by Particle Size Range (2021–2032)
3.3.4.3 Global Porous Filter Powder Sales Value, by Particle Size Range (%), 2021–2032
3.3.5 Global Porous Filter Powder Sales Volume by Particle Size Range
3.3.5.1 Global Porous Filter Powder Sales Volume by Particle Size Range (2021 vs 2025 vs 2032)
3.3.5.2 Global Porous Filter Powder Sales Volume, by Particle Size Range (2021–2032)
3.3.5.3 Global Porous Filter Powder Sales Volume, by Particle Size Range (%), 2021–2032
3.3.6 Global Porous Filter Powder Average Price by Particle Size Range (2021–2032)
4 Segmentation by Application
4.1 Introduction by Application
4.1.1 Filter
4.1.2 Porous Electrode
4.1.3 Fire Extinguishing Device
4.1.4 Antifreeze Device
4.1.5 Other
4.2 Global Porous Filter Powder Sales Value by Application
4.2.1 Global Porous Filter Powder Sales Value by Application (2021 vs 2025 vs 2032)
4.2.2 Global Porous Filter Powder Sales Value, by Application (2021–2032)
4.2.3 Global Porous Filter Powder Sales Value, by Application (%), 2021–2032
4.3 Global Porous Filter Powder Sales Volume by Application
4.3.1 Global Porous Filter Powder Sales Volume by Application (2021 vs 2025 vs 2032)
4.3.2 Global Porous Filter Powder Sales Volume, by Application (2021–2032)
4.3.3 Global Porous Filter Powder Sales Volume, by Application (%), 2021–2032
4.4 Global Porous Filter Powder Average Price by Application (2021–2032)
5 Segmentation by Region
5.1 Global Porous Filter Powder Sales Value by Region
5.1.1 Global Porous Filter Powder Sales Value by Region: 2021 vs 2025 vs 2032
5.1.2 Global Porous Filter Powder Sales Value by Region (2021–2026)
5.1.3 Global Porous Filter Powder Sales Value by Region (2027–2032)
5.1.4 Global Porous Filter Powder Sales Value by Region (%), 2021–2032
5.2 Global Porous Filter Powder Sales Volume by Region
5.2.1 Global Porous Filter Powder Sales Volume by Region: 2021 vs 2025 vs 2032
5.2.2 Global Porous Filter Powder Sales Volume by Region (2021–2026)
5.2.3 Global Porous Filter Powder Sales Volume by Region (2027–2032)
5.2.4 Global Porous Filter Powder Sales Volume by Region (%), 2021–2032
5.3 Global Porous Filter Powder Average Price by Region (2021–2032)
5.4 North America
5.4.1 North America Porous Filter Powder Sales Value, 2021–2032
5.4.2 North America Porous Filter Powder Sales Value by Country (%), 2025 vs 2032
5.5 Europe
5.5.1 Europe Porous Filter Powder Sales Value, 2021–2032
5.5.2 Europe Porous Filter Powder Sales Value by Country (%), 2025 vs 2032
5.6 Asia Pacific
5.6.1 Asia Pacific Porous Filter Powder Sales Value, 2021–2032
5.6.2 Asia Pacific Porous Filter Powder Sales Value by Region (%), 2025 vs 2032
5.7 South America
5.7.1 South America Porous Filter Powder Sales Value, 2021–2032
5.7.2 South America Porous Filter Powder Sales Value by Country (%), 2025 vs 2032
5.8 Middle East & Africa
5.8.1 Middle East & Africa Porous Filter Powder Sales Value, 2021–2032
5.8.2 Middle East & Africa Porous Filter Powder Sales Value by Country (%), 2025 vs 2032
6 Segmentation by Key Countries/Regions
6.1 Key Countries/Regions Porous Filter Powder Sales Value Growth Trends, 2021 vs 2025 vs 2032
6.2 Key Countries/Regions Porous Filter Powder Sales Value and Sales Volume
6.2.1 Key Countries/Regions Porous Filter Powder Sales Value, 2021–2032
6.2.2 Key Countries/Regions Porous Filter Powder Sales Volume, 2021–2032
6.3 United States
6.3.1 United States Porous Filter Powder Sales Value, 2021–2032
6.3.2 United States Porous Filter Powder Sales Value by Type (%), 2025 vs 2032
6.3.3 United States Porous Filter Powder Sales Value by Application, 2025 vs 2032
6.4 Europe
6.4.1 Europe Porous Filter Powder Sales Value, 2021–2032
6.4.2 Europe Porous Filter Powder Sales Value by Type (%), 2025 vs 2032
6.4.3 Europe Porous Filter Powder Sales Value by Application, 2025 vs 2032
6.5 China
6.5.1 China Porous Filter Powder Sales Value, 2021–2032
6.5.2 China Porous Filter Powder Sales Value by Type (%), 2025 vs 2032
6.5.3 China Porous Filter Powder Sales Value by Application, 2025 vs 2032
6.6 Japan
6.6.1 Japan Porous Filter Powder Sales Value, 2021–2032
6.6.2 Japan Porous Filter Powder Sales Value by Type (%), 2025 vs 2032
6.6.3 Japan Porous Filter Powder Sales Value by Application, 2025 vs 2032
6.7 South Korea
6.7.1 South Korea Porous Filter Powder Sales Value, 2021–2032
6.7.2 South Korea Porous Filter Powder Sales Value by Type (%), 2025 vs 2032
6.7.3 South Korea Porous Filter Powder Sales Value by Application, 2025 vs 2032
6.8 Southeast Asia
6.8.1 Southeast Asia Porous Filter Powder Sales Value, 2021–2032
6.8.2 Southeast Asia Porous Filter Powder Sales Value by Type (%), 2025 vs 2032
6.8.3 Southeast Asia Porous Filter Powder Sales Value by Application, 2025 vs 2032
6.9 India
6.9.1 India Porous Filter Powder Sales Value, 2021–2032
6.9.2 India Porous Filter Powder Sales Value by Type (%), 2025 vs 2032
6.9.3 India Porous Filter Powder Sales Value by Application, 2025 vs 2032
7 Company Profiles
7.1 AMETEK Specialty Metal Products
7.1.1 AMETEK Specialty Metal Products Company Information
7.1.2 AMETEK Specialty Metal Products Introduction and Business Overview
7.1.3 AMETEK Specialty Metal Products Porous Filter Powder Sales, Revenue, Price and Gross Margin (2021–2026)
7.1.4 AMETEK Specialty Metal Products Porous Filter Powder Product Offerings
7.1.5 AMETEK Specialty Metal Products Recent Developments
7.2 Höganäs
7.2.1 Höganäs Company Information
7.2.2 Höganäs Introduction and Business Overview
7.2.3 Höganäs Porous Filter Powder Sales, Revenue, Price and Gross Margin (2021–2026)
7.2.4 Höganäs Porous Filter Powder Product Offerings
7.2.5 Höganäs Recent Developments
7.3 Sandvik
7.3.1 Sandvik Company Information
7.3.2 Sandvik Introduction and Business Overview
7.3.3 Sandvik Porous Filter Powder Sales, Revenue, Price and Gross Margin (2021–2026)
7.3.4 Sandvik Porous Filter Powder Product Offerings
7.3.5 Sandvik Recent Developments
7.4 HLPOWDER
7.4.1 HLPOWDER Company Information
7.4.2 HLPOWDER Introduction and Business Overview
7.4.3 HLPOWDER Porous Filter Powder Sales, Revenue, Price and Gross Margin (2021–2026)
7.4.4 HLPOWDER Porous Filter Powder Product Offerings
7.4.5 HLPOWDER Recent Developments
7.5 Hebei Zerich Industrial
7.5.1 Hebei Zerich Industrial Company Information
7.5.2 Hebei Zerich Industrial Introduction and Business Overview
7.5.3 Hebei Zerich Industrial Porous Filter Powder Sales, Revenue, Price and Gross Margin (2021–2026)
7.5.4 Hebei Zerich Industrial Porous Filter Powder Product Offerings
7.5.5 Hebei Zerich Industrial Recent Developments
8 Industry Chain Analysis
8.1 Porous Filter Powder Industrial Chain
8.2 Porous Filter Powder Upstream Analysis
8.2.1 Key Raw Materials
8.2.2 Key Suppliers of Raw Materials
8.2.3 Manufacturing Cost Structure
8.3 Midstream Analysis
8.4 Downstream Analysis (Customer Analysis)
8.5 Sales Model and Sales Channelss
8.5.1 Porous Filter Powder Sales Model
8.5.2 Sales Channels
8.5.3 Porous Filter Powder Distributors
9 Research Findings and Conclusion
10 Appendix
10.1 Research Methodology
10.1.1 Methodology/Research Approach
10.1.1.1 Research Programs/Design
10.1.1.2 Market Size Estimation
10.1.1.3 Market Breakdown and Data Triangulation
10.1.2 Data Source
10.1.2.1 Secondary Sources
10.1.2.2 Primary Sources
10.2 Author Details
10.3 Disclaimer
List of Tables
 Table 1. Porous Filter Powder Market Trends
 Table 2. Porous Filter Powder Market Drivers & Opportunities
 Table 3. Porous Filter Powder Market Challenges
 Table 4. Porous Filter Powder Market Restraints


List of Figures
 Figure 1. Porous Filter Powder Product Picture
 Figure 2. Global Porous Filter Powder Sales Value, 2021 vs 2025 vs 2032 (US$ Million)
 Figure 3. Global Porous Filter Powder Sales Value (US$ Million), 2021–2032
 Figure 4. Global Porous Filter Powder Sales Volume (Tons), 2021–2032
 Figure 5. Global Porous Filter Powder Sales Price (US$/Ton), 2021–2032
 Figure 6. Porous Filter Powder Report Years Considered
 Figure 7. Global Porous Filter Powder Players Revenue Ranking (US$ Million), 2025
 Figure 8. Global Porous Filter Powder Sales Volume Ranking of Players (Tons), 2025
 Figure 9. The 5 and 10 Largest Manufacturers in the World: Market Share by Porous Filter Powder Revenue in 2025
 Figure 10. Porous Filter Powder Market Share by Company Type (Tier 1, Tier 2, and Tier 3): 2021 vs 2025
 Figure 11. Stainless Steels Picture
 Figure 12. Ni-based Superalloys Picture
 Figure 13. Titanium Alloys Picture
 Figure 14. Other Picture
 Figure 15. Global Porous Filter Powder Sales Value by Type (US$ Million), 2021 vs 2025 vs 2032
 Figure 16. Global Porous Filter Powder Sales Value Market Share by Type, 2025 & 2032
 Figure 17. Global Porous Filter Powder Sales Volume by Type (Tons), 2021 vs 2025 vs 2032
 Figure 18. Global Porous Filter Powder Sales Volume Market Share by Type, 2025 & 2032
 Figure 19. Global Porous Filter Powder Price by Type (US$/Ton), 2021–2032
 Figure 20. High-pressure Water Atomized Powder Picture
 Figure 21. Inert Gas Atomized Powder Picture
 Figure 22. Global Porous Filter Powder Sales Value by Powder Production Route (US$ Million), 2021 vs 2025 vs 2032
 Figure 23. Global Porous Filter Powder Sales Value Market Share by Powder Production Route, 2025 & 2032
 Figure 24. Global Porous Filter Powder Sales Volume by Powder Production Route (Tons), 2021 vs 2025 vs 2032
 Figure 25. Global Porous Filter Powder Sales Volume Market Share by Powder Production Route, 2025 & 2032
 Figure 26. Global Porous Filter Powder Price by Powder Production Route (US$/Ton), 2021–2032
 Figure 27. Coarse Cut Picture
 Figure 28. Medium Cut Picture
 Figure 29. Fine Cut Picture
 Figure 30. Global Porous Filter Powder Sales Value by Particle Size Range (US$ Million), 2021 vs 2025 vs 2032
 Figure 31. Global Porous Filter Powder Sales Value Market Share by Particle Size Range, 2025 & 2032
 Figure 32. Global Porous Filter Powder Sales Volume by Particle Size Range (Tons), 2021 vs 2025 vs 2032
 Figure 33. Global Porous Filter Powder Sales Volume Market Share by Particle Size Range, 2025 & 2032
 Figure 34. Global Porous Filter Powder Price by Particle Size Range (US$/Ton), 2021–2032
 Figure 35. Product Picture of Filter
 Figure 36. Product Picture of Porous Electrode
 Figure 37. Product Picture of Fire Extinguishing Device
 Figure 38. Product Picture of Antifreeze Device
 Figure 39. Product Picture of Other
 Figure 40. Global Porous Filter Powder Sales Value by Application (US$ Million), 2021 vs 2025 vs 2032
 Figure 41. Global Porous Filter Powder Sales Value Market Share by Application, 2025 & 2032
 Figure 42. Global Porous Filter Powder Sales Volume by Application (Tons), 2021 vs 2025 vs 2032
 Figure 43. Global Porous Filter Powder Sales Volume Market Share by Application, 2025 & 2032
 Figure 44. Global Porous Filter Powder Price by Application (US$/Ton), 2021–2032
 Figure 45. North America Porous Filter Powder Sales Value (US$ Million), 2021–2032
 Figure 46. North America Porous Filter Powder Sales Value by Country (%), 2025 vs 2032
 Figure 47. Europe Porous Filter Powder Sales Value (US$ Million), 2021–2032
 Figure 48. Europe Porous Filter Powder Sales Value by Country (%), 2025 vs 2032
 Figure 49. Asia Pacific Porous Filter Powder Sales Value (US$ Million), 2021–2032
 Figure 50. Asia Pacific Porous Filter Powder Sales Value by Region (%), 2025 vs 2032
 Figure 51. South America Porous Filter Powder Sales Value (US$ Million), 2021–2032
 Figure 52. South America Porous Filter Powder Sales Value by Country (%), 2025 vs 2032
 Figure 53. Middle East & Africa Porous Filter Powder Sales Value (US$ Million), 2021–2032
 Figure 54. Middle East & Africa Porous Filter Powder Sales Value by Country (%), 2025 vs 2032
 Figure 55. Key Countries/Regions Porous Filter Powder Sales Value (%), 2021–2032
 Figure 56. Key Countries/Regions Porous Filter Powder Sales Volume (%), 2021–2032
 Figure 57. United States Porous Filter Powder Sales Value (US$ Million), 2021–2032
 Figure 58. United States Porous Filter Powder Sales Value by Type (%), 2025 vs 2032
 Figure 59. United States Porous Filter Powder Sales Value by Application (%), 2025 vs 2032
 Figure 60. Europe Porous Filter Powder Sales Value (US$ Million), 2021–2032
 Figure 61. Europe Porous Filter Powder Sales Value by Type (%), 2025 vs 2032
 Figure 62. Europe Porous Filter Powder Sales Value by Application (%), 2025 vs 2032
 Figure 63. China Porous Filter Powder Sales Value (US$ Million), 2021–2032
 Figure 64. China Porous Filter Powder Sales Value by Type (%), 2025 vs 2032
 Figure 65. China Porous Filter Powder Sales Value by Application (%), 2025 vs 2032
 Figure 66. Japan Porous Filter Powder Sales Value (US$ Million), 2021–2032
 Figure 67. Japan Porous Filter Powder Sales Value by Type (%), 2025 vs 2032
 Figure 68. Japan Porous Filter Powder Sales Value by Application (%), 2025 vs 2032
 Figure 69. South Korea Porous Filter Powder Sales Value (US$ Million), 2021–2032
 Figure 70. South Korea Porous Filter Powder Sales Value by Type (%), 2025 vs 2032
 Figure 71. South Korea Porous Filter Powder Sales Value by Application (%), 2025 vs 2032
 Figure 72. Southeast Asia Porous Filter Powder Sales Value (US$ Million), 2021–2032
 Figure 73. Southeast Asia Porous Filter Powder Sales Value by Type (%), 2025 vs 2032
 Figure 74. Southeast Asia Porous Filter Powder Sales Value by Application (%), 2025 vs 2032
 Figure 75. India Porous Filter Powder Sales Value (US$ Million), 2021–2032
 Figure 76. India Porous Filter Powder Sales Value by Type (%), 2025 vs 2032
 Figure 77. India Porous Filter Powder Sales Value by Application (%), 2025 vs 2032
 Figure 78. Porous Filter Powder Industrial Chain
 Figure 79. Porous Filter Powder Manufacturing Cost Structure
 Figure 80. Channels of Distribution (Direct Sales, and Distribution)
 Figure 81. Bottom-up and Top-down Approaches for This Report
 Figure 82. Data Triangulation
 Figure 83. Key Executives Interviewed
SELECT A FORMAT
Added to Cart
Electronic

$3950

Single User License
Electronic

$5925

Multi User License
Electronic

$7900

Enterprise License
Add to Cart
Buy Now (15% Discount)

OUR CUSTOMER

Lukasiewicz Research Network