List of Tables
Table 1. Medical Beauty Equipment And Consumables Market Trends
Table 2. Medical Beauty Equipment And Consumables Market Drivers & Opportunity
Table 3. Medical Beauty Equipment And Consumables Market Challenges
Table 4. Medical Beauty Equipment And Consumables Market Restraints
Table 5. Global Medical Beauty Equipment And Consumables Revenue by Company (2019-2024) & (US$ Million)
Table 6. Global Medical Beauty Equipment And Consumables Revenue Market Share by Company (2019-2024)
Table 7. Key Companies Medical Beauty Equipment And Consumables Manufacturing Base Distribution and Headquarters
Table 8. Key Companies Medical Beauty Equipment And Consumables Product Type
Table 9. Key Companies Time to Begin Mass Production of Medical Beauty Equipment And Consumables
Table 10. Global Medical Beauty Equipment And Consumables Companies Market Concentration Ratio (CR5 and HHI)
Table 11. Global Top Companies Market Share by Company Type (Tier 1, Tier 2, and Tier 3) & (based on the Revenue in Medical Beauty Equipment And Consumables as of 2023)
Table 12. Mergers & Acquisitions, Expansion Plans
Table 13. Global Medical Beauty Equipment And Consumables Sales Value by Type: 2019 VS 2023 VS 2030 (US$ Million)
Table 14. Global Medical Beauty Equipment And Consumables Sales Value by Type (2019-2024) & (US$ Million)
Table 15. Global Medical Beauty Equipment And Consumables Sales Value by Type (2025-2030) & (US$ Million)
Table 16. Global Medical Beauty Equipment And Consumables Sales Market Share in Value by Type (2019-2024) & (%)
Table 17. Global Medical Beauty Equipment And Consumables Sales Market Share in Value by Type (2025-2030) & (%)
Table 18. Global Medical Beauty Equipment And Consumables Sales Value by Application: 2019 VS 2023 VS 2030 (US$ Million)
Table 19. Global Medical Beauty Equipment And Consumables Sales Value by Application (2019-2024) & (US$ Million)
Table 20. Global Medical Beauty Equipment And Consumables Sales Value by Application (2025-2030) & (US$ Million)
Table 21. Global Medical Beauty Equipment And Consumables Sales Market Share in Value by Application (2019-2024) & (%)
Table 22. Global Medical Beauty Equipment And Consumables Sales Market Share in Value by Application (2025-2030) & (%)
Table 23. Global Medical Beauty Equipment And Consumables Sales Value by Region: 2019 VS 2023 VS 2030 (US$ Million)
Table 24. Global Medical Beauty Equipment And Consumables Sales Value by Region (2019-2024) & (US$ Million)
Table 25. Global Medical Beauty Equipment And Consumables Sales Value by Region (2025-2030) & (US$ Million)
Table 26. Global Medical Beauty Equipment And Consumables Sales Value by Region (2019-2024) & (%)
Table 27. Global Medical Beauty Equipment And Consumables Sales Value by Region (2025-2030) & (%)
Table 28. Key Countries/Regions Medical Beauty Equipment And Consumables Sales Value Growth Trends, (US$ Million): 2019 VS 2023 VS 2030
Table 29. Key Countries/Regions Medical Beauty Equipment And Consumables Sales Value, (2019-2024) & (US$ Million)
Table 30. Key Countries/Regions Medical Beauty Equipment And Consumables Sales Value, (2025-2030) & (US$ Million)
Table 31. Ipsen Pharma Basic Information List
Table 32. Ipsen Pharma Description and Business Overview
Table 33. Ipsen Pharma Medical Beauty Equipment And Consumables Products, Services and Solutions
Table 34. Revenue (US$ Million) in Medical Beauty Equipment And Consumables Business of Ipsen Pharma (2019-2024)
Table 35. Ipsen Pharma Recent Developments
Table 36. QMed Innovations, Inc. Basic Information List
Table 37. QMed Innovations, Inc. Description and Business Overview
Table 38. QMed Innovations, Inc. Medical Beauty Equipment And Consumables Products, Services and Solutions
Table 39. Revenue (US$ Million) in Medical Beauty Equipment And Consumables Business of QMed Innovations, Inc. (2019-2024)
Table 40. QMed Innovations, Inc. Recent Developments
Table 41. AbbVie Inc. Basic Information List
Table 42. AbbVie Inc. Description and Business Overview
Table 43. AbbVie Inc. Medical Beauty Equipment And Consumables Products, Services and Solutions
Table 44. Revenue (US$ Million) in Medical Beauty Equipment And Consumables Business of AbbVie Inc. (2019-2024)
Table 45. AbbVie Inc. Recent Developments
Table 46. Syneron Medical Basic Information List
Table 47. Syneron Medical Description and Business Overview
Table 48. Syneron Medical Medical Beauty Equipment And Consumables Products, Services and Solutions
Table 49. Revenue (US$ Million) in Medical Beauty Equipment And Consumables Business of Syneron Medical (2019-2024)
Table 50. Syneron Medical Recent Developments
Table 51. Cynosure Basic Information List
Table 52. Cynosure Description and Business Overview
Table 53. Cynosure Medical Beauty Equipment And Consumables Products, Services and Solutions
Table 54. Revenue (US$ Million) in Medical Beauty Equipment And Consumables Business of Cynosure (2019-2024)
Table 55. Cynosure Recent Developments
Table 56. Lumenis Basic Information List
Table 57. Lumenis Description and Business Overview
Table 58. Lumenis Medical Beauty Equipment And Consumables Products, Services and Solutions
Table 59. Revenue (US$ Million) in Medical Beauty Equipment And Consumables Business of Lumenis (2019-2024)
Table 60. Lumenis Recent Developments
Table 61. Sisram Medical Ltd. Basic Information List
Table 62. Sisram Medical Ltd. Description and Business Overview
Table 63. Sisram Medical Ltd. Medical Beauty Equipment And Consumables Products, Services and Solutions
Table 64. Revenue (US$ Million) in Medical Beauty Equipment And Consumables Business of Sisram Medical Ltd. (2019-2024)
Table 65. Sisram Medical Ltd. Recent Developments
Table 66. Solta Medical Basic Information List
Table 67. Solta Medical Description and Business Overview
Table 68. Solta Medical Medical Beauty Equipment And Consumables Products, Services and Solutions
Table 69. Revenue (US$ Million) in Medical Beauty Equipment And Consumables Business of Solta Medical (2019-2024)
Table 70. Solta Medical Recent Developments
Table 71. Canfield Scientific Basic Information List
Table 72. Canfield Scientific Description and Business Overview
Table 73. Canfield Scientific Medical Beauty Equipment And Consumables Products, Services and Solutions
Table 74. Revenue (US$ Million) in Medical Beauty Equipment And Consumables Business of Canfield Scientific (2019-2024)
Table 75. Canfield Scientific Recent Developments
Table 76. Innofaith Basic Information List
Table 77. Innofaith Description and Business Overview
Table 78. Innofaith Medical Beauty Equipment And Consumables Products, Services and Solutions
Table 79. Revenue (US$ Million) in Medical Beauty Equipment And Consumables Business of Innofaith (2019-2024)
Table 80. Innofaith Recent Developments
Table 81. Fotona Basic Information List
Table 82. Fotona Description and Business Overview
Table 83. Fotona Medical Beauty Equipment And Consumables Products, Services and Solutions
Table 84. Revenue (US$ Million) in Medical Beauty Equipment And Consumables Business of Fotona (2019-2024)
Table 85. Fotona Recent Developments
Table 86. GSD Aesthetic Basic Information List
Table 87. GSD Aesthetic Description and Business Overview
Table 88. GSD Aesthetic Medical Beauty Equipment And Consumables Products, Services and Solutions
Table 89. Revenue (US$ Million) in Medical Beauty Equipment And Consumables Business of GSD Aesthetic (2019-2024)
Table 90. GSD Aesthetic Recent Developments
Table 91. KINGLASER Basic Information List
Table 92. KINGLASER Description and Business Overview
Table 93. KINGLASER Medical Beauty Equipment And Consumables Products, Services and Solutions
Table 94. Revenue (US$ Million) in Medical Beauty Equipment And Consumables Business of KINGLASER (2019-2024)
Table 95. KINGLASER Recent Developments
Table 96. Shanghai Fosun Pharmaceutical Group Basic Information List
Table 97. Shanghai Fosun Pharmaceutical Group Description and Business Overview
Table 98. Shanghai Fosun Pharmaceutical Group Medical Beauty Equipment And Consumables Products, Services and Solutions
Table 99. Revenue (US$ Million) in Medical Beauty Equipment And Consumables Business of Shanghai Fosun Pharmaceutical Group (2019-2024)
Table 100. Shanghai Fosun Pharmaceutical Group Recent Developments
Table 101. Hangzhou Kraton Biological Products Co., Ltd. Basic Information List
Table 102. Hangzhou Kraton Biological Products Co., Ltd. Description and Business Overview
Table 103. Hangzhou Kraton Biological Products Co., Ltd. Medical Beauty Equipment And Consumables Products, Services and Solutions
Table 104. Revenue (US$ Million) in Medical Beauty Equipment And Consumables Business of Hangzhou Kraton Biological Products Co., Ltd. (2019-2024)
Table 105. Hangzhou Kraton Biological Products Co., Ltd. Recent Developments
Table 106. Shenzhen Jisdi Technology Co., Ltd. Basic Information List
Table 107. Shenzhen Jisdi Technology Co., Ltd. Description and Business Overview
Table 108. Shenzhen Jisdi Technology Co., Ltd. Medical Beauty Equipment And Consumables Products, Services and Solutions
Table 109. Revenue (US$ Million) in Medical Beauty Equipment And Consumables Business of Shenzhen Jisdi Technology Co., Ltd. (2019-2024)
Table 110. Shenzhen Jisdi Technology Co., Ltd. Recent Developments
Table 111. Lepu Biotechnology Co., Ltd. Basic Information List
Table 112. Lepu Biotechnology Co., Ltd. Description and Business Overview
Table 113. Lepu Biotechnology Co., Ltd. Medical Beauty Equipment And Consumables Products, Services and Solutions
Table 114. Revenue (US$ Million) in Medical Beauty Equipment And Consumables Business of Lepu Biotechnology Co., Ltd. (2019-2024)
Table 115. Lepu Biotechnology Co., Ltd. Recent Developments
Table 116. Lanzhou Institute of Biological Products Co., Ltd. Basic Information List
Table 117. Lanzhou Institute of Biological Products Co., Ltd. Description and Business Overview
Table 118. Lanzhou Institute of Biological Products Co., Ltd. Medical Beauty Equipment And Consumables Products, Services and Solutions
Table 119. Revenue (US$ Million) in Medical Beauty Equipment And Consumables Business of Lanzhou Institute of Biological Products Co., Ltd. (2019-2024)
Table 120. Lanzhou Institute of Biological Products Co., Ltd. Recent Developments
Table 121. Peninsula Medical Basic Information List
Table 122. Peninsula Medical Description and Business Overview
Table 123. Peninsula Medical Medical Beauty Equipment And Consumables Products, Services and Solutions
Table 124. Revenue (US$ Million) in Medical Beauty Equipment And Consumables Business of Peninsula Medical (2019-2024)
Table 125. Peninsula Medical Recent Developments
Table 126. Bloomage Biotechnology Co., Ltd. Basic Information List
Table 127. Bloomage Biotechnology Co., Ltd. Description and Business Overview
Table 128. Bloomage Biotechnology Co., Ltd. Medical Beauty Equipment And Consumables Products, Services and Solutions
Table 129. Revenue (US$ Million) in Medical Beauty Equipment And Consumables Business of Bloomage Biotechnology Co., Ltd. (2019-2024)
Table 130. Bloomage Biotechnology Co., Ltd. Recent Developments
Table 131. Huadong Pharmaceutical Co., Ltd. Basic Information List
Table 132. Huadong Pharmaceutical Co., Ltd. Description and Business Overview
Table 133. Huadong Pharmaceutical Co., Ltd. Medical Beauty Equipment And Consumables Products, Services and Solutions
Table 134. Revenue (US$ Million) in Medical Beauty Equipment And Consumables Business of Huadong Pharmaceutical Co., Ltd. (2019-2024)
Table 135. Huadong Pharmaceutical Co., Ltd. Recent Developments
Table 136. Wuhan Miracle Laser Systems, Inc. Basic Information List
Table 137. Wuhan Miracle Laser Systems, Inc. Description and Business Overview
Table 138. Wuhan Miracle Laser Systems, Inc. Medical Beauty Equipment And Consumables Products, Services and Solutions
Table 139. Revenue (US$ Million) in Medical Beauty Equipment And Consumables Business of Wuhan Miracle Laser Systems, Inc. (2019-2024)
Table 140. Wuhan Miracle Laser Systems, Inc. Recent Developments
Table 141. Andre Group Basic Information List
Table 142. Andre Group Description and Business Overview
Table 143. Andre Group Medical Beauty Equipment And Consumables Products, Services and Solutions
Table 144. Revenue (US$ Million) in Medical Beauty Equipment And Consumables Business of Andre Group (2019-2024)
Table 145. Andre Group Recent Developments
Table 146. Key Raw Materials Lists
Table 147. Raw Materials Key Suppliers Lists
Table 148. Medical Beauty Equipment And Consumables Downstream Customers
Table 149. Medical Beauty Equipment And Consumables Distributors List
Table 150. Research Programs/Design for This Report
Table 151. Key Data Information from Secondary Sources
Table 152. Key Data Information from Primary Sources
Table 153. Business Unit and Senior & Team Lead Analysts
List of Figures
Figure 1. Medical Beauty Equipment And Consumables Product Picture
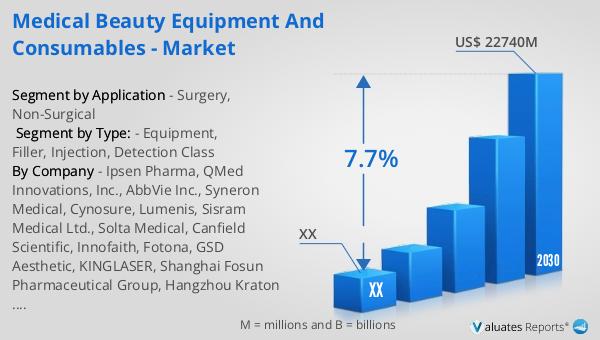
Figure 2. Global Medical Beauty Equipment And Consumables Sales Value, 2019 VS 2023 VS 2030 (US$ Million)
Figure 3. Global Medical Beauty Equipment And Consumables Sales Value (2019-2030) & (US$ Million)
Figure 4. Medical Beauty Equipment And Consumables Report Years Considered
Figure 5. Global Medical Beauty Equipment And Consumables Players Revenue Ranking (2023) & (US$ Million)
Figure 6. The 5 and 10 Largest Manufacturers in the World: Market Share by Medical Beauty Equipment And Consumables Revenue in 2023
Figure 7. Medical Beauty Equipment And Consumables Market Share by Company Type (Tier 1, Tier 2, and Tier 3): 2019 VS 2023
Figure 8. Equipment Picture
Figure 9. Filler Picture
Figure 10. Injection Picture
Figure 11. Detection Class Picture
Figure 12. Global Medical Beauty Equipment And Consumables Sales Value by Type (2019 VS 2023 VS 2030) & (US$ Million)
Figure 13. Global Medical Beauty Equipment And Consumables Sales Value Market Share by Type, 2023 & 2030
Figure 14. Product Picture of Surgery
Figure 15. Product Picture of Non-Surgical
Figure 16. Global Medical Beauty Equipment And Consumables Sales Value by Application (2019 VS 2023 VS 2030) & (US$ Million)
Figure 17. Global Medical Beauty Equipment And Consumables Sales Value Market Share by Application, 2023 & 2030
Figure 18. North America Medical Beauty Equipment And Consumables Sales Value (2019-2030) & (US$ Million)
Figure 19. North America Medical Beauty Equipment And Consumables Sales Value by Country (%), 2023 VS 2030
Figure 20. Europe Medical Beauty Equipment And Consumables Sales Value (2019-2030) & (US$ Million)
Figure 21. Europe Medical Beauty Equipment And Consumables Sales Value by Country (%), 2023 VS 2030
Figure 22. Asia Pacific Medical Beauty Equipment And Consumables Sales Value (2019-2030) & (US$ Million)
Figure 23. Asia Pacific Medical Beauty Equipment And Consumables Sales Value by Country (%), 2023 VS 2030
Figure 24. South America Medical Beauty Equipment And Consumables Sales Value (2019-2030) & (US$ Million)
Figure 25. South America Medical Beauty Equipment And Consumables Sales Value by Country (%), 2023 VS 2030
Figure 26. Middle East & Africa Medical Beauty Equipment And Consumables Sales Value (2019-2030) & (US$ Million)
Figure 27. Middle East & Africa Medical Beauty Equipment And Consumables Sales Value by Country (%), 2023 VS 2030
Figure 28. Key Countries/Regions Medical Beauty Equipment And Consumables Sales Value (%), (2019-2030)
Figure 29. United States Medical Beauty Equipment And Consumables Sales Value, (2019-2030) & (US$ Million)
Figure 30. United States Medical Beauty Equipment And Consumables Sales Value by Type (%), 2023 VS 2030
Figure 31. United States Medical Beauty Equipment And Consumables Sales Value by Application (%), 2023 VS 2030
Figure 32. Europe Medical Beauty Equipment And Consumables Sales Value, (2019-2030) & (US$ Million)
Figure 33. Europe Medical Beauty Equipment And Consumables Sales Value by Type (%), 2023 VS 2030
Figure 34. Europe Medical Beauty Equipment And Consumables Sales Value by Application (%), 2023 VS 2030
Figure 35. China Medical Beauty Equipment And Consumables Sales Value, (2019-2030) & (US$ Million)
Figure 36. China Medical Beauty Equipment And Consumables Sales Value by Type (%), 2023 VS 2030
Figure 37. China Medical Beauty Equipment And Consumables Sales Value by Application (%), 2023 VS 2030
Figure 38. Japan Medical Beauty Equipment And Consumables Sales Value, (2019-2030) & (US$ Million)
Figure 39. Japan Medical Beauty Equipment And Consumables Sales Value by Type (%), 2023 VS 2030
Figure 40. Japan Medical Beauty Equipment And Consumables Sales Value by Application (%), 2023 VS 2030
Figure 41. South Korea Medical Beauty Equipment And Consumables Sales Value, (2019-2030) & (US$ Million)
Figure 42. South Korea Medical Beauty Equipment And Consumables Sales Value by Type (%), 2023 VS 2030
Figure 43. South Korea Medical Beauty Equipment And Consumables Sales Value by Application (%), 2023 VS 2030
Figure 44. Southeast Asia Medical Beauty Equipment And Consumables Sales Value, (2019-2030) & (US$ Million)
Figure 45. Southeast Asia Medical Beauty Equipment And Consumables Sales Value by Type (%), 2023 VS 2030
Figure 46. Southeast Asia Medical Beauty Equipment And Consumables Sales Value by Application (%), 2023 VS 2030
Figure 47. India Medical Beauty Equipment And Consumables Sales Value, (2019-2030) & (US$ Million)
Figure 48. India Medical Beauty Equipment And Consumables Sales Value by Type (%), 2023 VS 2030
Figure 49. India Medical Beauty Equipment And Consumables Sales Value by Application (%), 2023 VS 2030
Figure 50. Medical Beauty Equipment And Consumables Industrial Chain
Figure 51. Medical Beauty Equipment And Consumables Manufacturing Cost Structure
Figure 52. Channels of Distribution (Direct Sales, and Distribution)
Figure 53. Bottom-up and Top-down Approaches for This Report
Figure 54. Data Triangulation