List of Tables
Table 1. Global ALD Coating Service Market Size Growth Rate by Type (US$ Million): 2020 VS 2024 VS 2031
Table 2. Key Players of Oxide System
Table 3. Key Players of Nitride System
Table 4. Global ALD Coating Service Market Size Growth Rate by Process Parameters (US$ Million): 2020 VS 2024 VS 2031
Table 5. Key Players of Low Temperature Process (<200℃)
Table 6. Key Players of High Temperature Process (>300℃)
Table 7. Global ALD Coating Service Market Size Growth Rate by Deposition Method (US$ Million): 2020 VS 2024 VS 2031
Table 8. Key Players of Thermal ALD
Table 9. Key Players of Plasma Enhanced ALD (PEALD)
Table 10. Global ALD Coating Service Market Size Growth by Application (US$ Million): 2020 VS 2024 VS 2031
Table 11. Global ALD Coating Service Market Size by Region (US$ Million): 2020 VS 2024 VS 2031
Table 12. Global ALD Coating Service Market Size by Region (2020-2025) & (US$ Million)
Table 13. Global ALD Coating Service Market Share by Region (2020-2025)
Table 14. Global ALD Coating Service Forecasted Market Size by Region (2026-2031) & (US$ Million)
Table 15. Global ALD Coating Service Market Share by Region (2026-2031)
Table 16. ALD Coating Service Market Trends
Table 17. ALD Coating Service Market Drivers
Table 18. ALD Coating Service Market Challenges
Table 19. ALD Coating Service Market Restraints
Table 20. Global ALD Coating Service Revenue by Players (2020-2025) & (US$ Million)
Table 21. Global ALD Coating Service Market Share by Players (2020-2025)
Table 22. Global Top ALD Coating Service Players by Company Type (Tier 1, Tier 2, and Tier 3) & (based on the Revenue in ALD Coating Service as of 2024)
Table 23. Ranking of Global Top ALD Coating Service Companies by Revenue (US$ Million) in 2024
Table 24. Global 5 Largest Players Market Share by ALD Coating Service Revenue (CR5 and HHI) & (2020-2025)
Table 25. Global Key Players of ALD Coating Service, Headquarters and Area Served
Table 26. Global Key Players of ALD Coating Service, Product and Application
Table 27. Global Key Players of ALD Coating Service, Date of Enter into This Industry
Table 28. Mergers & Acquisitions, Expansion Plans
Table 29. Global ALD Coating Service Market Size by Type (2020-2025) & (US$ Million)
Table 30. Global ALD Coating Service Revenue Market Share by Type (2020-2025)
Table 31. Global ALD Coating Service Forecasted Market Size by Type (2026-2031) & (US$ Million)
Table 32. Global ALD Coating Service Revenue Market Share by Type (2026-2031)
Table 33. Global ALD Coating Service Market Size by Application (2020-2025) & (US$ Million)
Table 34. Global ALD Coating Service Revenue Market Share by Application (2020-2025)
Table 35. Global ALD Coating Service Forecasted Market Size by Application (2026-2031) & (US$ Million)
Table 36. Global ALD Coating Service Revenue Market Share by Application (2026-2031)
Table 37. North America ALD Coating Service Market Size Growth Rate by Country (US$ Million): 2020 VS 2024 VS 2031
Table 38. North America ALD Coating Service Market Size by Country (2020-2025) & (US$ Million)
Table 39. North America ALD Coating Service Market Size by Country (2026-2031) & (US$ Million)
Table 40. Europe ALD Coating Service Market Size Growth Rate by Country (US$ Million): 2020 VS 2024 VS 2031
Table 41. Europe ALD Coating Service Market Size by Country (2020-2025) & (US$ Million)
Table 42. Europe ALD Coating Service Market Size by Country (2026-2031) & (US$ Million)
Table 43. Asia-Pacific ALD Coating Service Market Size Growth Rate by Region (US$ Million): 2020 VS 2024 VS 2031
Table 44. Asia-Pacific ALD Coating Service Market Size by Region (2020-2025) & (US$ Million)
Table 45. Asia-Pacific ALD Coating Service Market Size by Region (2026-2031) & (US$ Million)
Table 46. Latin America ALD Coating Service Market Size Growth Rate by Country (US$ Million): 2020 VS 2024 VS 2031
Table 47. Latin America ALD Coating Service Market Size by Country (2020-2025) & (US$ Million)
Table 48. Latin America ALD Coating Service Market Size by Country (2026-2031) & (US$ Million)
Table 49. Middle East & Africa ALD Coating Service Market Size Growth Rate by Country (US$ Million): 2020 VS 2024 VS 2031
Table 50. Middle East & Africa ALD Coating Service Market Size by Country (2020-2025) & (US$ Million)
Table 51. Middle East & Africa ALD Coating Service Market Size by Country (2026-2031) & (US$ Million)
Table 52. Beneq Company Details
Table 53. Beneq Business Overview
Table 54. Beneq ALD Coating Service Product
Table 55. Beneq Revenue in ALD Coating Service Business (2020-2025) & (US$ Million)
Table 56. Beneq Recent Development
Table 57. Thin Film Partners Company Details
Table 58. Thin Film Partners Business Overview
Table 59. Thin Film Partners ALD Coating Service Product
Table 60. Thin Film Partners Revenue in ALD Coating Service Business (2020-2025) & (US$ Million)
Table 61. Thin Film Partners Recent Development
Table 62. HZO Company Details
Table 63. HZO Business Overview
Table 64. HZO ALD Coating Service Product
Table 65. HZO Revenue in ALD Coating Service Business (2020-2025) & (US$ Million)
Table 66. HZO Recent Development
Table 67. Alcadyne Company Details
Table 68. Alcadyne Business Overview
Table 69. Alcadyne ALD Coating Service Product
Table 70. Alcadyne Revenue in ALD Coating Service Business (2020-2025) & (US$ Million)
Table 71. Alcadyne Recent Development
Table 72. FHR Anlagenbau GmbH Company Details
Table 73. FHR Anlagenbau GmbH Business Overview
Table 74. FHR Anlagenbau GmbH ALD Coating Service Product
Table 75. FHR Anlagenbau GmbH Revenue in ALD Coating Service Business (2020-2025) & (US$ Million)
Table 76. FHR Anlagenbau GmbH Recent Development
Table 77. VaporPulse Company Details
Table 78. VaporPulse Business Overview
Table 79. VaporPulse ALD Coating Service Product
Table 80. VaporPulse Revenue in ALD Coating Service Business (2020-2025) & (US$ Million)
Table 81. VaporPulse Recent Development
Table 82. Specialty Coating Systems Company Details
Table 83. Specialty Coating Systems Business Overview
Table 84. Specialty Coating Systems ALD Coating Service Product
Table 85. Specialty Coating Systems Revenue in ALD Coating Service Business (2020-2025) & (US$ Million)
Table 86. Specialty Coating Systems Recent Development
Table 87. Fraunhofer Company Details
Table 88. Fraunhofer Business Overview
Table 89. Fraunhofer ALD Coating Service Product
Table 90. Fraunhofer Revenue in ALD Coating Service Business (2020-2025) & (US$ Million)
Table 91. Fraunhofer Recent Development
Table 92. Picosun Company Details
Table 93. Picosun Business Overview
Table 94. Picosun ALD Coating Service Product
Table 95. Picosun Revenue in ALD Coating Service Business (2020-2025) & (US$ Million)
Table 96. Picosun Recent Development
Table 97. Positivecoating Company Details
Table 98. Positivecoating Business Overview
Table 99. Positivecoating ALD Coating Service Product
Table 100. Positivecoating Revenue in ALD Coating Service Business (2020-2025) & (US$ Million)
Table 101. Positivecoating Recent Development
Table 102. Forge Nano Company Details
Table 103. Forge Nano Business Overview
Table 104. Forge Nano ALD Coating Service Product
Table 105. Forge Nano Revenue in ALD Coating Service Business (2020-2025) & (US$ Million)
Table 106. Forge Nano Recent Development
Table 107. Maxima Sciences Company Details
Table 108. Maxima Sciences Business Overview
Table 109. Maxima Sciences ALD Coating Service Product
Table 110. Maxima Sciences Revenue in ALD Coating Service Business (2020-2025) & (US$ Million)
Table 111. Maxima Sciences Recent Development
Table 112. AdNaNoTek Company Details
Table 113. AdNaNoTek Business Overview
Table 114. AdNaNoTek ALD Coating Service Product
Table 115. AdNaNoTek Revenue in ALD Coating Service Business (2020-2025) & (US$ Million)
Table 116. AdNaNoTek Recent Development
Table 117. Comelec Company Details
Table 118. Comelec Business Overview
Table 119. Comelec ALD Coating Service Product
Table 120. Comelec Revenue in ALD Coating Service Business (2020-2025) & (US$ Million)
Table 121. Comelec Recent Development
Table 122. Entegris Company Details
Table 123. Entegris Business Overview
Table 124. Entegris ALD Coating Service Product
Table 125. Entegris Revenue in ALD Coating Service Business (2020-2025) & (US$ Million)
Table 126. Entegris Recent Development
Table 127. KoMiCo Company Details
Table 128. KoMiCo Business Overview
Table 129. KoMiCo ALD Coating Service Product
Table 130. KoMiCo Revenue in ALD Coating Service Business (2020-2025) & (US$ Million)
Table 131. KoMiCo Recent Development
Table 132. Influx Company Details
Table 133. Influx Business Overview
Table 134. Influx ALD Coating Service Product
Table 135. Influx Revenue in ALD Coating Service Business (2020-2025) & (US$ Million)
Table 136. Influx Recent Development
Table 137. Cinos Company Details
Table 138. Cinos Business Overview
Table 139. Cinos ALD Coating Service Product
Table 140. Cinos Revenue in ALD Coating Service Business (2020-2025) & (US$ Million)
Table 141. Cinos Recent Development
Table 142. TOCALO Company Details
Table 143. TOCALO Business Overview
Table 144. TOCALO ALD Coating Service Product
Table 145. TOCALO Revenue in ALD Coating Service Business (2020-2025) & (US$ Million)
Table 146. TOCALO Recent Development
Table 147. Research Programs/Design for This Report
Table 148. Key Data Information from Secondary Sources
Table 149. Key Data Information from Primary Sources
Table 150. Authors List of This Report
List of Figures
Figure 1. ALD Coating Service Picture
Figure 2. Global ALD Coating Service Market Size Comparison by Type (2020-2031) & (US$ Million)
Figure 3. Global ALD Coating Service Market Share by Type: 2024 VS 2031
Figure 4. Oxide System Features
Figure 5. Nitride System Features
Figure 6. Global ALD Coating Service Market Size Comparison by Process Parameters (2020-2031) & (US$ Million)
Figure 7. Low Temperature Process (<200℃) Features
Figure 8. High Temperature Process (>300℃) Features
Figure 9. Global ALD Coating Service Market Size Comparison by Deposition Method (2020-2031) & (US$ Million)
Figure 10. Thermal ALD Features
Figure 11. Plasma Enhanced ALD (PEALD) Features
Figure 12. Global ALD Coating Service Market Size by Application (2020-2031) & (US$ Million)
Figure 13. Global ALD Coating Service Market Share by Application: 2024 VS 2031
Figure 14. Semiconductors Case Studies
Figure 15. Optoelectronics Case Studies
Figure 16. New Energy Case Studies
Figure 17. Medical & Healthcare Case Studies
Figure 18. Other Case Studies
Figure 19. ALD Coating Service Report Years Considered
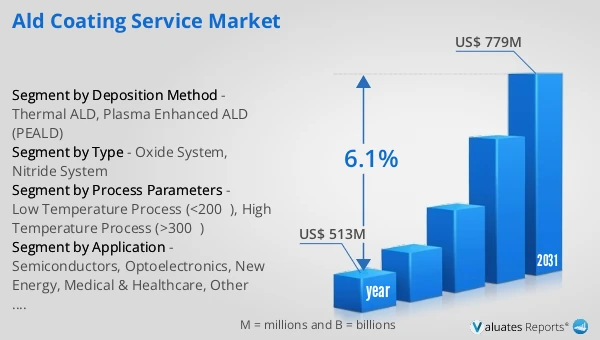
Figure 20. Global ALD Coating Service Market Size (US$ Million), Year-over-Year: 2020-2031
Figure 21. Global ALD Coating Service Market Size, (US$ Million), 2020 VS 2024 VS 2031
Figure 22. Global ALD Coating Service Market Share by Region: 2024 VS 2031
Figure 23. Global ALD Coating Service Market Share by Players in 2024
Figure 24. Global ALD Coating Service Market Share by Company Type (Tier 1, Tier 2, and Tier 3)
Figure 25. The Top 10 and 5 Players Market Share by ALD Coating Service Revenue in 2024
Figure 26. North America ALD Coating Service Market Size YoY Growth (2020-2031) & (US$ Million)
Figure 27. North America ALD Coating Service Market Share by Country (2020-2031)
Figure 28. United States ALD Coating Service Market Size YoY Growth (2020-2031) & (US$ Million)
Figure 29. Canada ALD Coating Service Market Size YoY Growth (2020-2031) & (US$ Million)
Figure 30. Europe ALD Coating Service Market Size YoY Growth (2020-2031) & (US$ Million)
Figure 31. Europe ALD Coating Service Market Share by Country (2020-2031)
Figure 32. Germany ALD Coating Service Market Size YoY Growth (2020-2031) & (US$ Million)
Figure 33. France ALD Coating Service Market Size YoY Growth (2020-2031) & (US$ Million)
Figure 34. U.K. ALD Coating Service Market Size YoY Growth (2020-2031) & (US$ Million)
Figure 35. Italy ALD Coating Service Market Size YoY Growth (2020-2031) & (US$ Million)
Figure 36. Russia ALD Coating Service Market Size YoY Growth (2020-2031) & (US$ Million)
Figure 37. Ireland ALD Coating Service Market Size YoY Growth (2020-2031) & (US$ Million)
Figure 38. Asia-Pacific ALD Coating Service Market Size YoY Growth (2020-2031) & (US$ Million)
Figure 39. Asia-Pacific ALD Coating Service Market Share by Region (2020-2031)
Figure 40. China ALD Coating Service Market Size YoY Growth (2020-2031) & (US$ Million)
Figure 41. Japan ALD Coating Service Market Size YoY Growth (2020-2031) & (US$ Million)
Figure 42. South Korea ALD Coating Service Market Size YoY Growth (2020-2031) & (US$ Million)
Figure 43. Southeast Asia ALD Coating Service Market Size YoY Growth (2020-2031) & (US$ Million)
Figure 44. India ALD Coating Service Market Size YoY Growth (2020-2031) & (US$ Million)
Figure 45. Australia & New Zealand ALD Coating Service Market Size YoY Growth (2020-2031) & (US$ Million)
Figure 46. Latin America ALD Coating Service Market Size YoY Growth (2020-2031) & (US$ Million)
Figure 47. Latin America ALD Coating Service Market Share by Country (2020-2031)
Figure 48. Mexico ALD Coating Service Market Size YoY Growth (2020-2031) & (US$ Million)
Figure 49. Brazil ALD Coating Service Market Size YoY Growth (2020-2031) & (US$ Million)
Figure 50. Middle East & Africa ALD Coating Service Market Size YoY Growth (2020-2031) & (US$ Million)
Figure 51. Middle East & Africa ALD Coating Service Market Share by Country (2020-2031)
Figure 52. Israel ALD Coating Service Market Size YoY Growth (2020-2031) & (US$ Million)
Figure 53. Saudi Arabia ALD Coating Service Market Size YoY Growth (2020-2031) & (US$ Million)
Figure 54. UAE ALD Coating Service Market Size YoY Growth (2020-2031) & (US$ Million)
Figure 55. Beneq Revenue Growth Rate in ALD Coating Service Business (2020-2025)
Figure 56. Thin Film Partners Revenue Growth Rate in ALD Coating Service Business (2020-2025)
Figure 57. HZO Revenue Growth Rate in ALD Coating Service Business (2020-2025)
Figure 58. Alcadyne Revenue Growth Rate in ALD Coating Service Business (2020-2025)
Figure 59. FHR Anlagenbau GmbH Revenue Growth Rate in ALD Coating Service Business (2020-2025)
Figure 60. VaporPulse Revenue Growth Rate in ALD Coating Service Business (2020-2025)
Figure 61. Specialty Coating Systems Revenue Growth Rate in ALD Coating Service Business (2020-2025)
Figure 62. Fraunhofer Revenue Growth Rate in ALD Coating Service Business (2020-2025)
Figure 63. Picosun Revenue Growth Rate in ALD Coating Service Business (2020-2025)
Figure 64. Positivecoating Revenue Growth Rate in ALD Coating Service Business (2020-2025)
Figure 65. Forge Nano Revenue Growth Rate in ALD Coating Service Business (2020-2025)
Figure 66. Maxima Sciences Revenue Growth Rate in ALD Coating Service Business (2020-2025)
Figure 67. AdNaNoTek Revenue Growth Rate in ALD Coating Service Business (2020-2025)
Figure 68. Comelec Revenue Growth Rate in ALD Coating Service Business (2020-2025)
Figure 69. Entegris Revenue Growth Rate in ALD Coating Service Business (2020-2025)
Figure 70. KoMiCo Revenue Growth Rate in ALD Coating Service Business (2020-2025)
Figure 71. Influx Revenue Growth Rate in ALD Coating Service Business (2020-2025)
Figure 72. Cinos Revenue Growth Rate in ALD Coating Service Business (2020-2025)
Figure 73. TOCALO Revenue Growth Rate in ALD Coating Service Business (2020-2025)
Figure 74. Bottom-up and Top-down Approaches for This Report
Figure 75. Data Triangulation
Figure 76. Key Executives Interviewed