List of Tables
Table 1. Global Chimeric Antigen Receptor Cell Therapy Market Size Growth Rate by Type (US$ Million): 2020 VS 2024 VS 2031
Table 2. Key Players of MonOthersapy
Table 3. Key Players of Combination Therapy
Table 4. Global Chimeric Antigen Receptor Cell Therapy Market Size Growth by Application (US$ Million): 2020 VS 2024 VS 2031
Table 5. Global Chimeric Antigen Receptor Cell Therapy Market Size by Region (US$ Million): 2020 VS 2024 VS 2031
Table 6. Global Chimeric Antigen Receptor Cell Therapy Market Size by Region (2020-2025) & (US$ Million)
Table 7. Global Chimeric Antigen Receptor Cell Therapy Market Share by Region (2020-2025)
Table 8. Global Chimeric Antigen Receptor Cell Therapy Forecasted Market Size by Region (2026-2031) & (US$ Million)
Table 9. Global Chimeric Antigen Receptor Cell Therapy Market Share by Region (2026-2031)
Table 10. Chimeric Antigen Receptor Cell Therapy Market Trends
Table 11. Chimeric Antigen Receptor Cell Therapy Market Drivers
Table 12. Chimeric Antigen Receptor Cell Therapy Market Challenges
Table 13. Chimeric Antigen Receptor Cell Therapy Market Restraints
Table 14. Global Chimeric Antigen Receptor Cell Therapy Revenue by Players (2020-2025) & (US$ Million)
Table 15. Global Chimeric Antigen Receptor Cell Therapy Market Share by Players (2020-2025)
Table 16. Global Top Chimeric Antigen Receptor Cell Therapy Players by Company Type (Tier 1, Tier 2, and Tier 3) & (based on the Revenue in Chimeric Antigen Receptor Cell Therapy as of 2024)
Table 17. Ranking of Global Top Chimeric Antigen Receptor Cell Therapy Companies by Revenue (US$ Million) in 2024
Table 18. Global 5 Largest Players Market Share by Chimeric Antigen Receptor Cell Therapy Revenue (CR5 and HHI) & (2020-2025)
Table 19. Global Key Players of Chimeric Antigen Receptor Cell Therapy, Headquarters and Area Served
Table 20. Global Key Players of Chimeric Antigen Receptor Cell Therapy, Product and Application
Table 21. Global Key Players of Chimeric Antigen Receptor Cell Therapy, Date of Enter into This Industry
Table 22. Mergers & Acquisitions, Expansion Plans
Table 23. Global Chimeric Antigen Receptor Cell Therapy Market Size by Type (2020-2025) & (US$ Million)
Table 24. Global Chimeric Antigen Receptor Cell Therapy Revenue Market Share by Type (2020-2025)
Table 25. Global Chimeric Antigen Receptor Cell Therapy Forecasted Market Size by Type (2026-2031) & (US$ Million)
Table 26. Global Chimeric Antigen Receptor Cell Therapy Revenue Market Share by Type (2026-2031)
Table 27. Global Chimeric Antigen Receptor Cell Therapy Market Size by Application (2020-2025) & (US$ Million)
Table 28. Global Chimeric Antigen Receptor Cell Therapy Revenue Market Share by Application (2020-2025)
Table 29. Global Chimeric Antigen Receptor Cell Therapy Forecasted Market Size by Application (2026-2031) & (US$ Million)
Table 30. Global Chimeric Antigen Receptor Cell Therapy Revenue Market Share by Application (2026-2031)
Table 31. North America Chimeric Antigen Receptor Cell Therapy Market Size Growth Rate by Country (US$ Million): 2020 VS 2024 VS 2031
Table 32. North America Chimeric Antigen Receptor Cell Therapy Market Size by Country (2020-2025) & (US$ Million)
Table 33. North America Chimeric Antigen Receptor Cell Therapy Market Size by Country (2026-2031) & (US$ Million)
Table 34. Europe Chimeric Antigen Receptor Cell Therapy Market Size Growth Rate by Country (US$ Million): 2020 VS 2024 VS 2031
Table 35. Europe Chimeric Antigen Receptor Cell Therapy Market Size by Country (2020-2025) & (US$ Million)
Table 36. Europe Chimeric Antigen Receptor Cell Therapy Market Size by Country (2026-2031) & (US$ Million)
Table 37. Asia-Pacific Chimeric Antigen Receptor Cell Therapy Market Size Growth Rate by Region (US$ Million): 2020 VS 2024 VS 2031
Table 38. Asia-Pacific Chimeric Antigen Receptor Cell Therapy Market Size by Region (2020-2025) & (US$ Million)
Table 39. Asia-Pacific Chimeric Antigen Receptor Cell Therapy Market Size by Region (2026-2031) & (US$ Million)
Table 40. Latin America Chimeric Antigen Receptor Cell Therapy Market Size Growth Rate by Country (US$ Million): 2020 VS 2024 VS 2031
Table 41. Latin America Chimeric Antigen Receptor Cell Therapy Market Size by Country (2020-2025) & (US$ Million)
Table 42. Latin America Chimeric Antigen Receptor Cell Therapy Market Size by Country (2026-2031) & (US$ Million)
Table 43. Middle East & Africa Chimeric Antigen Receptor Cell Therapy Market Size Growth Rate by Country (US$ Million): 2020 VS 2024 VS 2031
Table 44. Middle East & Africa Chimeric Antigen Receptor Cell Therapy Market Size by Country (2020-2025) & (US$ Million)
Table 45. Middle East & Africa Chimeric Antigen Receptor Cell Therapy Market Size by Country (2026-2031) & (US$ Million)
Table 46. Amgen Inc Company Details
Table 47. Amgen Inc Business Overview
Table 48. Amgen Inc Chimeric Antigen Receptor Cell Therapy Product
Table 49. Amgen Inc Revenue in Chimeric Antigen Receptor Cell Therapy Business (2020-2025) & (US$ Million)
Table 50. Amgen Inc Recent Development
Table 51. Autolus Therapeutics Plc Company Details
Table 52. Autolus Therapeutics Plc Business Overview
Table 53. Autolus Therapeutics Plc Chimeric Antigen Receptor Cell Therapy Product
Table 54. Autolus Therapeutics Plc Revenue in Chimeric Antigen Receptor Cell Therapy Business (2020-2025) & (US$ Million)
Table 55. Autolus Therapeutics Plc Recent Development
Table 56. Beijing Immunochina Medical Science & Technology Co Ltd Company Details
Table 57. Beijing Immunochina Medical Science & Technology Co Ltd Business Overview
Table 58. Beijing Immunochina Medical Science & Technology Co Ltd Chimeric Antigen Receptor Cell Therapy Product
Table 59. Beijing Immunochina Medical Science & Technology Co Ltd Revenue in Chimeric Antigen Receptor Cell Therapy Business (2020-2025) & (US$ Million)
Table 60. Beijing Immunochina Medical Science & Technology Co Ltd Recent Development
Table 61. Bellicum Pharmaceuticals Inc Company Details
Table 62. Bellicum Pharmaceuticals Inc Business Overview
Table 63. Bellicum Pharmaceuticals Inc Chimeric Antigen Receptor Cell Therapy Product
Table 64. Bellicum Pharmaceuticals Inc Revenue in Chimeric Antigen Receptor Cell Therapy Business (2020-2025) & (US$ Million)
Table 65. Bellicum Pharmaceuticals Inc Recent Development
Table 66. Bristol-Myers Squibb Co Company Details
Table 67. Bristol-Myers Squibb Co Business Overview
Table 68. Bristol-Myers Squibb Co Chimeric Antigen Receptor Cell Therapy Product
Table 69. Bristol-Myers Squibb Co Revenue in Chimeric Antigen Receptor Cell Therapy Business (2020-2025) & (US$ Million)
Table 70. Bristol-Myers Squibb Co Recent Development
Table 71. bluebird bio Inc Company Details
Table 72. bluebird bio Inc Business Overview
Table 73. bluebird bio Inc Chimeric Antigen Receptor Cell Therapy Product
Table 74. bluebird bio Inc Revenue in Chimeric Antigen Receptor Cell Therapy Business (2020-2025) & (US$ Million)
Table 75. bluebird bio Inc Recent Development
Table 76. CARsgen Therapeutics Ltd Company Details
Table 77. CARsgen Therapeutics Ltd Business Overview
Table 78. CARsgen Therapeutics Ltd Chimeric Antigen Receptor Cell Therapy Product
Table 79. CARsgen Therapeutics Ltd Revenue in Chimeric Antigen Receptor Cell Therapy Business (2020-2025) & (US$ Million)
Table 80. CARsgen Therapeutics Ltd Recent Development
Table 81. Celgene Corp Company Details
Table 82. Celgene Corp Business Overview
Table 83. Celgene Corp Chimeric Antigen Receptor Cell Therapy Product
Table 84. Celgene Corp Revenue in Chimeric Antigen Receptor Cell Therapy Business (2020-2025) & (US$ Million)
Table 85. Celgene Corp Recent Development
Table 86. Cell Medica Ltd Company Details
Table 87. Cell Medica Ltd Business Overview
Table 88. Cell Medica Ltd Chimeric Antigen Receptor Cell Therapy Product
Table 89. Cell Medica Ltd Revenue in Chimeric Antigen Receptor Cell Therapy Business (2020-2025) & (US$ Million)
Table 90. Cell Medica Ltd Recent Development
Table 91. Cellular Biomedicine Group Inc Company Details
Table 92. Cellular Biomedicine Group Inc Business Overview
Table 93. Cellular Biomedicine Group Inc Chimeric Antigen Receptor Cell Therapy Product
Table 94. Cellular Biomedicine Group Inc Revenue in Chimeric Antigen Receptor Cell Therapy Business (2020-2025) & (US$ Million)
Table 95. Cellular Biomedicine Group Inc Recent Development
Table 96. Celularity Inc Company Details
Table 97. Celularity Inc Business Overview
Table 98. Celularity Inc Chimeric Antigen Receptor Cell Therapy Product
Table 99. Celularity Inc Revenue in Chimeric Antigen Receptor Cell Therapy Business (2020-2025) & (US$ Million)
Table 100. Celularity Inc Recent Development
Table 101. Celyad SA Company Details
Table 102. Celyad SA Business Overview
Table 103. Celyad SA Chimeric Antigen Receptor Cell Therapy Product
Table 104. Celyad SA Revenue in Chimeric Antigen Receptor Cell Therapy Business (2020-2025) & (US$ Million)
Table 105. Celyad SA Recent Development
Table 106. Daiichi Sankyo Co Ltd Company Details
Table 107. Daiichi Sankyo Co Ltd Business Overview
Table 108. Daiichi Sankyo Co Ltd Chimeric Antigen Receptor Cell Therapy Product
Table 109. Daiichi Sankyo Co Ltd Revenue in Chimeric Antigen Receptor Cell Therapy Business (2020-2025) & (US$ Million)
Table 110. Daiichi Sankyo Co Ltd Recent Development
Table 111. Fosun Pharmaceutical AG Company Details
Table 112. Fosun Pharmaceutical AG Business Overview
Table 113. Fosun Pharmaceutical AG Chimeric Antigen Receptor Cell Therapy Product
Table 114. Fosun Pharmaceutical AG Revenue in Chimeric Antigen Receptor Cell Therapy Business (2020-2025) & (US$ Million)
Table 115. Fosun Pharmaceutical AG Recent Development
Table 116. Gilead Sciences Inc Company Details
Table 117. Gilead Sciences Inc Business Overview
Table 118. Gilead Sciences Inc Chimeric Antigen Receptor Cell Therapy Product
Table 119. Gilead Sciences Inc Revenue in Chimeric Antigen Receptor Cell Therapy Business (2020-2025) & (US$ Million)
Table 120. Gilead Sciences Inc Recent Development
Table 121. Guangzhou Anjie Biomedical Technology Co Ltd Company Details
Table 122. Guangzhou Anjie Biomedical Technology Co Ltd Business Overview
Table 123. Guangzhou Anjie Biomedical Technology Co Ltd Chimeric Antigen Receptor Cell Therapy Product
Table 124. Guangzhou Anjie Biomedical Technology Co Ltd Revenue in Chimeric Antigen Receptor Cell Therapy Business (2020-2025) & (US$ Million)
Table 125. Guangzhou Anjie Biomedical Technology Co Ltd Recent Development
Table 126. Hangzhou Converd Co Ltd Company Details
Table 127. Hangzhou Converd Co Ltd Business Overview
Table 128. Hangzhou Converd Co Ltd Chimeric Antigen Receptor Cell Therapy Product
Table 129. Hangzhou Converd Co Ltd Revenue in Chimeric Antigen Receptor Cell Therapy Business (2020-2025) & (US$ Million)
Table 130. Hangzhou Converd Co Ltd Recent Development
Table 131. Hebei Senlang Biotechnology Inc Ltd Company Details
Table 132. Hebei Senlang Biotechnology Inc Ltd Business Overview
Table 133. Hebei Senlang Biotechnology Inc Ltd Chimeric Antigen Receptor Cell Therapy Product
Table 134. Hebei Senlang Biotechnology Inc Ltd Revenue in Chimeric Antigen Receptor Cell Therapy Business (2020-2025) & (US$ Million)
Table 135. Hebei Senlang Biotechnology Inc Ltd Recent Development
Table 136. HRAIN Biotechnology Co Ltd Company Details
Table 137. HRAIN Biotechnology Co Ltd Business Overview
Table 138. HRAIN Biotechnology Co Ltd Chimeric Antigen Receptor Cell Therapy Product
Table 139. HRAIN Biotechnology Co Ltd Revenue in Chimeric Antigen Receptor Cell Therapy Business (2020-2025) & (US$ Million)
Table 140. HRAIN Biotechnology Co Ltd Recent Development
Table 141. Juno Therapeutics Inc Company Details
Table 142. Juno Therapeutics Inc Business Overview
Table 143. Juno Therapeutics Inc Chimeric Antigen Receptor Cell Therapy Product
Table 144. Juno Therapeutics Inc Revenue in Chimeric Antigen Receptor Cell Therapy Business (2020-2025) & (US$ Million)
Table 145. Juno Therapeutics Inc Recent Development
Table 146. Kite Pharma Inc Company Details
Table 147. Kite Pharma Inc Business Overview
Table 148. Kite Pharma Inc Chimeric Antigen Receptor Cell Therapy Product
Table 149. Kite Pharma Inc Revenue in Chimeric Antigen Receptor Cell Therapy Business (2020-2025) & (US$ Million)
Table 150. Kite Pharma Inc Recent Development
Table 151. Nanjing Legend Biotech Co Ltd Company Details
Table 152. Nanjing Legend Biotech Co Ltd Business Overview
Table 153. Nanjing Legend Biotech Co Ltd Chimeric Antigen Receptor Cell Therapy Product
Table 154. Nanjing Legend Biotech Co Ltd Revenue in Chimeric Antigen Receptor Cell Therapy Business (2020-2025) & (US$ Million)
Table 155. Nanjing Legend Biotech Co Ltd Recent Development
Table 156. NantKwest Inc Company Details
Table 157. NantKwest Inc Business Overview
Table 158. NantKwest Inc Chimeric Antigen Receptor Cell Therapy Product
Table 159. NantKwest Inc Revenue in Chimeric Antigen Receptor Cell Therapy Business (2020-2025) & (US$ Million)
Table 160. NantKwest Inc Recent Development
Table 161. Nkarta Inc Company Details
Table 162. Nkarta Inc Business Overview
Table 163. Nkarta Inc Chimeric Antigen Receptor Cell Therapy Product
Table 164. Nkarta Inc Revenue in Chimeric Antigen Receptor Cell Therapy Business (2020-2025) & (US$ Million)
Table 165. Nkarta Inc Recent Development
Table 166. Novartis AG Company Details
Table 167. Novartis AG Business Overview
Table 168. Novartis AG Chimeric Antigen Receptor Cell Therapy Product
Table 169. Novartis AG Revenue in Chimeric Antigen Receptor Cell Therapy Business (2020-2025) & (US$ Million)
Table 170. Novartis AG Recent Development
Table 171. Ono Pharmaceutical Co Ltd Company Details
Table 172. Ono Pharmaceutical Co Ltd Business Overview
Table 173. Ono Pharmaceutical Co Ltd Chimeric Antigen Receptor Cell Therapy Product
Table 174. Ono Pharmaceutical Co Ltd Revenue in Chimeric Antigen Receptor Cell Therapy Business (2020-2025) & (US$ Million)
Table 175. Ono Pharmaceutical Co Ltd Recent Development
Table 176. Shanghai Unicar-Therapy Bio-Medicine Technology Co Ltd Company Details
Table 177. Shanghai Unicar-Therapy Bio-Medicine Technology Co Ltd Business Overview
Table 178. Shanghai Unicar-Therapy Bio-Medicine Technology Co Ltd Chimeric Antigen Receptor Cell Therapy Product
Table 179. Shanghai Unicar-Therapy Bio-Medicine Technology Co Ltd Revenue in Chimeric Antigen Receptor Cell Therapy Business (2020-2025) & (US$ Million)
Table 180. Shanghai Unicar-Therapy Bio-Medicine Technology Co Ltd Recent Development
Table 181. Sorrento Therapeutics Inc Company Details
Table 182. Sorrento Therapeutics Inc Business Overview
Table 183. Sorrento Therapeutics Inc Chimeric Antigen Receptor Cell Therapy Product
Table 184. Sorrento Therapeutics Inc Revenue in Chimeric Antigen Receptor Cell Therapy Business (2020-2025) & (US$ Million)
Table 185. Sorrento Therapeutics Inc Recent Development
Table 186. Takara Bio Inc Company Details
Table 187. Takara Bio Inc Business Overview
Table 188. Takara Bio Inc Chimeric Antigen Receptor Cell Therapy Product
Table 189. Takara Bio Inc Revenue in Chimeric Antigen Receptor Cell Therapy Business (2020-2025) & (US$ Million)
Table 190. Takara Bio Inc Recent Development
Table 191. Research Programs/Design for This Report
Table 192. Key Data Information from Secondary Sources
Table 193. Key Data Information from Primary Sources
Table 194. Authors List of This Report
List of Figures
Figure 1. Chimeric Antigen Receptor Cell Therapy Picture
Figure 2. Global Chimeric Antigen Receptor Cell Therapy Market Size Comparison by Type (2020-2031) & (US$ Million)
Figure 3. Global Chimeric Antigen Receptor Cell Therapy Market Share by Type: 2024 VS 2031
Figure 4. MonOthersapy Features
Figure 5. Combination Therapy Features
Figure 6. Global Chimeric Antigen Receptor Cell Therapy Market Size by Application (2020-2031) & (US$ Million)
Figure 7. Global Chimeric Antigen Receptor Cell Therapy Market Share by Application: 2024 VS 2031
Figure 8. Acute Leukemia Case Studies
Figure 9. Non-hodgkin's Lymphoma Case Studies
Figure 10. Multiple Myeloma Case Studies
Figure 11. Transplant Rejection Case Studies
Figure 12. Others Case Studies
Figure 13. Chimeric Antigen Receptor Cell Therapy Report Years Considered
Figure 14. Global Chimeric Antigen Receptor Cell Therapy Market Size (US$ Million), Year-over-Year: 2020-2031
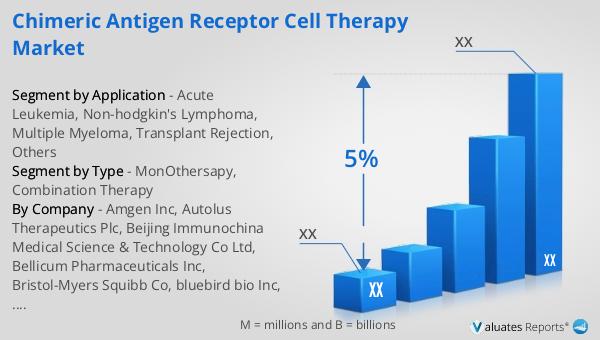
Figure 15. Global Chimeric Antigen Receptor Cell Therapy Market Size, (US$ Million), 2020 VS 2024 VS 2031
Figure 16. Global Chimeric Antigen Receptor Cell Therapy Market Share by Region: 2024 VS 2031
Figure 17. Global Chimeric Antigen Receptor Cell Therapy Market Share by Players in 2024
Figure 18. Global Top Chimeric Antigen Receptor Cell Therapy Players by Company Type (Tier 1, Tier 2, and Tier 3) & (based on the Revenue in Chimeric Antigen Receptor Cell Therapy as of 2024)
Figure 19. The Top 10 and 5 Players Market Share by Chimeric Antigen Receptor Cell Therapy Revenue in 2024
Figure 20. North America Chimeric Antigen Receptor Cell Therapy Market Size YoY Growth (2020-2031) & (US$ Million)
Figure 21. North America Chimeric Antigen Receptor Cell Therapy Market Share by Country (2020-2031)
Figure 22. United States Chimeric Antigen Receptor Cell Therapy Market Size YoY Growth (2020-2031) & (US$ Million)
Figure 23. Canada Chimeric Antigen Receptor Cell Therapy Market Size YoY Growth (2020-2031) & (US$ Million)
Figure 24. Europe Chimeric Antigen Receptor Cell Therapy Market Size YoY Growth (2020-2031) & (US$ Million)
Figure 25. Europe Chimeric Antigen Receptor Cell Therapy Market Share by Country (2020-2031)
Figure 26. Germany Chimeric Antigen Receptor Cell Therapy Market Size YoY Growth (2020-2031) & (US$ Million)
Figure 27. France Chimeric Antigen Receptor Cell Therapy Market Size YoY Growth (2020-2031) & (US$ Million)
Figure 28. U.K. Chimeric Antigen Receptor Cell Therapy Market Size YoY Growth (2020-2031) & (US$ Million)
Figure 29. Italy Chimeric Antigen Receptor Cell Therapy Market Size YoY Growth (2020-2031) & (US$ Million)
Figure 30. Russia Chimeric Antigen Receptor Cell Therapy Market Size YoY Growth (2020-2031) & (US$ Million)
Figure 31. Nordic Countries Chimeric Antigen Receptor Cell Therapy Market Size YoY Growth (2020-2031) & (US$ Million)
Figure 32. Asia-Pacific Chimeric Antigen Receptor Cell Therapy Market Size YoY Growth (2020-2031) & (US$ Million)
Figure 33. Asia-Pacific Chimeric Antigen Receptor Cell Therapy Market Share by Region (2020-2031)
Figure 34. China Chimeric Antigen Receptor Cell Therapy Market Size YoY Growth (2020-2031) & (US$ Million)
Figure 35. Japan Chimeric Antigen Receptor Cell Therapy Market Size YoY Growth (2020-2031) & (US$ Million)
Figure 36. South Korea Chimeric Antigen Receptor Cell Therapy Market Size YoY Growth (2020-2031) & (US$ Million)
Figure 37. Southeast Asia Chimeric Antigen Receptor Cell Therapy Market Size YoY Growth (2020-2031) & (US$ Million)
Figure 38. India Chimeric Antigen Receptor Cell Therapy Market Size YoY Growth (2020-2031) & (US$ Million)
Figure 39. Australia Chimeric Antigen Receptor Cell Therapy Market Size YoY Growth (2020-2031) & (US$ Million)
Figure 40. Latin America Chimeric Antigen Receptor Cell Therapy Market Size YoY Growth (2020-2031) & (US$ Million)
Figure 41. Latin America Chimeric Antigen Receptor Cell Therapy Market Share by Country (2020-2031)
Figure 42. Mexico Chimeric Antigen Receptor Cell Therapy Market Size YoY Growth (2020-2031) & (US$ Million)
Figure 43. Brazil Chimeric Antigen Receptor Cell Therapy Market Size YoY Growth (2020-2031) & (US$ Million)
Figure 44. Middle East & Africa Chimeric Antigen Receptor Cell Therapy Market Size YoY Growth (2020-2031) & (US$ Million)
Figure 45. Middle East & Africa Chimeric Antigen Receptor Cell Therapy Market Share by Country (2020-2031)
Figure 46. Turkey Chimeric Antigen Receptor Cell Therapy Market Size YoY Growth (2020-2031) & (US$ Million)
Figure 47. Saudi Arabia Chimeric Antigen Receptor Cell Therapy Market Size YoY Growth (2020-2031) & (US$ Million)
Figure 48. UAE Chimeric Antigen Receptor Cell Therapy Market Size YoY Growth (2020-2031) & (US$ Million)
Figure 49. Amgen Inc Revenue Growth Rate in Chimeric Antigen Receptor Cell Therapy Business (2020-2025)
Figure 50. Autolus Therapeutics Plc Revenue Growth Rate in Chimeric Antigen Receptor Cell Therapy Business (2020-2025)
Figure 51. Beijing Immunochina Medical Science & Technology Co Ltd Revenue Growth Rate in Chimeric Antigen Receptor Cell Therapy Business (2020-2025)
Figure 52. Bellicum Pharmaceuticals Inc Revenue Growth Rate in Chimeric Antigen Receptor Cell Therapy Business (2020-2025)
Figure 53. Bristol-Myers Squibb Co Revenue Growth Rate in Chimeric Antigen Receptor Cell Therapy Business (2020-2025)
Figure 54. bluebird bio Inc Revenue Growth Rate in Chimeric Antigen Receptor Cell Therapy Business (2020-2025)
Figure 55. CARsgen Therapeutics Ltd Revenue Growth Rate in Chimeric Antigen Receptor Cell Therapy Business (2020-2025)
Figure 56. Celgene Corp Revenue Growth Rate in Chimeric Antigen Receptor Cell Therapy Business (2020-2025)
Figure 57. Cell Medica Ltd Revenue Growth Rate in Chimeric Antigen Receptor Cell Therapy Business (2020-2025)
Figure 58. Cellular Biomedicine Group Inc Revenue Growth Rate in Chimeric Antigen Receptor Cell Therapy Business (2020-2025)
Figure 59. Celularity Inc Revenue Growth Rate in Chimeric Antigen Receptor Cell Therapy Business (2020-2025)
Figure 60. Celyad SA Revenue Growth Rate in Chimeric Antigen Receptor Cell Therapy Business (2020-2025)
Figure 61. Daiichi Sankyo Co Ltd Revenue Growth Rate in Chimeric Antigen Receptor Cell Therapy Business (2020-2025)
Figure 62. Fosun Pharmaceutical AG Revenue Growth Rate in Chimeric Antigen Receptor Cell Therapy Business (2020-2025)
Figure 63. Gilead Sciences Inc Revenue Growth Rate in Chimeric Antigen Receptor Cell Therapy Business (2020-2025)
Figure 64. Guangzhou Anjie Biomedical Technology Co Ltd Revenue Growth Rate in Chimeric Antigen Receptor Cell Therapy Business (2020-2025)
Figure 65. Hangzhou Converd Co Ltd Revenue Growth Rate in Chimeric Antigen Receptor Cell Therapy Business (2020-2025)
Figure 66. Hebei Senlang Biotechnology Inc Ltd Revenue Growth Rate in Chimeric Antigen Receptor Cell Therapy Business (2020-2025)
Figure 67. HRAIN Biotechnology Co Ltd Revenue Growth Rate in Chimeric Antigen Receptor Cell Therapy Business (2020-2025)
Figure 68. Juno Therapeutics Inc Revenue Growth Rate in Chimeric Antigen Receptor Cell Therapy Business (2020-2025)
Figure 69. Kite Pharma Inc Revenue Growth Rate in Chimeric Antigen Receptor Cell Therapy Business (2020-2025)
Figure 70. Nanjing Legend Biotech Co Ltd Revenue Growth Rate in Chimeric Antigen Receptor Cell Therapy Business (2020-2025)
Figure 71. NantKwest Inc Revenue Growth Rate in Chimeric Antigen Receptor Cell Therapy Business (2020-2025)
Figure 72. Nkarta Inc Revenue Growth Rate in Chimeric Antigen Receptor Cell Therapy Business (2020-2025)
Figure 73. Novartis AG Revenue Growth Rate in Chimeric Antigen Receptor Cell Therapy Business (2020-2025)
Figure 74. Ono Pharmaceutical Co Ltd Revenue Growth Rate in Chimeric Antigen Receptor Cell Therapy Business (2020-2025)
Figure 75. Shanghai Unicar-Therapy Bio-Medicine Technology Co Ltd Revenue Growth Rate in Chimeric Antigen Receptor Cell Therapy Business (2020-2025)
Figure 76. Sorrento Therapeutics Inc Revenue Growth Rate in Chimeric Antigen Receptor Cell Therapy Business (2020-2025)
Figure 77. Takara Bio Inc Revenue Growth Rate in Chimeric Antigen Receptor Cell Therapy Business (2020-2025)
Figure 78. Bottom-up and Top-down Approaches for This Report
Figure 79. Data Triangulation
Figure 80. Key Executives Interviewed