1 Market Overview
1.1 Blended Cooking Oil Product Introduction
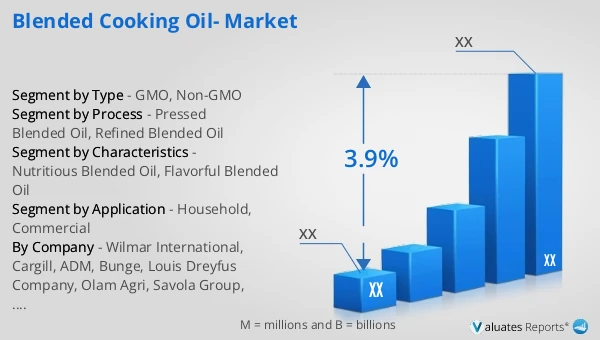
1.2 Global Blended Cooking Oil Market Size Forecast
1.2.1 Global Blended Cooking Oil Sales Value (2021–2032)
1.2.2 Global Blended Cooking Oil Sales Volume (2021–2032)
1.2.3 Global Blended Cooking Oil Sales Price (2021–2032)
1.3 Blended Cooking Oil Market Trends & Drivers
1.3.1 Blended Cooking Oil Industry Trends
1.3.2 Blended Cooking Oil Market Drivers & Opportunities
1.3.3 Blended Cooking Oil Market Challenges
1.3.4 Blended Cooking Oil Market Restraints
1.3.5 Impact of U.S. Tariffs
1.4 Assumptions and Limitations
1.5 Study Objectives
1.6 Years Considered
2 Competitive Analysis by Company
2.1 Global Blended Cooking Oil Players Revenue Ranking (2025)
2.2 Global Blended Cooking Oil Revenue by Company (2021–2026)
2.3 Global Blended Cooking Oil Sales Volume Ranking of Players (2025)
2.4 Global Blended Cooking Oil Sales Volume by Company (2021–2026)
2.5 Global Blended Cooking Oil Average Price by Company (2021–2026)
2.6 Key Manufacturers Blended Cooking Oil Manufacturing Base and Headquarters
2.7 Key Manufacturers Blended Cooking Oil Product Offerings
2.8 Key Manufacturers Start of Mass Production of Blended Cooking Oil
2.9 Blended Cooking Oil Market Competitive Analysis
2.9.1 Blended Cooking Oil Market Concentration Rate (2021–2026)
2.9.2 Global 5 and 10 Largest Manufacturers by Blended Cooking Oil Revenue in 2025
2.9.3 Global Companies by Tier (Tier 1, Tier 2, Tier 3), based on Blended Cooking Oil revenue, 2025
2.10 Mergers & Acquisitions and Expansion
3 Segmentation Blended Cooking Oil Market Classification
3.1 Introduction by Type
3.1.1 GMO
3.1.2 Non-GMO
3.1.3 Global Blended Cooking Oil Sales Value by Type
3.1.3.1 Global Blended Cooking Oil Sales Value by Type (2021 vs 2025 vs 2032)
3.1.3.2 Global Blended Cooking Oil Sales Value, by Type (2021–2032)
3.1.3.3 Global Blended Cooking Oil Sales Value, by Type (%), 2021–2032
3.1.4 Global Blended Cooking Oil Sales Volume by Type
3.1.4.1 Global Blended Cooking Oil Sales Volume by Type (2021 vs 2025 vs 2032)
3.1.4.2 Global Blended Cooking Oil Sales Volume, by Type (2021–2032)
3.1.4.3 Global Blended Cooking Oil Sales Volume, by Type (%), 2021–2032
3.1.5 Global Blended Cooking Oil Average Price by Type (2021–2032)
3.2 Introduction by Process
3.2.1 Pressed Blended Oil
3.2.2 Refined Blended Oil
3.2.3 Global Blended Cooking Oil Sales Value by Process
3.2.3.1 Global Blended Cooking Oil Sales Value by Process (2021 vs 2025 vs 2032)
3.2.3.2 Global Blended Cooking Oil Sales Value, by Process (2021–2032)
3.2.3.3 Global Blended Cooking Oil Sales Value, by Process (%), 2021–2032
3.2.4 Global Blended Cooking Oil Sales Volume by Process
3.2.4.1 Global Blended Cooking Oil Sales Volume by Process (2021 vs 2025 vs 2032)
3.2.4.2 Global Blended Cooking Oil Sales Volume, by Process (2021–2032)
3.2.4.3 Global Blended Cooking Oil Sales Volume, by Process (%), 2021–2032
3.2.5 Global Blended Cooking Oil Average Price by Process (2021–2032)
3.3 Introduction by Characteristics
3.3.1 Nutritious Blended Oil
3.3.2 Flavorful Blended Oil
3.3.3 Global Blended Cooking Oil Sales Value by Characteristics
3.3.3.1 Global Blended Cooking Oil Sales Value by Characteristics (2021 vs 2025 vs 2032)
3.3.3.2 Global Blended Cooking Oil Sales Value, by Characteristics (2021–2032)
3.3.3.3 Global Blended Cooking Oil Sales Value, by Characteristics (%), 2021–2032
3.3.4 Global Blended Cooking Oil Sales Volume by Characteristics
3.3.4.1 Global Blended Cooking Oil Sales Volume by Characteristics (2021 vs 2025 vs 2032)
3.3.4.2 Global Blended Cooking Oil Sales Volume, by Characteristics (2021–2032)
3.3.4.3 Global Blended Cooking Oil Sales Volume, by Characteristics (%), 2021–2032
3.3.5 Global Blended Cooking Oil Average Price by Characteristics (2021–2032)
4 Segmentation by Application
4.1 Introduction by Application
4.1.1 Household
4.1.2 Commercial
4.2 Global Blended Cooking Oil Sales Value by Application
4.2.1 Global Blended Cooking Oil Sales Value by Application (2021 vs 2025 vs 2032)
4.2.2 Global Blended Cooking Oil Sales Value, by Application (2021–2032)
4.2.3 Global Blended Cooking Oil Sales Value, by Application (%), 2021–2032
4.3 Global Blended Cooking Oil Sales Volume by Application
4.3.1 Global Blended Cooking Oil Sales Volume by Application (2021 vs 2025 vs 2032)
4.3.2 Global Blended Cooking Oil Sales Volume, by Application (2021–2032)
4.3.3 Global Blended Cooking Oil Sales Volume, by Application (%), 2021–2032
4.4 Global Blended Cooking Oil Average Price by Application (2021–2032)
5 Segmentation by Region
5.1 Global Blended Cooking Oil Sales Value by Region
5.1.1 Global Blended Cooking Oil Sales Value by Region: 2021 vs 2025 vs 2032
5.1.2 Global Blended Cooking Oil Sales Value by Region (2021–2026)
5.1.3 Global Blended Cooking Oil Sales Value by Region (2027–2032)
5.1.4 Global Blended Cooking Oil Sales Value by Region (%), 2021–2032
5.2 Global Blended Cooking Oil Sales Volume by Region
5.2.1 Global Blended Cooking Oil Sales Volume by Region: 2021 vs 2025 vs 2032
5.2.2 Global Blended Cooking Oil Sales Volume by Region (2021–2026)
5.2.3 Global Blended Cooking Oil Sales Volume by Region (2027–2032)
5.2.4 Global Blended Cooking Oil Sales Volume by Region (%), 2021–2032
5.3 Global Blended Cooking Oil Average Price by Region (2021–2032)
5.4 North America
5.4.1 North America Blended Cooking Oil Sales Value, 2021–2032
5.4.2 North America Blended Cooking Oil Sales Value by Country (%), 2025 vs 2032
5.5 Europe
5.5.1 Europe Blended Cooking Oil Sales Value, 2021–2032
5.5.2 Europe Blended Cooking Oil Sales Value by Country (%), 2025 vs 2032
5.6 Asia Pacific
5.6.1 Asia Pacific Blended Cooking Oil Sales Value, 2021–2032
5.6.2 Asia Pacific Blended Cooking Oil Sales Value by Region (%), 2025 vs 2032
5.7 South America
5.7.1 South America Blended Cooking Oil Sales Value, 2021–2032
5.7.2 South America Blended Cooking Oil Sales Value by Country (%), 2025 vs 2032
5.8 Middle East & Africa
5.8.1 Middle East & Africa Blended Cooking Oil Sales Value, 2021–2032
5.8.2 Middle East & Africa Blended Cooking Oil Sales Value by Country (%), 2025 vs 2032
6 Segmentation by Key Countries/Regions
6.1 Key Countries/Regions Blended Cooking Oil Sales Value Growth Trends, 2021 vs 2025 vs 2032
6.2 Key Countries/Regions Blended Cooking Oil Sales Value and Sales Volume
6.2.1 Key Countries/Regions Blended Cooking Oil Sales Value, 2021–2032
6.2.2 Key Countries/Regions Blended Cooking Oil Sales Volume, 2021–2032
6.3 United States
6.3.1 United States Blended Cooking Oil Sales Value, 2021–2032
6.3.2 United States Blended Cooking Oil Sales Value by Type (%), 2025 vs 2032
6.3.3 United States Blended Cooking Oil Sales Value by Application, 2025 vs 2032
6.4 Europe
6.4.1 Europe Blended Cooking Oil Sales Value, 2021–2032
6.4.2 Europe Blended Cooking Oil Sales Value by Type (%), 2025 vs 2032
6.4.3 Europe Blended Cooking Oil Sales Value by Application, 2025 vs 2032
6.5 China
6.5.1 China Blended Cooking Oil Sales Value, 2021–2032
6.5.2 China Blended Cooking Oil Sales Value by Type (%), 2025 vs 2032
6.5.3 China Blended Cooking Oil Sales Value by Application, 2025 vs 2032
6.6 Japan
6.6.1 Japan Blended Cooking Oil Sales Value, 2021–2032
6.6.2 Japan Blended Cooking Oil Sales Value by Type (%), 2025 vs 2032
6.6.3 Japan Blended Cooking Oil Sales Value by Application, 2025 vs 2032
6.7 South Korea
6.7.1 South Korea Blended Cooking Oil Sales Value, 2021–2032
6.7.2 South Korea Blended Cooking Oil Sales Value by Type (%), 2025 vs 2032
6.7.3 South Korea Blended Cooking Oil Sales Value by Application, 2025 vs 2032
6.8 Southeast Asia
6.8.1 Southeast Asia Blended Cooking Oil Sales Value, 2021–2032
6.8.2 Southeast Asia Blended Cooking Oil Sales Value by Type (%), 2025 vs 2032
6.8.3 Southeast Asia Blended Cooking Oil Sales Value by Application, 2025 vs 2032
6.9 India
6.9.1 India Blended Cooking Oil Sales Value, 2021–2032
6.9.2 India Blended Cooking Oil Sales Value by Type (%), 2025 vs 2032
6.9.3 India Blended Cooking Oil Sales Value by Application, 2025 vs 2032
7 Company Profiles
7.1 Wilmar International
7.1.1 Wilmar International Company Information
7.1.2 Wilmar International Introduction and Business Overview
7.1.3 Wilmar International Blended Cooking Oil Sales, Revenue, Price and Gross Margin (2021–2026)
7.1.4 Wilmar International Blended Cooking Oil Product Offerings
7.1.5 Wilmar International Recent Developments
7.2 Cargill
7.2.1 Cargill Company Information
7.2.2 Cargill Introduction and Business Overview
7.2.3 Cargill Blended Cooking Oil Sales, Revenue, Price and Gross Margin (2021–2026)
7.2.4 Cargill Blended Cooking Oil Product Offerings
7.2.5 Cargill Recent Developments
7.3 ADM
7.3.1 ADM Company Information
7.3.2 ADM Introduction and Business Overview
7.3.3 ADM Blended Cooking Oil Sales, Revenue, Price and Gross Margin (2021–2026)
7.3.4 ADM Blended Cooking Oil Product Offerings
7.3.5 ADM Recent Developments
7.4 Bunge
7.4.1 Bunge Company Information
7.4.2 Bunge Introduction and Business Overview
7.4.3 Bunge Blended Cooking Oil Sales, Revenue, Price and Gross Margin (2021–2026)
7.4.4 Bunge Blended Cooking Oil Product Offerings
7.4.5 Bunge Recent Developments
7.5 Louis Dreyfus Company
7.5.1 Louis Dreyfus Company Company Information
7.5.2 Louis Dreyfus Company Introduction and Business Overview
7.5.3 Louis Dreyfus Company Blended Cooking Oil Sales, Revenue, Price and Gross Margin (2021–2026)
7.5.4 Louis Dreyfus Company Blended Cooking Oil Product Offerings
7.5.5 Louis Dreyfus Company Recent Developments
7.6 Olam Agri
7.6.1 Olam Agri Company Information
7.6.2 Olam Agri Introduction and Business Overview
7.6.3 Olam Agri Blended Cooking Oil Sales, Revenue, Price and Gross Margin (2021–2026)
7.6.4 Olam Agri Blended Cooking Oil Product Offerings
7.6.5 Olam Agri Recent Developments
7.7 Savola Group
7.7.1 Savola Group Company Information
7.7.2 Savola Group Introduction and Business Overview
7.7.3 Savola Group Blended Cooking Oil Sales, Revenue, Price and Gross Margin (2021–2026)
7.7.4 Savola Group Blended Cooking Oil Product Offerings
7.7.5 Savola Group Recent Developments
7.8 Marico
7.8.1 Marico Company Information
7.8.2 Marico Introduction and Business Overview
7.8.3 Marico Blended Cooking Oil Sales, Revenue, Price and Gross Margin (2021–2026)
7.8.4 Marico Blended Cooking Oil Product Offerings
7.8.5 Marico Recent Developments
7.9 COFCO
7.9.1 COFCO Company Information
7.9.2 COFCO Introduction and Business Overview
7.9.3 COFCO Blended Cooking Oil Sales, Revenue, Price and Gross Margin (2021–2026)
7.9.4 COFCO Blended Cooking Oil Product Offerings
7.9.5 COFCO Recent Developments
7.10 Jiusan
7.10.1 Jiusan Company Information
7.10.2 Jiusan Introduction and Business Overview
7.10.3 Jiusan Blended Cooking Oil Sales, Revenue, Price and Gross Margin (2021–2026)
7.10.4 Jiusan Blended Cooking Oil Product Offerings
7.10.5 Jiusan Recent Developments
7.11 Luhua
7.11.1 Luhua Company Information
7.11.2 Luhua Introduction and Business Overview
7.11.3 Luhua Blended Cooking Oil Sales, Revenue, Price and Gross Margin (2021–2026)
7.11.4 Luhua Blended Cooking Oil Product Offerings
7.11.5 Luhua Recent Developments
7.12 DaoDaoQuan
7.12.1 DaoDaoQuan Company Information
7.12.2 DaoDaoQuan Introduction and Business Overview
7.12.3 DaoDaoQuan Blended Cooking Oil Sales, Revenue, Price and Gross Margin (2021–2026)
7.12.4 DaoDaoQuan Blended Cooking Oil Product Offerings
7.12.5 DaoDaoQuan Recent Developments
7.13 Yihai Kerry Arawana
7.13.1 Yihai Kerry Arawana Company Information
7.13.2 Yihai Kerry Arawana Introduction and Business Overview
7.13.3 Yihai Kerry Arawana Blended Cooking Oil Sales, Revenue, Price and Gross Margin (2021–2026)
7.13.4 Yihai Kerry Arawana Blended Cooking Oil Product Offerings
7.13.5 Yihai Kerry Arawana Recent Developments
7.14 DaoDaoQuan
7.14.1 DaoDaoQuan Company Information
7.14.2 DaoDaoQuan Introduction and Business Overview
7.14.3 DaoDaoQuan Blended Cooking Oil Sales, Revenue, Price and Gross Margin (2021–2026)
7.14.4 DaoDaoQuan Blended Cooking Oil Product Offerings
7.14.5 DaoDaoQuan Recent Developments
7.15 Xiwang
7.15.1 Xiwang Company Information
7.15.2 Xiwang Introduction and Business Overview
7.15.3 Xiwang Blended Cooking Oil Sales, Revenue, Price and Gross Margin (2021–2026)
7.15.4 Xiwang Blended Cooking Oil Product Offerings
7.15.5 Xiwang Recent Developments
8 Industry Chain Analysis
8.1 Blended Cooking Oil Industrial Chain
8.2 Blended Cooking Oil Upstream Analysis
8.2.1 Key Raw Materials
8.2.2 Key Suppliers of Raw Materials
8.2.3 Manufacturing Cost Structure
8.3 Midstream Analysis
8.4 Downstream Analysis (Customer Analysis)
8.5 Sales Model and Sales Channelss
8.5.1 Blended Cooking Oil Sales Model
8.5.2 Sales Channels
8.5.3 Blended Cooking Oil Distributors
9 Research Findings and Conclusion
10 Appendix
10.1 Research Methodology
10.1.1 Methodology/Research Approach
10.1.1.1 Research Programs/Design
10.1.1.2 Market Size Estimation
10.1.1.3 Market Breakdown and Data Triangulation
10.1.2 Data Source
10.1.2.1 Secondary Sources
10.1.2.2 Primary Sources
10.2 Author Details
10.3 Disclaimer