1 Market Overview
1.1 Epoxy Accelerator Product Introduction
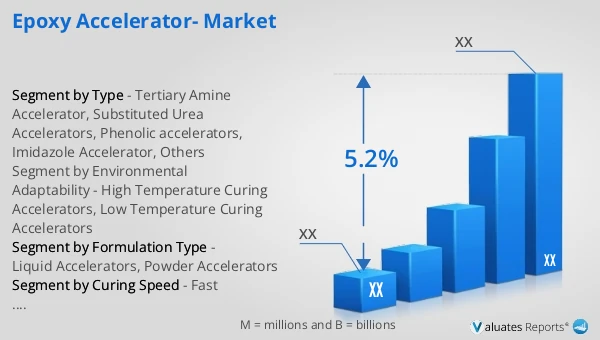
1.2 Global Epoxy Accelerator Market Size Forecast
1.2.1 Global Epoxy Accelerator Sales Value (2021–2032)
1.2.2 Global Epoxy Accelerator Sales Volume (2021–2032)
1.2.3 Global Epoxy Accelerator Sales Price (2021–2032)
1.3 Epoxy Accelerator Market Trends & Drivers
1.3.1 Epoxy Accelerator Industry Trends
1.3.2 Epoxy Accelerator Market Drivers & Opportunities
1.3.3 Epoxy Accelerator Market Challenges
1.3.4 Epoxy Accelerator Market Restraints
1.3.5 Impact of U.S. Tariffs
1.4 Assumptions and Limitations
1.5 Study Objectives
1.6 Years Considered
2 Competitive Analysis by Company
2.1 Global Epoxy Accelerator Players Revenue Ranking (2025)
2.2 Global Epoxy Accelerator Revenue by Company (2021–2026)
2.3 Global Epoxy Accelerator Sales Volume Ranking of Players (2025)
2.4 Global Epoxy Accelerator Sales Volume by Company (2021–2026)
2.5 Global Epoxy Accelerator Average Price by Company (2021–2026)
2.6 Key Manufacturers Epoxy Accelerator Manufacturing Base and Headquarters
2.7 Key Manufacturers Epoxy Accelerator Product Offerings
2.8 Key Manufacturers Start of Mass Production of Epoxy Accelerator
2.9 Epoxy Accelerator Market Competitive Analysis
2.9.1 Epoxy Accelerator Market Concentration Rate (2021–2026)
2.9.2 Global 5 and 10 Largest Manufacturers by Epoxy Accelerator Revenue in 2025
2.9.3 Global Companies by Tier (Tier 1, Tier 2, Tier 3), based on Epoxy Accelerator revenue, 2025
2.10 Mergers & Acquisitions and Expansion
3 Segmentation Epoxy Accelerator Market Classification
3.1 Introduction by Type
3.1.1 Tertiary Amine Accelerator
3.1.2 Substituted Urea Accelerators
3.1.3 Phenolic accelerators
3.1.4 Imidazole Accelerator
3.1.5 Others
3.1.6 Global Epoxy Accelerator Sales Value by Type
3.1.6.1 Global Epoxy Accelerator Sales Value by Type (2021 vs 2025 vs 2032)
3.1.6.2 Global Epoxy Accelerator Sales Value, by Type (2021–2032)
3.1.6.3 Global Epoxy Accelerator Sales Value, by Type (%), 2021–2032
3.1.7 Global Epoxy Accelerator Sales Volume by Type
3.1.7.1 Global Epoxy Accelerator Sales Volume by Type (2021 vs 2025 vs 2032)
3.1.7.2 Global Epoxy Accelerator Sales Volume, by Type (2021–2032)
3.1.7.3 Global Epoxy Accelerator Sales Volume, by Type (%), 2021–2032
3.1.8 Global Epoxy Accelerator Average Price by Type (2021–2032)
3.2 Introduction by Curing Speed
3.2.1 Fast Curing Accelerators
3.2.2 Slow Curing Accelerators
3.2.3 Global Epoxy Accelerator Sales Value by Curing Speed
3.2.3.1 Global Epoxy Accelerator Sales Value by Curing Speed (2021 vs 2025 vs 2032)
3.2.3.2 Global Epoxy Accelerator Sales Value, by Curing Speed (2021–2032)
3.2.3.3 Global Epoxy Accelerator Sales Value, by Curing Speed (%), 2021–2032
3.2.4 Global Epoxy Accelerator Sales Volume by Curing Speed
3.2.4.1 Global Epoxy Accelerator Sales Volume by Curing Speed (2021 vs 2025 vs 2032)
3.2.4.2 Global Epoxy Accelerator Sales Volume, by Curing Speed (2021–2032)
3.2.4.3 Global Epoxy Accelerator Sales Volume, by Curing Speed (%), 2021–2032
3.2.5 Global Epoxy Accelerator Average Price by Curing Speed (2021–2032)
3.3 Introduction by Formulation Type
3.3.1 Liquid Accelerators
3.3.2 Powder Accelerators
3.3.3 Global Epoxy Accelerator Sales Value by Formulation Type
3.3.3.1 Global Epoxy Accelerator Sales Value by Formulation Type (2021 vs 2025 vs 2032)
3.3.3.2 Global Epoxy Accelerator Sales Value, by Formulation Type (2021–2032)
3.3.3.3 Global Epoxy Accelerator Sales Value, by Formulation Type (%), 2021–2032
3.3.4 Global Epoxy Accelerator Sales Volume by Formulation Type
3.3.4.1 Global Epoxy Accelerator Sales Volume by Formulation Type (2021 vs 2025 vs 2032)
3.3.4.2 Global Epoxy Accelerator Sales Volume, by Formulation Type (2021–2032)
3.3.4.3 Global Epoxy Accelerator Sales Volume, by Formulation Type (%), 2021–2032
3.3.5 Global Epoxy Accelerator Average Price by Formulation Type (2021–2032)
3.4 Introduction by Environmental Adaptability
3.4.1 High Temperature Curing Accelerators
3.4.2 Low Temperature Curing Accelerators
3.4.3 Global Epoxy Accelerator Sales Value by Environmental Adaptability
3.4.3.1 Global Epoxy Accelerator Sales Value by Environmental Adaptability (2021 vs 2025 vs 2032)
3.4.3.2 Global Epoxy Accelerator Sales Value, by Environmental Adaptability (2021–2032)
3.4.3.3 Global Epoxy Accelerator Sales Value, by Environmental Adaptability (%), 2021–2032
3.4.4 Global Epoxy Accelerator Sales Volume by Environmental Adaptability
3.4.4.1 Global Epoxy Accelerator Sales Volume by Environmental Adaptability (2021 vs 2025 vs 2032)
3.4.4.2 Global Epoxy Accelerator Sales Volume, by Environmental Adaptability (2021–2032)
3.4.4.3 Global Epoxy Accelerator Sales Volume, by Environmental Adaptability (%), 2021–2032
3.4.5 Global Epoxy Accelerator Average Price by Environmental Adaptability (2021–2032)
4 Segmentation by Application
4.1 Introduction by Application
4.1.1 Medical
4.1.2 Construction
4.1.3 Aerospace
4.1.4 Automobile
4.1.5 Others
4.2 Global Epoxy Accelerator Sales Value by Application
4.2.1 Global Epoxy Accelerator Sales Value by Application (2021 vs 2025 vs 2032)
4.2.2 Global Epoxy Accelerator Sales Value, by Application (2021–2032)
4.2.3 Global Epoxy Accelerator Sales Value, by Application (%), 2021–2032
4.3 Global Epoxy Accelerator Sales Volume by Application
4.3.1 Global Epoxy Accelerator Sales Volume by Application (2021 vs 2025 vs 2032)
4.3.2 Global Epoxy Accelerator Sales Volume, by Application (2021–2032)
4.3.3 Global Epoxy Accelerator Sales Volume, by Application (%), 2021–2032
4.4 Global Epoxy Accelerator Average Price by Application (2021–2032)
5 Segmentation by Region
5.1 Global Epoxy Accelerator Sales Value by Region
5.1.1 Global Epoxy Accelerator Sales Value by Region: 2021 vs 2025 vs 2032
5.1.2 Global Epoxy Accelerator Sales Value by Region (2021–2026)
5.1.3 Global Epoxy Accelerator Sales Value by Region (2027–2032)
5.1.4 Global Epoxy Accelerator Sales Value by Region (%), 2021–2032
5.2 Global Epoxy Accelerator Sales Volume by Region
5.2.1 Global Epoxy Accelerator Sales Volume by Region: 2021 vs 2025 vs 2032
5.2.2 Global Epoxy Accelerator Sales Volume by Region (2021–2026)
5.2.3 Global Epoxy Accelerator Sales Volume by Region (2027–2032)
5.2.4 Global Epoxy Accelerator Sales Volume by Region (%), 2021–2032
5.3 Global Epoxy Accelerator Average Price by Region (2021–2032)
5.4 North America
5.4.1 North America Epoxy Accelerator Sales Value, 2021–2032
5.4.2 North America Epoxy Accelerator Sales Value by Country (%), 2025 vs 2032
5.5 Europe
5.5.1 Europe Epoxy Accelerator Sales Value, 2021–2032
5.5.2 Europe Epoxy Accelerator Sales Value by Country (%), 2025 vs 2032
5.6 Asia Pacific
5.6.1 Asia Pacific Epoxy Accelerator Sales Value, 2021–2032
5.6.2 Asia Pacific Epoxy Accelerator Sales Value by Region (%), 2025 vs 2032
5.7 South America
5.7.1 South America Epoxy Accelerator Sales Value, 2021–2032
5.7.2 South America Epoxy Accelerator Sales Value by Country (%), 2025 vs 2032
5.8 Middle East & Africa
5.8.1 Middle East & Africa Epoxy Accelerator Sales Value, 2021–2032
5.8.2 Middle East & Africa Epoxy Accelerator Sales Value by Country (%), 2025 vs 2032
6 Segmentation by Key Countries/Regions
6.1 Key Countries/Regions Epoxy Accelerator Sales Value Growth Trends, 2021 vs 2025 vs 2032
6.2 Key Countries/Regions Epoxy Accelerator Sales Value and Sales Volume
6.2.1 Key Countries/Regions Epoxy Accelerator Sales Value, 2021–2032
6.2.2 Key Countries/Regions Epoxy Accelerator Sales Volume, 2021–2032
6.3 United States
6.3.1 United States Epoxy Accelerator Sales Value, 2021–2032
6.3.2 United States Epoxy Accelerator Sales Value by Type (%), 2025 vs 2032
6.3.3 United States Epoxy Accelerator Sales Value by Application, 2025 vs 2032
6.4 Europe
6.4.1 Europe Epoxy Accelerator Sales Value, 2021–2032
6.4.2 Europe Epoxy Accelerator Sales Value by Type (%), 2025 vs 2032
6.4.3 Europe Epoxy Accelerator Sales Value by Application, 2025 vs 2032
6.5 China
6.5.1 China Epoxy Accelerator Sales Value, 2021–2032
6.5.2 China Epoxy Accelerator Sales Value by Type (%), 2025 vs 2032
6.5.3 China Epoxy Accelerator Sales Value by Application, 2025 vs 2032
6.6 Japan
6.6.1 Japan Epoxy Accelerator Sales Value, 2021–2032
6.6.2 Japan Epoxy Accelerator Sales Value by Type (%), 2025 vs 2032
6.6.3 Japan Epoxy Accelerator Sales Value by Application, 2025 vs 2032
6.7 South Korea
6.7.1 South Korea Epoxy Accelerator Sales Value, 2021–2032
6.7.2 South Korea Epoxy Accelerator Sales Value by Type (%), 2025 vs 2032
6.7.3 South Korea Epoxy Accelerator Sales Value by Application, 2025 vs 2032
6.8 Southeast Asia
6.8.1 Southeast Asia Epoxy Accelerator Sales Value, 2021–2032
6.8.2 Southeast Asia Epoxy Accelerator Sales Value by Type (%), 2025 vs 2032
6.8.3 Southeast Asia Epoxy Accelerator Sales Value by Application, 2025 vs 2032
6.9 India
6.9.1 India Epoxy Accelerator Sales Value, 2021–2032
6.9.2 India Epoxy Accelerator Sales Value by Type (%), 2025 vs 2032
6.9.3 India Epoxy Accelerator Sales Value by Application, 2025 vs 2032
7 Company Profiles
7.1 Uzin Utz
7.1.1 Uzin Utz Company Information
7.1.2 Uzin Utz Introduction and Business Overview
7.1.3 Uzin Utz Epoxy Accelerator Sales, Revenue, Price and Gross Margin (2021–2026)
7.1.4 Uzin Utz Epoxy Accelerator Product Offerings
7.1.5 Uzin Utz Recent Developments
7.2 Wagon Paints
7.2.1 Wagon Paints Company Information
7.2.2 Wagon Paints Introduction and Business Overview
7.2.3 Wagon Paints Epoxy Accelerator Sales, Revenue, Price and Gross Margin (2021–2026)
7.2.4 Wagon Paints Epoxy Accelerator Product Offerings
7.2.5 Wagon Paints Recent Developments
7.3 Epirez
7.3.1 Epirez Company Information
7.3.2 Epirez Introduction and Business Overview
7.3.3 Epirez Epoxy Accelerator Sales, Revenue, Price and Gross Margin (2021–2026)
7.3.4 Epirez Epoxy Accelerator Product Offerings
7.3.5 Epirez Recent Developments
7.4 Altex Coatings
7.4.1 Altex Coatings Company Information
7.4.2 Altex Coatings Introduction and Business Overview
7.4.3 Altex Coatings Epoxy Accelerator Sales, Revenue, Price and Gross Margin (2021–2026)
7.4.4 Altex Coatings Epoxy Accelerator Product Offerings
7.4.5 Altex Coatings Recent Developments
7.5 RPM International
7.5.1 RPM International Company Information
7.5.2 RPM International Introduction and Business Overview
7.5.3 RPM International Epoxy Accelerator Sales, Revenue, Price and Gross Margin (2021–2026)
7.5.4 RPM International Epoxy Accelerator Product Offerings
7.5.5 RPM International Recent Developments
7.6 Tnemec Company, Inc.
7.6.1 Tnemec Company, Inc. Company Information
7.6.2 Tnemec Company, Inc. Introduction and Business Overview
7.6.3 Tnemec Company, Inc. Epoxy Accelerator Sales, Revenue, Price and Gross Margin (2021–2026)
7.6.4 Tnemec Company, Inc. Epoxy Accelerator Product Offerings
7.6.5 Tnemec Company, Inc. Recent Developments
7.7 Huntsman Corporation
7.7.1 Huntsman Corporation Company Information
7.7.2 Huntsman Corporation Introduction and Business Overview
7.7.3 Huntsman Corporation Epoxy Accelerator Sales, Revenue, Price and Gross Margin (2021–2026)
7.7.4 Huntsman Corporation Epoxy Accelerator Product Offerings
7.7.5 Huntsman Corporation Recent Developments
7.8 Westcoat Specialty Coating Systems
7.8.1 Westcoat Specialty Coating Systems Company Information
7.8.2 Westcoat Specialty Coating Systems Introduction and Business Overview
7.8.3 Westcoat Specialty Coating Systems Epoxy Accelerator Sales, Revenue, Price and Gross Margin (2021–2026)
7.8.4 Westcoat Specialty Coating Systems Epoxy Accelerator Product Offerings
7.8.5 Westcoat Specialty Coating Systems Recent Developments
7.9 Epoxy2U
7.9.1 Epoxy2U Company Information
7.9.2 Epoxy2U Introduction and Business Overview
7.9.3 Epoxy2U Epoxy Accelerator Sales, Revenue, Price and Gross Margin (2021–2026)
7.9.4 Epoxy2U Epoxy Accelerator Product Offerings
7.9.5 Epoxy2U Recent Developments
7.10 PPG Industries
7.10.1 PPG Industries Company Information
7.10.2 PPG Industries Introduction and Business Overview
7.10.3 PPG Industries Epoxy Accelerator Sales, Revenue, Price and Gross Margin (2021–2026)
7.10.4 PPG Industries Epoxy Accelerator Product Offerings
7.10.5 PPG Industries Recent Developments
7.11 Krypton Chemical, S.L.
7.11.1 Krypton Chemical, S.L. Company Information
7.11.2 Krypton Chemical, S.L. Introduction and Business Overview
7.11.3 Krypton Chemical, S.L. Epoxy Accelerator Sales, Revenue, Price and Gross Margin (2021–2026)
7.11.4 Krypton Chemical, S.L. Epoxy Accelerator Product Offerings
7.11.5 Krypton Chemical, S.L. Recent Developments
7.12 Gloriaful Industry
7.12.1 Gloriaful Industry Company Information
7.12.2 Gloriaful Industry Introduction and Business Overview
7.12.3 Gloriaful Industry Epoxy Accelerator Sales, Revenue, Price and Gross Margin (2021–2026)
7.12.4 Gloriaful Industry Epoxy Accelerator Product Offerings
7.12.5 Gloriaful Industry Recent Developments
7.13 West System Epoxy
7.13.1 West System Epoxy Company Information
7.13.2 West System Epoxy Introduction and Business Overview
7.13.3 West System Epoxy Epoxy Accelerator Sales, Revenue, Price and Gross Margin (2021–2026)
7.13.4 West System Epoxy Epoxy Accelerator Product Offerings
7.13.5 West System Epoxy Recent Developments
7.14 Changzhou SFHGYX
7.14.1 Changzhou SFHGYX Company Information
7.14.2 Changzhou SFHGYX Introduction and Business Overview
7.14.3 Changzhou SFHGYX Epoxy Accelerator Sales, Revenue, Price and Gross Margin (2021–2026)
7.14.4 Changzhou SFHGYX Epoxy Accelerator Product Offerings
7.14.5 Changzhou SFHGYX Recent Developments
7.15 Leggari
7.15.1 Leggari Company Information
7.15.2 Leggari Introduction and Business Overview
7.15.3 Leggari Epoxy Accelerator Sales, Revenue, Price and Gross Margin (2021–2026)
7.15.4 Leggari Epoxy Accelerator Product Offerings
7.15.5 Leggari Recent Developments
7.16 ITW Polymers and Fluids
7.16.1 ITW Polymers and Fluids Company Information
7.16.2 ITW Polymers and Fluids Introduction and Business Overview
7.16.3 ITW Polymers and Fluids Epoxy Accelerator Sales, Revenue, Price and Gross Margin (2021–2026)
7.16.4 ITW Polymers and Fluids Epoxy Accelerator Product Offerings
7.16.5 ITW Polymers and Fluids Recent Developments
7.17 Arturo
7.17.1 Arturo Company Information
7.17.2 Arturo Introduction and Business Overview
7.17.3 Arturo Epoxy Accelerator Sales, Revenue, Price and Gross Margin (2021–2026)
7.17.4 Arturo Epoxy Accelerator Product Offerings
7.17.5 Arturo Recent Developments
7.18 All Purpose Coatings
7.18.1 All Purpose Coatings Company Information
7.18.2 All Purpose Coatings Introduction and Business Overview
7.18.3 All Purpose Coatings Epoxy Accelerator Sales, Revenue, Price and Gross Margin (2021–2026)
7.18.4 All Purpose Coatings Epoxy Accelerator Product Offerings
7.18.5 All Purpose Coatings Recent Developments
7.19 Ddchem
7.19.1 Ddchem Company Information
7.19.2 Ddchem Introduction and Business Overview
7.19.3 Ddchem Epoxy Accelerator Sales, Revenue, Price and Gross Margin (2021–2026)
7.19.4 Ddchem Epoxy Accelerator Product Offerings
7.19.5 Ddchem Recent Developments
8 Industry Chain Analysis
8.1 Epoxy Accelerator Industrial Chain
8.2 Epoxy Accelerator Upstream Analysis
8.2.1 Key Raw Materials
8.2.2 Key Suppliers of Raw Materials
8.2.3 Manufacturing Cost Structure
8.3 Midstream Analysis
8.4 Downstream Analysis (Customer Analysis)
8.5 Sales Model and Sales Channelss
8.5.1 Epoxy Accelerator Sales Model
8.5.2 Sales Channels
8.5.3 Epoxy Accelerator Distributors
9 Research Findings and Conclusion
10 Appendix
10.1 Research Methodology
10.1.1 Methodology/Research Approach
10.1.1.1 Research Programs/Design
10.1.1.2 Market Size Estimation
10.1.1.3 Market Breakdown and Data Triangulation
10.1.2 Data Source
10.1.2.1 Secondary Sources
10.1.2.2 Primary Sources
10.2 Author Details
10.3 Disclaimer