0
U.S. (TOLL FREE)
+1 (315) 215-3225
Automative

0
U.S. (TOLL FREE)
+1 (315) 215-3225
Magnesite Clinkers - Global Market Share and Ranking, Overall Sales and Demand Forecast 2024-2030
Published Date: October 2024
|
Report Code: QYRE-Auto-21C8001
Home | Market Reports | Business & Industrial| Chemicals Industry
Global Magnesite Clinkers Market Insights Forecast to 2028
BUY CHAPTERS

Magnesite Clinkers - Global Market Share and Ranking, Overall Sales and Demand Forecast 2024-2030

Code: QYRE-Auto-21C8001
Report
October 2024
Pages:169
QYResearch
Buy Now with 15% Discount
DESCRIPTION
TABLE OF CONTENT
TABLES & FIGURES

Magnesite Clinkers - Market Size

The global market for Magnesite Clinkers was estimated to be worth US$ 7360 million in 2023 and is forecast to a readjusted size of US$ 10270 million by 2030 with a CAGR of 4.4% during the forecast period 2024-2030

Magnesite Clinkers - Market

Magnesite Clinkers - Market

Magnesite clinker, also known as sintered magnesite, is made of magnesite, magnesite or magnesium hydroxide from the reaction of sea water and lime milk by calcining at high temperature, with strong hydration ability.It is mainly used for making basic refractory materials, such as magnesia brick and magnesia alumina brick.
Magnesia is one of the important raw materials for refractories, and is used to manufacture various magnesia bricks, magnesia-alumina bricks, ramming materials, furnace repair materials, etc. Using high-temperature equipment such as shaft kilns and rotary kilns for one-time calcination or two-step calcination process, the magnesite fired with natural magnesite as raw material is called sintered magnesite; magnesite is smelted with electric arc furnace as raw material to reach molten state and cooled The latter is called fused magnesia, of which sintered magnesia occupies a larger market share. Magnesia is used in various industries, and the terminal is mainly refractory materials, which are used as refractory layers in the iron and steel industry, glass and ceramics. The global magnesia head market is mainly occupied by European and Chinese companies, and the market share of the top five companies in the world exceeds 30%.

Report Scope

This report aims to provide a comprehensive presentation of the global market for Magnesite Clinkers, focusing on the total sales volume, sales revenue, price, key companies market share and ranking, together with an analysis of Magnesite Clinkers by region & country, by Type, and by Application.
The Magnesite Clinkers market size, estimations, and forecasts are provided in terms of sales volume (Kiloton) and sales revenue ($ millions), considering 2023 as the base year, with history and forecast data for the period from 2019 to 2030. With both quantitative and qualitative analysis, to help readers develop business/growth strategies, assess the market competitive situation, analyze their position in the current marketplace, and make informed business decisions regarding Magnesite Clinkers.
Market Segmentation

Scope of Magnesite Clinkers - Market Report

Report Metric Details
Report Name Magnesite Clinkers - Market
Forecasted market size in 2030 US$ 10270 million
CAGR 4.4%
Forecasted years 2024 - 2030
Segment by Type:
Segment by Application
  • Electric Furnace/Converter Furnace
  • Power Industry
  • Steel
  • Cement
  • Glass
  • Others
By Region
  • North America (United States, Canada)
  • Europe (Germany, France, UK, Italy, Russia) Rest of Europe
  • Nordic Countries
  • Asia-Pacific (China, Japan, South Korea)
  • Southeast Asia (India, Australia)
  • Rest of Asia
  • Latin America (Mexico, Brazil)
  • Rest of Latin America
  • Middle East & Africa (Turkey, Saudi Arabia, UAE, Rest of MEA)
By Company RHI Magnesita, Refratechnik, Beijing LIRR, Possehl Erzkontor, UBE Material, COFERMIN Group, Magnezit Group, Haicheng Huayu, Haicheng Guoming, Haicheng Kuanxiang, Haicheng Houying Kejin, Dalian Joway Minerals, Haicheng Tengfa, Liaoning Jinding, Liaoning Donghe New Material, Yingkou Qinghua Group, Qinghai Western Magnesium, Haicheng Haiming Mining, HCAG, Haicheng Zhonghao, SMZ Jelsava, Haicheng Magnesite Group
Forecast units USD million in value
Report coverage Revenue and volume forecast, company share, competitive landscape, growth factors and trends

Chapter Outline

  • Chapter 1: Introduces the report scope of the report, global total market size (valve, volume and price). This chapter also provides the market dynamics, latest developments of the market, the driving factors and restrictive factors of the market, the challenges and risks faced by manufacturers in the industry, and the analysis of relevant policies in the industry.
  • Chapter 2: Detailed analysis of Magnesite Clinkers manufacturers competitive landscape, price, sales and revenue market share, latest development plan, merger, and acquisition information, etc.
  • Chapter 3: Provides the analysis of various market segments by Type, covering the market size and development potential of each market segment, to help readers find the blue ocean market in different market segments.
  • Chapter 4: Provides the analysis of various market segments by Application, covering the market size and development potential of each market segment, to help readers find the blue ocean market in different downstream markets.
  • Chapter 5: Sales, revenue of Magnesite Clinkers in regional level. It provides a quantitative analysis of the market size and development potential of each region and introduces the market development, future development prospects, market space, and market size of each country in the world.
  • Chapter 6: Sales, revenue of Magnesite Clinkers in country level. It provides sigmate data by Type, and by Application for each country/region.
  • Chapter 7: Provides profiles of key players, introducing the basic situation of the main companies in the market in detail, including product sales, revenue, price, gross margin, product introduction, recent development, etc.
  • Chapter 8: Analysis of industrial chain, including the upstream and downstream of the industry.
  • Chapter 9: Conclusion.

FAQ for this report

What is the Magnesite Clinkers - Market size in 2030?

Ans: The Magnesite Clinkers - Market size in 2030 will be US$ 10270 million.

What is the market share of major companies in Magnesite Clinkers - Market?

Ans: The global magnesia head market is mainly occupied by European and Chinese companies, and the market share of the top five companies in the world exceeds 30%.

Who are the main players in the Magnesite Clinkers - Market report?

Ans: The main players in the Magnesite Clinkers - Market are RHI Magnesita, Refratechnik, Beijing LIRR, Possehl Erzkontor, UBE Material, COFERMIN Group, Magnezit Group, Haicheng Huayu, Haicheng Guoming, Haicheng Kuanxiang, Haicheng Houying Kejin, Dalian Joway Minerals, Haicheng Tengfa, Liaoning Jinding, Liaoning Donghe New Material, Yingkou Qinghua Group, Qinghai Western Magnesium, Haicheng Haiming Mining, HCAG, Haicheng Zhonghao, SMZ Jelsava, Haicheng Magnesite Group

What are the Application segmentation covered in the Magnesite Clinkers - Market report?

Ans: The Applications covered in the Magnesite Clinkers - Market report are Electric Furnace/Converter Furnace, Power Industry, Steel, Cement, Glass, Others

What are the Type segmentation covered in the Magnesite Clinkers - Market report?

Ans: The Types covered in the Magnesite Clinkers - Market report are Light Burned, Dead Burned, Fused, High Purity

Recommended Reports

Magnesia & Derivatives

Refractory Bricks

Magnesite Products

1 Market Overview
1.1 Magnesite Clinkers Product Introduction
1.2 Global Magnesite Clinkers Market Size Forecast
1.2.1 Global Magnesite Clinkers Sales Value (2019-2030)
1.2.2 Global Magnesite Clinkers Sales Volume (2019-2030)
1.2.3 Global Magnesite Clinkers Sales Price (2019-2030)
1.3 Magnesite Clinkers Market Trends & Drivers
1.3.1 Magnesite Clinkers Industry Trends
1.3.2 Magnesite Clinkers Market Drivers & Opportunity
1.3.3 Magnesite Clinkers Market Challenges
1.3.4 Magnesite Clinkers Market Restraints
1.4 Assumptions and Limitations
1.5 Study Objectives
1.6 Years Considered
2 Competitive Analysis by Company
2.1 Global Magnesite Clinkers Players Revenue Ranking (2023)
2.2 Global Magnesite Clinkers Revenue by Company (2019-2024)
2.3 Global Magnesite Clinkers Players Sales Volume Ranking (2023)
2.4 Global Magnesite Clinkers Sales Volume by Company Players (2019-2024)
2.5 Global Magnesite Clinkers Average Price by Company (2019-2024)
2.6 Key Manufacturers Magnesite Clinkers Manufacturing Base Distribution and Headquarters
2.7 Key Manufacturers Magnesite Clinkers Product Offered
2.8 Key Manufacturers Time to Begin Mass Production of Magnesite Clinkers
2.9 Magnesite Clinkers Market Competitive Analysis
2.9.1 Magnesite Clinkers Market Concentration Rate (2019-2024)
2.9.2 Global 5 and 10 Largest Manufacturers by Magnesite Clinkers Revenue in 2023
2.9.3 Global Top Manufacturers by Company Type (Tier 1, Tier 2, and Tier 3) & (based on the Revenue in Magnesite Clinkers as of 2023)
2.10 Mergers & Acquisitions, Expansion
3 Segmentation by Type
3.1 Introduction by Type
3.1.1 Light Burned
3.1.2 Dead Burned
3.1.3 Fused
3.1.4 High Purity
3.2 Global Magnesite Clinkers Sales Value by Type
3.2.1 Global Magnesite Clinkers Sales Value by Type (2019 VS 2023 VS 2030)
3.2.2 Global Magnesite Clinkers Sales Value, by Type (2019-2030)
3.2.3 Global Magnesite Clinkers Sales Value, by Type (%) (2019-2030)
3.3 Global Magnesite Clinkers Sales Volume by Type
3.3.1 Global Magnesite Clinkers Sales Volume by Type (2019 VS 2023 VS 2030)
3.3.2 Global Magnesite Clinkers Sales Volume, by Type (2019-2030)
3.3.3 Global Magnesite Clinkers Sales Volume, by Type (%) (2019-2030)
3.4 Global Magnesite Clinkers Average Price by Type (2019-2030)
4 Segmentation by Application
4.1 Introduction by Application
4.1.1 Electric Furnace/Converter Furnace
4.1.2 Power Industry
4.1.3 Steel
4.1.4 Cement
4.1.5 Glass
4.1.6 Others
4.2 Global Magnesite Clinkers Sales Value by Application
4.2.1 Global Magnesite Clinkers Sales Value by Application (2019 VS 2023 VS 2030)
4.2.2 Global Magnesite Clinkers Sales Value, by Application (2019-2030)
4.2.3 Global Magnesite Clinkers Sales Value, by Application (%) (2019-2030)
4.3 Global Magnesite Clinkers Sales Volume by Application
4.3.1 Global Magnesite Clinkers Sales Volume by Application (2019 VS 2023 VS 2030)
4.3.2 Global Magnesite Clinkers Sales Volume, by Application (2019-2030)
4.3.3 Global Magnesite Clinkers Sales Volume, by Application (%) (2019-2030)
4.4 Global Magnesite Clinkers Average Price by Application (2019-2030)
5 Segmentation by Region
5.1 Global Magnesite Clinkers Sales Value by Region
5.1.1 Global Magnesite Clinkers Sales Value by Region: 2019 VS 2023 VS 2030
5.1.2 Global Magnesite Clinkers Sales Value by Region (2019-2024)
5.1.3 Global Magnesite Clinkers Sales Value by Region (2025-2030)
5.1.4 Global Magnesite Clinkers Sales Value by Region (%), (2019-2030)
5.2 Global Magnesite Clinkers Sales Volume by Region
5.2.1 Global Magnesite Clinkers Sales Volume by Region: 2019 VS 2023 VS 2030
5.2.2 Global Magnesite Clinkers Sales Volume by Region (2019-2024)
5.2.3 Global Magnesite Clinkers Sales Volume by Region (2025-2030)
5.2.4 Global Magnesite Clinkers Sales Volume by Region (%), (2019-2030)
5.3 Global Magnesite Clinkers Average Price by Region (2019-2030)
5.4 North America
5.4.1 North America Magnesite Clinkers Sales Value, 2019-2030
5.4.2 North America Magnesite Clinkers Sales Value by Country (%), 2023 VS 2030
5.5 Europe
5.5.1 Europe Magnesite Clinkers Sales Value, 2019-2030
5.5.2 Europe Magnesite Clinkers Sales Value by Country (%), 2023 VS 2030
5.6 Asia Pacific
5.6.1 Asia Pacific Magnesite Clinkers Sales Value, 2019-2030
5.6.2 Asia Pacific Magnesite Clinkers Sales Value by Country (%), 2023 VS 2030
5.7 South America
5.7.1 South America Magnesite Clinkers Sales Value, 2019-2030
5.7.2 South America Magnesite Clinkers Sales Value by Country (%), 2023 VS 2030
5.8 Middle East & Africa
5.8.1 Middle East & Africa Magnesite Clinkers Sales Value, 2019-2030
5.8.2 Middle East & Africa Magnesite Clinkers Sales Value by Country (%), 2023 VS 2030
6 Segmentation by Key Countries/Regions
6.1 Key Countries/Regions Magnesite Clinkers Sales Value Growth Trends, 2019 VS 2023 VS 2030
6.2 Key Countries/Regions Magnesite Clinkers Sales Value
6.2.1 Key Countries/Regions Magnesite Clinkers Sales Value, 2019-2030
6.2.2 Key Countries/Regions Magnesite Clinkers Sales Volume, 2019-2030
6.3 United States
6.3.1 United States Magnesite Clinkers Sales Value, 2019-2030
6.3.2 United States Magnesite Clinkers Sales Value by Type (%), 2023 VS 2030
6.3.3 United States Magnesite Clinkers Sales Value by Application, 2023 VS 2030
6.4 Europe
6.4.1 Europe Magnesite Clinkers Sales Value, 2019-2030
6.4.2 Europe Magnesite Clinkers Sales Value by Type (%), 2023 VS 2030
6.4.3 Europe Magnesite Clinkers Sales Value by Application, 2023 VS 2030
6.5 China
6.5.1 China Magnesite Clinkers Sales Value, 2019-2030
6.5.2 China Magnesite Clinkers Sales Value by Type (%), 2023 VS 2030
6.5.3 China Magnesite Clinkers Sales Value by Application, 2023 VS 2030
6.6 Japan
6.6.1 Japan Magnesite Clinkers Sales Value, 2019-2030
6.6.2 Japan Magnesite Clinkers Sales Value by Type (%), 2023 VS 2030
6.6.3 Japan Magnesite Clinkers Sales Value by Application, 2023 VS 2030
6.7 South Korea
6.7.1 South Korea Magnesite Clinkers Sales Value, 2019-2030
6.7.2 South Korea Magnesite Clinkers Sales Value by Type (%), 2023 VS 2030
6.7.3 South Korea Magnesite Clinkers Sales Value by Application, 2023 VS 2030
6.8 Southeast Asia
6.8.1 Southeast Asia Magnesite Clinkers Sales Value, 2019-2030
6.8.2 Southeast Asia Magnesite Clinkers Sales Value by Type (%), 2023 VS 2030
6.8.3 Southeast Asia Magnesite Clinkers Sales Value by Application, 2023 VS 2030
6.9 India
6.9.1 India Magnesite Clinkers Sales Value, 2019-2030
6.9.2 India Magnesite Clinkers Sales Value by Type (%), 2023 VS 2030
6.9.3 India Magnesite Clinkers Sales Value by Application, 2023 VS 2030
7 Company Profiles
7.1 RHI Magnesita
7.1.1 RHI Magnesita Company Information
7.1.2 RHI Magnesita Introduction and Business Overview
7.1.3 RHI Magnesita Magnesite Clinkers Sales, Revenue and Gross Margin (2019-2024)
7.1.4 RHI Magnesita Magnesite Clinkers Product Offerings
7.1.5 RHI Magnesita Recent Development
7.2 Refratechnik
7.2.1 Refratechnik Company Information
7.2.2 Refratechnik Introduction and Business Overview
7.2.3 Refratechnik Magnesite Clinkers Sales, Revenue and Gross Margin (2019-2024)
7.2.4 Refratechnik Magnesite Clinkers Product Offerings
7.2.5 Refratechnik Recent Development
7.3 Beijing LIRR
7.3.1 Beijing LIRR Company Information
7.3.2 Beijing LIRR Introduction and Business Overview
7.3.3 Beijing LIRR Magnesite Clinkers Sales, Revenue and Gross Margin (2019-2024)
7.3.4 Beijing LIRR Magnesite Clinkers Product Offerings
7.3.5 Beijing LIRR Recent Development
7.4 Possehl Erzkontor
7.4.1 Possehl Erzkontor Company Information
7.4.2 Possehl Erzkontor Introduction and Business Overview
7.4.3 Possehl Erzkontor Magnesite Clinkers Sales, Revenue and Gross Margin (2019-2024)
7.4.4 Possehl Erzkontor Magnesite Clinkers Product Offerings
7.4.5 Possehl Erzkontor Recent Development
7.5 UBE Material
7.5.1 UBE Material Company Information
7.5.2 UBE Material Introduction and Business Overview
7.5.3 UBE Material Magnesite Clinkers Sales, Revenue and Gross Margin (2019-2024)
7.5.4 UBE Material Magnesite Clinkers Product Offerings
7.5.5 UBE Material Recent Development
7.6 COFERMIN Group
7.6.1 COFERMIN Group Company Information
7.6.2 COFERMIN Group Introduction and Business Overview
7.6.3 COFERMIN Group Magnesite Clinkers Sales, Revenue and Gross Margin (2019-2024)
7.6.4 COFERMIN Group Magnesite Clinkers Product Offerings
7.6.5 COFERMIN Group Recent Development
7.7 Magnezit Group
7.7.1 Magnezit Group Company Information
7.7.2 Magnezit Group Introduction and Business Overview
7.7.3 Magnezit Group Magnesite Clinkers Sales, Revenue and Gross Margin (2019-2024)
7.7.4 Magnezit Group Magnesite Clinkers Product Offerings
7.7.5 Magnezit Group Recent Development
7.8 Haicheng Huayu
7.8.1 Haicheng Huayu Company Information
7.8.2 Haicheng Huayu Introduction and Business Overview
7.8.3 Haicheng Huayu Magnesite Clinkers Sales, Revenue and Gross Margin (2019-2024)
7.8.4 Haicheng Huayu Magnesite Clinkers Product Offerings
7.8.5 Haicheng Huayu Recent Development
7.9 Haicheng Guoming
7.9.1 Haicheng Guoming Company Information
7.9.2 Haicheng Guoming Introduction and Business Overview
7.9.3 Haicheng Guoming Magnesite Clinkers Sales, Revenue and Gross Margin (2019-2024)
7.9.4 Haicheng Guoming Magnesite Clinkers Product Offerings
7.9.5 Haicheng Guoming Recent Development
7.10 Haicheng Kuanxiang
7.10.1 Haicheng Kuanxiang Company Information
7.10.2 Haicheng Kuanxiang Introduction and Business Overview
7.10.3 Haicheng Kuanxiang Magnesite Clinkers Sales, Revenue and Gross Margin (2019-2024)
7.10.4 Haicheng Kuanxiang Magnesite Clinkers Product Offerings
7.10.5 Haicheng Kuanxiang Recent Development
7.11 Haicheng Houying Kejin
7.11.1 Haicheng Houying Kejin Company Information
7.11.2 Haicheng Houying Kejin Introduction and Business Overview
7.11.3 Haicheng Houying Kejin Magnesite Clinkers Sales, Revenue and Gross Margin (2019-2024)
7.11.4 Haicheng Houying Kejin Magnesite Clinkers Product Offerings
7.11.5 Haicheng Houying Kejin Recent Development
7.12 Dalian Joway Minerals
7.12.1 Dalian Joway Minerals Company Information
7.12.2 Dalian Joway Minerals Introduction and Business Overview
7.12.3 Dalian Joway Minerals Magnesite Clinkers Sales, Revenue and Gross Margin (2019-2024)
7.12.4 Dalian Joway Minerals Magnesite Clinkers Product Offerings
7.12.5 Dalian Joway Minerals Recent Development
7.13 Haicheng Tengfa
7.13.1 Haicheng Tengfa Company Information
7.13.2 Haicheng Tengfa Introduction and Business Overview
7.13.3 Haicheng Tengfa Magnesite Clinkers Sales, Revenue and Gross Margin (2019-2024)
7.13.4 Haicheng Tengfa Magnesite Clinkers Product Offerings
7.13.5 Haicheng Tengfa Recent Development
7.14 Liaoning Jinding
7.14.1 Liaoning Jinding Company Information
7.14.2 Liaoning Jinding Introduction and Business Overview
7.14.3 Liaoning Jinding Magnesite Clinkers Sales, Revenue and Gross Margin (2019-2024)
7.14.4 Liaoning Jinding Magnesite Clinkers Product Offerings
7.14.5 Liaoning Jinding Recent Development
7.15 Liaoning Donghe New Material
7.15.1 Liaoning Donghe New Material Company Information
7.15.2 Liaoning Donghe New Material Introduction and Business Overview
7.15.3 Liaoning Donghe New Material Magnesite Clinkers Sales, Revenue and Gross Margin (2019-2024)
7.15.4 Liaoning Donghe New Material Magnesite Clinkers Product Offerings
7.15.5 Liaoning Donghe New Material Recent Development
7.16 Yingkou Qinghua Group
7.16.1 Yingkou Qinghua Group Company Information
7.16.2 Yingkou Qinghua Group Introduction and Business Overview
7.16.3 Yingkou Qinghua Group Magnesite Clinkers Sales, Revenue and Gross Margin (2019-2024)
7.16.4 Yingkou Qinghua Group Magnesite Clinkers Product Offerings
7.16.5 Yingkou Qinghua Group Recent Development
7.17 Qinghai Western Magnesium
7.17.1 Qinghai Western Magnesium Company Information
7.17.2 Qinghai Western Magnesium Introduction and Business Overview
7.17.3 Qinghai Western Magnesium Magnesite Clinkers Sales, Revenue and Gross Margin (2019-2024)
7.17.4 Qinghai Western Magnesium Magnesite Clinkers Product Offerings
7.17.5 Qinghai Western Magnesium Recent Development
7.18 Haicheng Haiming Mining
7.18.1 Haicheng Haiming Mining Company Information
7.18.2 Haicheng Haiming Mining Introduction and Business Overview
7.18.3 Haicheng Haiming Mining Magnesite Clinkers Sales, Revenue and Gross Margin (2019-2024)
7.18.4 Haicheng Haiming Mining Magnesite Clinkers Product Offerings
7.18.5 Haicheng Haiming Mining Recent Development
7.19 HCAG
7.19.1 HCAG Company Information
7.19.2 HCAG Introduction and Business Overview
7.19.3 HCAG Magnesite Clinkers Sales, Revenue and Gross Margin (2019-2024)
7.19.4 HCAG Magnesite Clinkers Product Offerings
7.19.5 HCAG Recent Development
7.20 Haicheng Zhonghao
7.20.1 Haicheng Zhonghao Company Information
7.20.2 Haicheng Zhonghao Introduction and Business Overview
7.20.3 Haicheng Zhonghao Magnesite Clinkers Sales, Revenue and Gross Margin (2019-2024)
7.20.4 Haicheng Zhonghao Magnesite Clinkers Product Offerings
7.20.5 Haicheng Zhonghao Recent Development
7.21 SMZ Jelsava
7.21.1 SMZ Jelsava Company Information
7.21.2 SMZ Jelsava Introduction and Business Overview
7.21.3 SMZ Jelsava Magnesite Clinkers Sales, Revenue and Gross Margin (2019-2024)
7.21.4 SMZ Jelsava Magnesite Clinkers Product Offerings
7.21.5 SMZ Jelsava Recent Development
7.22 Haicheng Magnesite Group
7.22.1 Haicheng Magnesite Group Company Information
7.22.2 Haicheng Magnesite Group Introduction and Business Overview
7.22.3 Haicheng Magnesite Group Magnesite Clinkers Sales, Revenue and Gross Margin (2019-2024)
7.22.4 Haicheng Magnesite Group Magnesite Clinkers Product Offerings
7.22.5 Haicheng Magnesite Group Recent Development
8 Industry Chain Analysis
8.1 Magnesite Clinkers Industrial Chain
8.2 Magnesite Clinkers Upstream Analysis
8.2.1 Key Raw Materials
8.2.2 Raw Materials Key Suppliers
8.2.3 Manufacturing Cost Structure
8.3 Midstream Analysis
8.4 Downstream Analysis (Customers Analysis)
8.5 Sales Model and Sales Channels
8.5.1 Magnesite Clinkers Sales Model
8.5.2 Sales Channel
8.5.3 Magnesite Clinkers Distributors
9 Research Findings and Conclusion
10 Appendix
10.1 Research Methodology
10.1.1 Methodology/Research Approach
10.1.2 Data Source
10.2 Author Details
10.3 Disclaimer
List of Tables
    Table 1. Magnesite Clinkers Market Trends
    Table 2. Magnesite Clinkers Market Drivers & Opportunity
    Table 3. Magnesite Clinkers Market Challenges
    Table 4. Magnesite Clinkers Market Restraints
    Table 5. Global Magnesite Clinkers Revenue by Company (2019-2024) & (US$ Million)
    Table 6. Global Magnesite Clinkers Revenue Market Share by Company (2019-2024)
    Table 7. Global Magnesite Clinkers Sales Volume by Company (2019-2024) & (Kiloton)
    Table 8. Global Magnesite Clinkers Sales Volume Market Share by Company (2019-2024)
    Table 9. Global Market Magnesite Clinkers Price by Company (2019-2024) & (US$/Ton)
    Table 10. Key Manufacturers Magnesite Clinkers Manufacturing Base Distribution and Headquarters
    Table 11. Key Manufacturers Magnesite Clinkers Product Type
    Table 12. Key Manufacturers Time to Begin Mass Production of Magnesite Clinkers
    Table 13. Global Magnesite Clinkers Manufacturers Market Concentration Ratio (CR5 and HHI)
    Table 14. Global Top Manufacturers Market Share by Company Type (Tier 1, Tier 2, and Tier 3) & (based on the Revenue in Magnesite Clinkers as of 2023)
    Table 15. Mergers & Acquisitions, Expansion Plans
    Table 16. Global Magnesite Clinkers Sales Value by Type: 2019 VS 2023 VS 2030 (US$ Million)
    Table 17. Global Magnesite Clinkers Sales Value by Type (2019-2024) & (US$ Million)
    Table 18. Global Magnesite Clinkers Sales Value by Type (2025-2030) & (US$ Million)
    Table 19. Global Magnesite Clinkers Sales Market Share in Value by Type (2019-2024) & (%)
    Table 20. Global Magnesite Clinkers Sales Market Share in Value by Type (2025-2030) & (%)
    Table 21. Global Magnesite Clinkers Sales Volume by Type: 2019 VS 2023 VS 2030 (Kiloton)
    Table 22. Global Magnesite Clinkers Sales Volume by Type (2019-2024) & (Kiloton)
    Table 23. Global Magnesite Clinkers Sales Volume by Type (2025-2030) & (Kiloton)
    Table 24. Global Magnesite Clinkers Sales Market Share in Volume by Type (2019-2024) & (%)
    Table 25. Global Magnesite Clinkers Sales Market Share in Volume by Type (2025-2030) & (%)
    Table 26. Global Magnesite Clinkers Price by Type (2019-2024) & (US$/Ton)
    Table 27. Global Magnesite Clinkers Price by Type (2025-2030) & (US$/Ton)
    Table 28. Global Magnesite Clinkers Sales Value by Application: 2019 VS 2023 VS 2030 (US$ Million)
    Table 29. Global Magnesite Clinkers Sales Value by Application (2019-2024) & (US$ Million)
    Table 30. Global Magnesite Clinkers Sales Value by Application (2025-2030) & (US$ Million)
    Table 31. Global Magnesite Clinkers Sales Market Share in Value by Application (2019-2024) & (%)
    Table 32. Global Magnesite Clinkers Sales Market Share in Value by Application (2025-2030) & (%)
    Table 33. Global Magnesite Clinkers Sales Volume by Application: 2019 VS 2023 VS 2030 (Kiloton)
    Table 34. Global Magnesite Clinkers Sales Volume by Application (2019-2024) & (Kiloton)
    Table 35. Global Magnesite Clinkers Sales Volume by Application (2025-2030) & (Kiloton)
    Table 36. Global Magnesite Clinkers Sales Market Share in Volume by Application (2019-2024) & (%)
    Table 37. Global Magnesite Clinkers Sales Market Share in Volume by Application (2025-2030) & (%)
    Table 38. Global Magnesite Clinkers Price by Application (2019-2024) & (US$/Ton)
    Table 39. Global Magnesite Clinkers Price by Application (2025-2030) & (US$/Ton)
    Table 40. Global Magnesite Clinkers Sales Value by Region: 2019 VS 2023 VS 2030 (US$ Million)
    Table 41. Global Magnesite Clinkers Sales Value by Region (2019-2024) & (US$ Million)
    Table 42. Global Magnesite Clinkers Sales Value by Region (2025-2030) & (US$ Million)
    Table 43. Global Magnesite Clinkers Sales Value by Region (2019-2024) & (%)
    Table 44. Global Magnesite Clinkers Sales Value by Region (2025-2030) & (%)
    Table 45. Global Magnesite Clinkers Sales Volume by Region (Kiloton): 2019 VS 2023 VS 2030
    Table 46. Global Magnesite Clinkers Sales Volume by Region (2019-2024) & (Kiloton)
    Table 47. Global Magnesite Clinkers Sales Volume by Region (2025-2030) & (Kiloton)
    Table 48. Global Magnesite Clinkers Sales Volume by Region (2019-2024) & (%)
    Table 49. Global Magnesite Clinkers Sales Volume by Region (2025-2030) & (%)
    Table 50. Global Magnesite Clinkers Average Price by Region (2019-2024) & (US$/Ton)
    Table 51. Global Magnesite Clinkers Average Price by Region (2025-2030) & (US$/Ton)
    Table 52. Key Countries/Regions Magnesite Clinkers Sales Value Growth Trends, (US$ Million): 2019 VS 2023 VS 2030
    Table 53. Key Countries/Regions Magnesite Clinkers Sales Value, (2019-2024) & (US$ Million)
    Table 54. Key Countries/Regions Magnesite Clinkers Sales Value, (2025-2030) & (US$ Million)
    Table 55. Key Countries/Regions Magnesite Clinkers Sales Volume, (2019-2024) & (Kiloton)
    Table 56. Key Countries/Regions Magnesite Clinkers Sales Volume, (2025-2030) & (Kiloton)
    Table 57. RHI Magnesita Company Information
    Table 58. RHI Magnesita Introduction and Business Overview
    Table 59. RHI Magnesita Magnesite Clinkers Sales (Kiloton), Revenue (US$ Million), Price (US$/Ton) and Gross Margin (2019-2024)
    Table 60. RHI Magnesita Magnesite Clinkers Product Offerings
    Table 61. RHI Magnesita Recent Development
    Table 62. Refratechnik Company Information
    Table 63. Refratechnik Introduction and Business Overview
    Table 64. Refratechnik Magnesite Clinkers Sales (Kiloton), Revenue (US$ Million), Price (US$/Ton) and Gross Margin (2019-2024)
    Table 65. Refratechnik Magnesite Clinkers Product Offerings
    Table 66. Refratechnik Recent Development
    Table 67. Beijing LIRR Company Information
    Table 68. Beijing LIRR Introduction and Business Overview
    Table 69. Beijing LIRR Magnesite Clinkers Sales (Kiloton), Revenue (US$ Million), Price (US$/Ton) and Gross Margin (2019-2024)
    Table 70. Beijing LIRR Magnesite Clinkers Product Offerings
    Table 71. Beijing LIRR Recent Development
    Table 72. Possehl Erzkontor Company Information
    Table 73. Possehl Erzkontor Introduction and Business Overview
    Table 74. Possehl Erzkontor Magnesite Clinkers Sales (Kiloton), Revenue (US$ Million), Price (US$/Ton) and Gross Margin (2019-2024)
    Table 75. Possehl Erzkontor Magnesite Clinkers Product Offerings
    Table 76. Possehl Erzkontor Recent Development
    Table 77. UBE Material Company Information
    Table 78. UBE Material Introduction and Business Overview
    Table 79. UBE Material Magnesite Clinkers Sales (Kiloton), Revenue (US$ Million), Price (US$/Ton) and Gross Margin (2019-2024)
    Table 80. UBE Material Magnesite Clinkers Product Offerings
    Table 81. UBE Material Recent Development
    Table 82. COFERMIN Group Company Information
    Table 83. COFERMIN Group Introduction and Business Overview
    Table 84. COFERMIN Group Magnesite Clinkers Sales (Kiloton), Revenue (US$ Million), Price (US$/Ton) and Gross Margin (2019-2024)
    Table 85. COFERMIN Group Magnesite Clinkers Product Offerings
    Table 86. COFERMIN Group Recent Development
    Table 87. Magnezit Group Company Information
    Table 88. Magnezit Group Introduction and Business Overview
    Table 89. Magnezit Group Magnesite Clinkers Sales (Kiloton), Revenue (US$ Million), Price (US$/Ton) and Gross Margin (2019-2024)
    Table 90. Magnezit Group Magnesite Clinkers Product Offerings
    Table 91. Magnezit Group Recent Development
    Table 92. Haicheng Huayu Company Information
    Table 93. Haicheng Huayu Introduction and Business Overview
    Table 94. Haicheng Huayu Magnesite Clinkers Sales (Kiloton), Revenue (US$ Million), Price (US$/Ton) and Gross Margin (2019-2024)
    Table 95. Haicheng Huayu Magnesite Clinkers Product Offerings
    Table 96. Haicheng Huayu Recent Development
    Table 97. Haicheng Guoming Company Information
    Table 98. Haicheng Guoming Introduction and Business Overview
    Table 99. Haicheng Guoming Magnesite Clinkers Sales (Kiloton), Revenue (US$ Million), Price (US$/Ton) and Gross Margin (2019-2024)
    Table 100. Haicheng Guoming Magnesite Clinkers Product Offerings
    Table 101. Haicheng Guoming Recent Development
    Table 102. Haicheng Kuanxiang Company Information
    Table 103. Haicheng Kuanxiang Introduction and Business Overview
    Table 104. Haicheng Kuanxiang Magnesite Clinkers Sales (Kiloton), Revenue (US$ Million), Price (US$/Ton) and Gross Margin (2019-2024)
    Table 105. Haicheng Kuanxiang Magnesite Clinkers Product Offerings
    Table 106. Haicheng Kuanxiang Recent Development
    Table 107. Haicheng Houying Kejin Company Information
    Table 108. Haicheng Houying Kejin Introduction and Business Overview
    Table 109. Haicheng Houying Kejin Magnesite Clinkers Sales (Kiloton), Revenue (US$ Million), Price (US$/Ton) and Gross Margin (2019-2024)
    Table 110. Haicheng Houying Kejin Magnesite Clinkers Product Offerings
    Table 111. Haicheng Houying Kejin Recent Development
    Table 112. Dalian Joway Minerals Company Information
    Table 113. Dalian Joway Minerals Introduction and Business Overview
    Table 114. Dalian Joway Minerals Magnesite Clinkers Sales (Kiloton), Revenue (US$ Million), Price (US$/Ton) and Gross Margin (2019-2024)
    Table 115. Dalian Joway Minerals Magnesite Clinkers Product Offerings
    Table 116. Dalian Joway Minerals Recent Development
    Table 117. Haicheng Tengfa Company Information
    Table 118. Haicheng Tengfa Introduction and Business Overview
    Table 119. Haicheng Tengfa Magnesite Clinkers Sales (Kiloton), Revenue (US$ Million), Price (US$/Ton) and Gross Margin (2019-2024)
    Table 120. Haicheng Tengfa Magnesite Clinkers Product Offerings
    Table 121. Haicheng Tengfa Recent Development
    Table 122. Liaoning Jinding Company Information
    Table 123. Liaoning Jinding Introduction and Business Overview
    Table 124. Liaoning Jinding Magnesite Clinkers Sales (Kiloton), Revenue (US$ Million), Price (US$/Ton) and Gross Margin (2019-2024)
    Table 125. Liaoning Jinding Magnesite Clinkers Product Offerings
    Table 126. Liaoning Jinding Recent Development
    Table 127. Liaoning Donghe New Material Company Information
    Table 128. Liaoning Donghe New Material Introduction and Business Overview
    Table 129. Liaoning Donghe New Material Magnesite Clinkers Sales (Kiloton), Revenue (US$ Million), Price (US$/Ton) and Gross Margin (2019-2024)
    Table 130. Liaoning Donghe New Material Magnesite Clinkers Product Offerings
    Table 131. Liaoning Donghe New Material Recent Development
    Table 132. Yingkou Qinghua Group Company Information
    Table 133. Yingkou Qinghua Group Introduction and Business Overview
    Table 134. Yingkou Qinghua Group Magnesite Clinkers Sales (Kiloton), Revenue (US$ Million), Price (US$/Ton) and Gross Margin (2019-2024)
    Table 135. Yingkou Qinghua Group Magnesite Clinkers Product Offerings
    Table 136. Yingkou Qinghua Group Recent Development
    Table 137. Qinghai Western Magnesium Company Information
    Table 138. Qinghai Western Magnesium Introduction and Business Overview
    Table 139. Qinghai Western Magnesium Magnesite Clinkers Sales (Kiloton), Revenue (US$ Million), Price (US$/Ton) and Gross Margin (2019-2024)
    Table 140. Qinghai Western Magnesium Magnesite Clinkers Product Offerings
    Table 141. Qinghai Western Magnesium Recent Development
    Table 142. Haicheng Haiming Mining Company Information
    Table 143. Haicheng Haiming Mining Introduction and Business Overview
    Table 144. Haicheng Haiming Mining Magnesite Clinkers Sales (Kiloton), Revenue (US$ Million), Price (US$/Ton) and Gross Margin (2019-2024)
    Table 145. Haicheng Haiming Mining Magnesite Clinkers Product Offerings
    Table 146. Haicheng Haiming Mining Recent Development
    Table 147. HCAG Company Information
    Table 148. HCAG Introduction and Business Overview
    Table 149. HCAG Magnesite Clinkers Sales (Kiloton), Revenue (US$ Million), Price (US$/Ton) and Gross Margin (2019-2024)
    Table 150. HCAG Magnesite Clinkers Product Offerings
    Table 151. HCAG Recent Development
    Table 152. Haicheng Zhonghao Company Information
    Table 153. Haicheng Zhonghao Introduction and Business Overview
    Table 154. Haicheng Zhonghao Magnesite Clinkers Sales (Kiloton), Revenue (US$ Million), Price (US$/Ton) and Gross Margin (2019-2024)
    Table 155. Haicheng Zhonghao Magnesite Clinkers Product Offerings
    Table 156. Haicheng Zhonghao Recent Development
    Table 157. SMZ Jelsava Company Information
    Table 158. SMZ Jelsava Introduction and Business Overview
    Table 159. SMZ Jelsava Magnesite Clinkers Sales (Kiloton), Revenue (US$ Million), Price (US$/Ton) and Gross Margin (2019-2024)
    Table 160. SMZ Jelsava Magnesite Clinkers Product Offerings
    Table 161. SMZ Jelsava Recent Development
    Table 162. Haicheng Magnesite Group Company Information
    Table 163. Haicheng Magnesite Group Introduction and Business Overview
    Table 164. Haicheng Magnesite Group Magnesite Clinkers Sales (Kiloton), Revenue (US$ Million), Price (US$/Ton) and Gross Margin (2019-2024)
    Table 165. Haicheng Magnesite Group Magnesite Clinkers Product Offerings
    Table 166. Haicheng Magnesite Group Recent Development
    Table 167. Key Raw Materials Lists
    Table 168. Raw Materials Key Suppliers Lists
    Table 169. Magnesite Clinkers Downstream Customers
    Table 170. Magnesite Clinkers Distributors List
    Table 171. Research Programs/Design for This Report
    Table 172. Key Data Information from Secondary Sources
    Table 173. Key Data Information from Primary Sources
List of Figures
    Figure 1. Magnesite Clinkers Product Picture
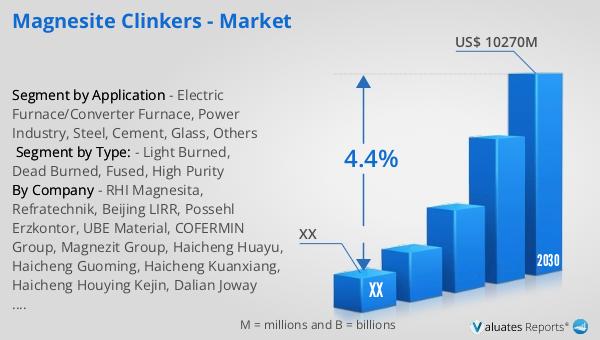
    Figure 2. Global Magnesite Clinkers Sales Value, 2019 VS 2023 VS 2030 (US$ Million)
    Figure 3. Global Magnesite Clinkers Sales Value (2019-2030) & (US$ Million)
    Figure 4. Global Magnesite Clinkers Sales Volume (2019-2030) & (Kiloton)
    Figure 5. Global Magnesite Clinkers Sales Price (2019-2030) & (US$/Ton)
    Figure 6. Magnesite Clinkers Report Years Considered
    Figure 7. Global Magnesite Clinkers Players Revenue Ranking (2023) & (US$ Million)
    Figure 8. Global Magnesite Clinkers Players Sales Volume Ranking (2023) & (Kiloton)
    Figure 9. The 5 and 10 Largest Manufacturers in the World: Market Share by Magnesite Clinkers Revenue in 2023
    Figure 10. Magnesite Clinkers Market Share by Company Type (Tier 1, Tier 2, and Tier 3): 2019 VS 2023
    Figure 11. Light Burned Picture
    Figure 12. Dead Burned Picture
    Figure 13. Fused Picture
    Figure 14. High Purity Picture
    Figure 15. Global Magnesite Clinkers Sales Value by Type (2019 VS 2023 VS 2030) & (US$ Million)
    Figure 16. Global Magnesite Clinkers Sales Value Market Share by Type, 2023 & 2030
    Figure 17. Global Magnesite Clinkers Sales Volume by Type (2019 VS 2023 VS 2030) & (Kiloton)
    Figure 18. Global Magnesite Clinkers Sales Volume Market Share by Type, 2023 & 2030
    Figure 19. Global Magnesite Clinkers Price by Type (2019-2030) & (US$/Ton)
    Figure 20. Product Picture of Electric Furnace/Converter Furnace
    Figure 21. Product Picture of Power Industry
    Figure 22. Product Picture of Steel
    Figure 23. Product Picture of Cement
    Figure 24. Product Picture of Glass
    Figure 25. Product Picture of Others
    Figure 26. Global Magnesite Clinkers Sales Value by Application (2019 VS 2023 VS 2030) & (US$ Million)
    Figure 27. Global Magnesite Clinkers Sales Value Market Share by Application, 2023 & 2030
    Figure 28. Global Magnesite Clinkers Sales Volume by Application (2019 VS 2023 VS 2030) & (Kiloton)
    Figure 29. Global Magnesite Clinkers Sales Volume Market Share by Application, 2023 & 2030
    Figure 30. Global Magnesite Clinkers Price by Application (2019-2030) & (US$/Ton)
    Figure 31. North America Magnesite Clinkers Sales Value (2019-2030) & (US$ Million)
    Figure 32. North America Magnesite Clinkers Sales Value by Country (%), 2023 VS 2030
    Figure 33. Europe Magnesite Clinkers Sales Value (2019-2030) & (US$ Million)
    Figure 34. Europe Magnesite Clinkers Sales Value by Country (%), 2023 VS 2030
    Figure 35. Asia Pacific Magnesite Clinkers Sales Value (2019-2030) & (US$ Million)
    Figure 36. Asia Pacific Magnesite Clinkers Sales Value by Country (%), 2023 VS 2030
    Figure 37. South America Magnesite Clinkers Sales Value (2019-2030) & (US$ Million)
    Figure 38. South America Magnesite Clinkers Sales Value by Country (%), 2023 VS 2030
    Figure 39. Middle East & Africa Magnesite Clinkers Sales Value (2019-2030) & (US$ Million)
    Figure 40. Middle East & Africa Magnesite Clinkers Sales Value by Country (%), 2023 VS 2030
    Figure 41. Key Countries/Regions Magnesite Clinkers Sales Value (%), (2019-2030)
    Figure 42. Key Countries/Regions Magnesite Clinkers Sales Volume (%), (2019-2030)
    Figure 43. United States Magnesite Clinkers Sales Value, (2019-2030) & (US$ Million)
    Figure 44. United States Magnesite Clinkers Sales Value by Type (%), 2023 VS 2030
    Figure 45. United States Magnesite Clinkers Sales Value by Application (%), 2023 VS 2030
    Figure 46. Europe Magnesite Clinkers Sales Value, (2019-2030) & (US$ Million)
    Figure 47. Europe Magnesite Clinkers Sales Value by Type (%), 2023 VS 2030
    Figure 48. Europe Magnesite Clinkers Sales Value by Application (%), 2023 VS 2030
    Figure 49. China Magnesite Clinkers Sales Value, (2019-2030) & (US$ Million)
    Figure 50. China Magnesite Clinkers Sales Value by Type (%), 2023 VS 2030
    Figure 51. China Magnesite Clinkers Sales Value by Application (%), 2023 VS 2030
    Figure 52. Japan Magnesite Clinkers Sales Value, (2019-2030) & (US$ Million)
    Figure 53. Japan Magnesite Clinkers Sales Value by Type (%), 2023 VS 2030
    Figure 54. Japan Magnesite Clinkers Sales Value by Application (%), 2023 VS 2030
    Figure 55. South Korea Magnesite Clinkers Sales Value, (2019-2030) & (US$ Million)
    Figure 56. South Korea Magnesite Clinkers Sales Value by Type (%), 2023 VS 2030
    Figure 57. South Korea Magnesite Clinkers Sales Value by Application (%), 2023 VS 2030
    Figure 58. Southeast Asia Magnesite Clinkers Sales Value, (2019-2030) & (US$ Million)
    Figure 59. Southeast Asia Magnesite Clinkers Sales Value by Type (%), 2023 VS 2030
    Figure 60. Southeast Asia Magnesite Clinkers Sales Value by Application (%), 2023 VS 2030
    Figure 61. India Magnesite Clinkers Sales Value, (2019-2030) & (US$ Million)
    Figure 62. India Magnesite Clinkers Sales Value by Type (%), 2023 VS 2030
    Figure 63. India Magnesite Clinkers Sales Value by Application (%), 2023 VS 2030
    Figure 64. Magnesite Clinkers Industrial Chain
    Figure 65. Magnesite Clinkers Manufacturing Cost Structure
    Figure 66. Channels of Distribution (Direct Sales, and Distribution)
    Figure 67. Bottom-up and Top-down Approaches for This Report
    Figure 68. Data Triangulation
    Figure 69. Key Executives Interviewed
SELECT A FORMAT
Added to Cart
Electronic (PDF)

$3950

This license allows only one user to access the PDF.
Electronic (PDF)

$5925

This license allows 1 - 5 user to access the PDF, license is suitable for small groups of 5 users working together
Electronic (PDF)

$7900

This license allows users/teams in a same Enterprise to use this report, various departments within an enterpise can use this report
Add to Cart
Buy Now (15% Discount)

OUR CUSTOMER

Accenture

RELATED REPORTS

Global Nano Porous Silicon–carbon Anode Material Market Research Report 2025

120 Pages
Type: Report
Code: QYRE-Auto-0F17509
Fri Sep 12 00:00:00 UTC 2025

Add to Cart

Global Foam Board Market Research Report 2025

120 Pages
Type: Report
Code: QYRE-Auto-16F19834
Fri Sep 12 00:00:00 UTC 2025

Add to Cart

Global Copper Wires Market Research Report 2025

120 Pages
Type: Report
Code: QYRE-Auto-5U6954
Fri Sep 12 00:00:00 UTC 2025

Add to Cart

Global Quartz Fiber Cloth Market Research Report 2025

120 Pages
Type: Report
Code: QYRE-Auto-20G17359
Fri Sep 12 00:00:00 UTC 2025

Add to Cart