List of Tables
Table 1. Global Life Science Cloud Market Size Growth Rate by Type (US$ Million): 2021 vs 2025 vs 2032
Table 2. Key Players of Software-as-a-Service
Table 3. Key Players of Platform-as-a-Service
Table 4. Key Players of Infrastructure-as-a-Service
Table 5. Global Life Science Cloud Market Size Growth Rate by Deployment Mode (US$ Million): 2021 vs 2025 vs 2032
Table 6. Key Players of Public Cloud
Table 7. Key Players of Private Cloud
Table 8. Key Players of Hybrid Cloud
Table 9. Global Life Science Cloud Market Size Growth Rate by Functional Domain and Specialization (US$ Million): 2021 vs 2025 vs 2032
Table 10. Key Players of Research & Discovery Clouds
Table 11. Key Players of Clinical & Diagnostics Clouds
Table 12. Key Players of Lab Operations & Data Management Clouds
Table 13. Key Players of Multi-Omics Data Integration Clouds
Table 14. Global Life Science Cloud Market Size Growth by Application (US$ Million): 2021 vs 2025 vs 2032
Table 15. Global Life Science Cloud Market Size by Region (US$ Million): 2021 vs 2025 vs 2032
Table 16. Global Life Science Cloud Market Size by Region (US$ Million), 2021–2026
Table 17. Global Life Science Cloud Market Share by Region (2021–2026)
Table 18. Global Life Science Cloud Forecasted Market Size by Region (US$ Million), 2027–2032
Table 19. Global Life Science Cloud Market Share by Region (2027–2032)
Table 20. Life Science Cloud Market Trends
Table 21. Life Science Cloud Market Drivers
Table 22. Life Science Cloud Market Challenges
Table 23. Life Science Cloud Market Restraints
Table 24. Global Life Science Cloud Revenue by Players (US$ Million), 2021–2026
Table 25. Global Life Science Cloud Market Share by Players (2021–2026)
Table 26. Global Top Life Science Cloud Players by Tier (Tier 1, Tier 2, and Tier 3), based on Life Science Cloud Revenue, 2025
Table 27. Ranking of Global Top Life Science Cloud Companies by Revenue (US$ Million) in 2025
Table 28. Global 5 Largest Players Market Share by Life Science Cloud Revenue (CR5 and HHI), 2021–2026
Table 29. Global Key Players of Life Science Cloud, Headquarters and Area Served
Table 30. Global Key Players of Life Science Cloud, Products and Applications
Table 31. Global Key Players of Life Science Cloud, Date of General Availability (GA)
Table 32. Mergers and Acquisitions, Expansion Plans
Table 33. Global Life Science Cloud Market Size by Type (US$ Million), 2021–2026
Table 34. Global Life Science Cloud Revenue Market Share by Type (2021–2026)
Table 35. Global Life Science Cloud Forecasted Market Size by Type (US$ Million), 2027–2032
Table 36. Global Life Science Cloud Revenue Market Share by Type (2027–2032)
Table 37. Global Life Science Cloud Market Size by Application (US$ Million), 2021–2026
Table 38. Global Life Science Cloud Revenue Market Share by Application (2021–2026)
Table 39. Global Life Science Cloud Forecasted Market Size by Application (US$ Million), 2027–2032
Table 40. Global Life Science Cloud Revenue Market Share by Application (2027–2032)
Table 41. North America Life Science Cloud Market Size Growth Rate by Country (US$ Million): 2021 vs 2025 vs 2032
Table 42. North America Life Science Cloud Market Size by Country (US$ Million), 2021–2026
Table 43. North America Life Science Cloud Market Size by Country (US$ Million), 2027–2032
Table 44. Europe Life Science Cloud Market Size Growth Rate by Country (US$ Million): 2021 vs 2025 vs 2032
Table 45. Europe Life Science Cloud Market Size by Country (US$ Million), 2021–2026
Table 46. Europe Life Science Cloud Market Size by Country (US$ Million), 2027–2032
Table 47. Asia-Pacific Life Science Cloud Market Size Growth Rate by Region (US$ Million): 2021 vs 2025 vs 2032
Table 48. Asia-Pacific Life Science Cloud Market Size by Region (US$ Million), 2021–2026
Table 49. Asia-Pacific Life Science Cloud Market Size by Region (US$ Million), 2027–2032
Table 50. Latin America Life Science Cloud Market Size Growth Rate by Country (US$ Million): 2021 vs 2025 vs 2032
Table 51. Latin America Life Science Cloud Market Size by Country (US$ Million), 2021–2026
Table 52. Latin America Life Science Cloud Market Size by Country (US$ Million), 2027–2032
Table 53. Middle East & Africa Life Science Cloud Market Size Growth Rate by Country (US$ Million): 2021 vs 2025 vs 2032
Table 54. Middle East & Africa Life Science Cloud Market Size by Country (US$ Million), 2021–2026
Table 55. Middle East & Africa Life Science Cloud Market Size by Country (US$ Million), 2027–2032
Table 56. Salesforce Company Details
Table 57. Salesforce Business Overview
Table 58. Salesforce Life Science Cloud Product
Table 59. Salesforce Revenue in Life Science Cloud Business (US$ Million), 2021–2026
Table 60. Salesforce Recent Development
Table 61. AWS Company Details
Table 62. AWS Business Overview
Table 63. AWS Life Science Cloud Product
Table 64. AWS Revenue in Life Science Cloud Business (US$ Million), 2021–2026
Table 65. AWS Recent Development
Table 66. PWC Company Details
Table 67. PWC Business Overview
Table 68. PWC Life Science Cloud Product
Table 69. PWC Revenue in Life Science Cloud Business (US$ Million), 2021–2026
Table 70. PWC Recent Development
Table 71. Oracle Company Details
Table 72. Oracle Business Overview
Table 73. Oracle Life Science Cloud Product
Table 74. Oracle Revenue in Life Science Cloud Business (US$ Million), 2021–2026
Table 75. Oracle Recent Development
Table 76. Veeva Systems Company Details
Table 77. Veeva Systems Business Overview
Table 78. Veeva Systems Life Science Cloud Product
Table 79. Veeva Systems Revenue in Life Science Cloud Business (US$ Million), 2021–2026
Table 80. Veeva Systems Recent Development
Table 81. Rescale Company Details
Table 82. Rescale Business Overview
Table 83. Rescale Life Science Cloud Product
Table 84. Rescale Revenue in Life Science Cloud Business (US$ Million), 2021–2026
Table 85. Rescale Recent Development
Table 86. Accenture Company Details
Table 87. Accenture Business Overview
Table 88. Accenture Life Science Cloud Product
Table 89. Accenture Revenue in Life Science Cloud Business (US$ Million), 2021–2026
Table 90. Accenture Recent Development
Table 91. TraceLink Company Details
Table 92. TraceLink Business Overview
Table 93. TraceLink Life Science Cloud Product
Table 94. TraceLink Revenue in Life Science Cloud Business (US$ Million), 2021–2026
Table 95. TraceLink Recent Development
Table 96. Snowflake Company Details
Table 97. Snowflake Business Overview
Table 98. Snowflake Life Science Cloud Product
Table 99. Snowflake Revenue in Life Science Cloud Business (US$ Million), 2021–2026
Table 100. Snowflake Recent Development
Table 101. IBM Company Details
Table 102. IBM Business Overview
Table 103. IBM Life Science Cloud Product
Table 104. IBM Revenue in Life Science Cloud Business (US$ Million), 2021–2026
Table 105. IBM Recent Development
Table 106. ACG Company Details
Table 107. ACG Business Overview
Table 108. ACG Life Science Cloud Product
Table 109. ACG Revenue in Life Science Cloud Business (US$ Million), 2021–2026
Table 110. ACG Recent Development
Table 111. dinCloud Company Details
Table 112. dinCloud Business Overview
Table 113. dinCloud Life Science Cloud Product
Table 114. dinCloud Revenue in Life Science Cloud Business (US$ Million), 2021–2026
Table 115. dinCloud Recent Development
Table 116. Capgemini Company Details
Table 117. Capgemini Business Overview
Table 118. Capgemini Life Science Cloud Product
Table 119. Capgemini Revenue in Life Science Cloud Business (US$ Million), 2021–2026
Table 120. Capgemini Recent Development
Table 121. MetaCell Company Details
Table 122. MetaCell Business Overview
Table 123. MetaCell Life Science Cloud Product
Table 124. MetaCell Revenue in Life Science Cloud Business (US$ Million), 2021–2026
Table 125. MetaCell Recent Development
Table 126. Nasuni Company Details
Table 127. Nasuni Business Overview
Table 128. Nasuni Life Science Cloud Product
Table 129. Nasuni Revenue in Life Science Cloud Business (US$ Million), 2021–2026
Table 130. Nasuni Recent Development
Table 131. Benchling Company Details
Table 132. Benchling Business Overview
Table 133. Benchling Life Science Cloud Product
Table 134. Benchling Revenue in Life Science Cloud Business (US$ Million), 2021–2026
Table 135. Benchling Recent Development
Table 136. LabKey Company Details
Table 137. LabKey Business Overview
Table 138. LabKey Life Science Cloud Product
Table 139. LabKey Revenue in Life Science Cloud Business (US$ Million), 2021–2026
Table 140. LabKey Recent Development
Table 141. Sony Company Details
Table 142. Sony Business Overview
Table 143. Sony Life Science Cloud Product
Table 144. Sony Revenue in Life Science Cloud Business (US$ Million), 2021–2026
Table 145. Sony Recent Development
Table 146. OpenText Company Details
Table 147. OpenText Business Overview
Table 148. OpenText Life Science Cloud Product
Table 149. OpenText Revenue in Life Science Cloud Business (US$ Million), 2021–2026
Table 150. OpenText Recent Development
Table 151. SAS Institute Company Details
Table 152. SAS Institute Business Overview
Table 153. SAS Institute Life Science Cloud Product
Table 154. SAS Institute Revenue in Life Science Cloud Business (US$ Million), 2021–2026
Table 155. SAS Institute Recent Development
Table 156. Slalom Company Details
Table 157. Slalom Business Overview
Table 158. Slalom Life Science Cloud Product
Table 159. Slalom Revenue in Life Science Cloud Business (US$ Million), 2021–2026
Table 160. Slalom Recent Development
Table 161. Research Programs/Design for This Report
Table 162. Key Data Information from Secondary Sources
Table 163. Key Data Information from Primary Sources
Table 164. Authors List of This Report
List of Figures
Figure 1. Life Science Cloud Picture
Figure 2. Global Life Science Cloud Market Size Comparison by Type (US$ Million), 2021–2032
Figure 3. Global Life Science Cloud Market Share by Type: 2025 vs 2032
Figure 4. Software-as-a-Service Features
Figure 5. Platform-as-a-Service Features
Figure 6. Infrastructure-as-a-Service Features
Figure 7. Global Life Science Cloud Market Size Comparison by Deployment Mode (US$ Million), 2021–2032
Figure 8. Public Cloud Features
Figure 9. Private Cloud Features
Figure 10. Hybrid Cloud Features
Figure 11. Global Life Science Cloud Market Size Comparison by Functional Domain and Specialization (US$ Million), 2021–2032
Figure 12. Research & Discovery Clouds Features
Figure 13. Clinical & Diagnostics Clouds Features
Figure 14. Lab Operations & Data Management Clouds Features
Figure 15. Multi-Omics Data Integration Clouds Features
Figure 16. Global Life Science Cloud Market Size by Application (US$ Million), 2021–2032
Figure 17. Global Life Science Cloud Market Share by Application: 2025 vs 2032
Figure 18. Healthcare Case Studies
Figure 19. Pharmaceutical Industry Case Studies
Figure 20. Academic Organizations Case Studies
Figure 21. Others Case Studies
Figure 22. Life Science Cloud Report Years Considered
Figure 23. Global Life Science Cloud Market Size (US$ Million), Year-over-Year: 2021–2032
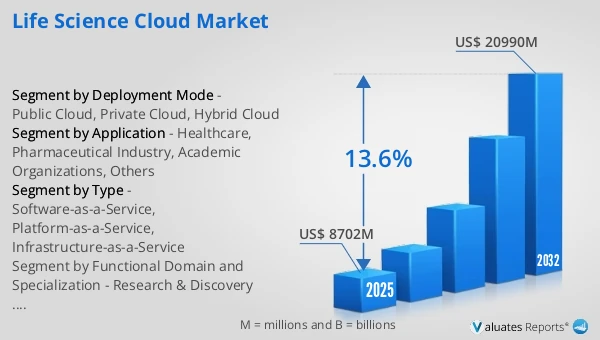
Figure 24. Global Life Science Cloud Market Size, (US$ Million), 2021 vs 2025 vs 2032
Figure 25. Global Life Science Cloud Market Share by Region: 2025 vs 2032
Figure 26. Global Life Science Cloud Market Share by Players in 2025
Figure 27. Global Life Science Cloud Market Share by Company Type (Tier 1, Tier 2, and Tier 3)
Figure 28. The Top 10 and 5 Players Market Share by Life Science Cloud Revenue in 2025
Figure 29. North America Life Science Cloud Market Size YoY Growth (US$ Million), 2021–2032
Figure 30. North America Life Science Cloud Market Share by Country (2021–2032)
Figure 31. United States Life Science Cloud Market Size YoY Growth (US$ Million), 2021–2032
Figure 32. Canada Life Science Cloud Market Size YoY Growth (US$ Million), 2021–2032
Figure 33. Europe Life Science Cloud Market Size YoY Growth (US$ Million), 2021–2032
Figure 34. Europe Life Science Cloud Market Share by Country (2021–2032)
Figure 35. Germany Life Science Cloud Market Size YoY Growth (US$ Million), 2021–2032
Figure 36. France Life Science Cloud Market Size YoY Growth (US$ Million), 2021–2032
Figure 37. U.K. Life Science Cloud Market Size YoY Growth (US$ Million), 2021–2032
Figure 38. Italy Life Science Cloud Market Size YoY Growth (US$ Million), 2021–2032
Figure 39. Russia Life Science Cloud Market Size YoY Growth (US$ Million), 2021–2032
Figure 40. Ireland Life Science Cloud Market Size YoY Growth (US$ Million), 2021–2032
Figure 41. Asia-Pacific Life Science Cloud Market Size YoY Growth (US$ Million), 2021–2032
Figure 42. Asia-Pacific Life Science Cloud Market Share by Region (2021–2032)
Figure 43. China Life Science Cloud Market Size YoY Growth (US$ Million), 2021–2032
Figure 44. Japan Life Science Cloud Market Size YoY Growth (US$ Million), 2021–2032
Figure 45. South Korea Life Science Cloud Market Size YoY Growth (US$ Million), 2021–2032
Figure 46. Southeast Asia Life Science Cloud Market Size YoY Growth (US$ Million), 2021–2032
Figure 47. India Life Science Cloud Market Size YoY Growth (US$ Million), 2021–2032
Figure 48. Australia & New Zealand Life Science Cloud Market Size YoY Growth (US$ Million), 2021–2032
Figure 49. Latin America Life Science Cloud Market Size YoY Growth (US$ Million), 2021–2032
Figure 50. Latin America Life Science Cloud Market Share by Country (2021–2032)
Figure 51. Mexico Life Science Cloud Market Size YoY Growth (US$ Million), 2021–2032
Figure 52. Brazil Life Science Cloud Market Size YoY Growth (US$ Million), 2021–2032
Figure 53. Middle East & Africa Life Science Cloud Market Size YoY Growth (US$ Million), 2021–2032
Figure 54. Middle East & Africa Life Science Cloud Market Share by Country (2021–2032)
Figure 55. Israel Life Science Cloud Market Size YoY Growth (US$ Million), 2021–2032
Figure 56. Saudi Arabia Life Science Cloud Market Size YoY Growth (US$ Million), 2021–2032
Figure 57. UAE Life Science Cloud Market Size YoY Growth (US$ Million), 2021–2032
Figure 58. Salesforce Revenue Growth Rate in Life Science Cloud Business (2021–2026)
Figure 59. AWS Revenue Growth Rate in Life Science Cloud Business (2021–2026)
Figure 60. PWC Revenue Growth Rate in Life Science Cloud Business (2021–2026)
Figure 61. Oracle Revenue Growth Rate in Life Science Cloud Business (2021–2026)
Figure 62. Veeva Systems Revenue Growth Rate in Life Science Cloud Business (2021–2026)
Figure 63. Rescale Revenue Growth Rate in Life Science Cloud Business (2021–2026)
Figure 64. Accenture Revenue Growth Rate in Life Science Cloud Business (2021–2026)
Figure 65. TraceLink Revenue Growth Rate in Life Science Cloud Business (2021–2026)
Figure 66. Snowflake Revenue Growth Rate in Life Science Cloud Business (2021–2026)
Figure 67. IBM Revenue Growth Rate in Life Science Cloud Business (2021–2026)
Figure 68. ACG Revenue Growth Rate in Life Science Cloud Business (2021–2026)
Figure 69. dinCloud Revenue Growth Rate in Life Science Cloud Business (2021–2026)
Figure 70. Capgemini Revenue Growth Rate in Life Science Cloud Business (2021–2026)
Figure 71. MetaCell Revenue Growth Rate in Life Science Cloud Business (2021–2026)
Figure 72. Nasuni Revenue Growth Rate in Life Science Cloud Business (2021–2026)
Figure 73. Benchling Revenue Growth Rate in Life Science Cloud Business (2021–2026)
Figure 74. LabKey Revenue Growth Rate in Life Science Cloud Business (2021–2026)
Figure 75. Sony Revenue Growth Rate in Life Science Cloud Business (2021–2026)
Figure 76. OpenText Revenue Growth Rate in Life Science Cloud Business (2021–2026)
Figure 77. SAS Institute Revenue Growth Rate in Life Science Cloud Business (2021–2026)
Figure 78. Slalom Revenue Growth Rate in Life Science Cloud Business (2021–2026)
Figure 79. Bottom-up and Top-down Approaches for This Report
Figure 80. Data Triangulation
Figure 81. Key Executives Interviewed