0
U.S. (TOLL FREE)
+1 (315) 215-3225
Automative

0
U.S. (TOLL FREE)
+1 (315) 215-3225
Global Aluminum Scrap Market Research Report 2026
Published Date: 2026-05-26
|
Report Code: QYRE-Auto-21K20258
Home | Market Reports | Business & Industrial| Metals & Mining
Global Aluminum Scrap Market Research Report 2026
BUY CHAPTERS

Global Aluminum Scrap Market Research Report 2026

Code: QYRE-Auto-21K20258
Report
2026-05-26
Pages:204
QYResearch
Buy Now with 15% Discount
DESCRIPTION
TABLE OF CONTENT
TABLES & FIGURES

Aluminum Scrap Market Size

The global Aluminum Scrap market was valued at US$ 83520 million in 2025 and is anticipated to reach US$ 98787 million by 2032, at a CAGR of 2.2% from 2026 to 2032.

Aluminum Scrap Market

Aluminum Scrap Market

The Aluminum Scrap Market mainly covers companies engaged in the recovery, sorting, pretreatment, and reuse organization of aluminum scrap resources. These companies obtain aluminum scrap through channels such as social recycling, industrial offcut recycling, end-of-life vehicle dismantling, building demolition, and packaging waste recovery. Through sorting, shredding, baling, briquetting, impurity removal, grading, and pretreatment, aluminum scrap is processed into raw materials that can enter the secondary aluminum production system.
Their business models include selling aluminum scrap or pretreated recycled aluminum raw materials to downstream companies such as secondary aluminum producers, aluminum alloy producers, foundries, die casting companies, rolling companies, and extrusion companies. They also include closed-loop consumption, where companies internally use recovered aluminum scrap to produce recycled aluminum alloys, aluminum billets, aluminum flat rolled products, aluminum profiles, and other products.
The aluminum scrap market mainly covers companies engaged in aluminum scrap recovery, sorting, pretreatment, and reuse organization. Its core processes include social recycling, industrial offcut recovery, end-of-life vehicle dismantling, building demolition, packaging waste recovery, and subsequent basic processing activities such as sorting, shredding, baling, briquetting, impurity removal, grading, and pretreatment.
From a product structure perspective, aluminum scrap can be classified by source into industrial aluminum scrap, end-of-life vehicle aluminum scrap, building demolition aluminum scrap, packaging aluminum scrap, and other post-consumer aluminum scrap. By physical form, it can be divided into lump aluminum scrap, aluminum sheet, strip and foil scrap, aluminum turnings and chips, shredded and mixed aluminum scrap, and composite aluminum scrap. Industrial offcuts usually have stable composition, low impurity levels, and high recycling value, making them an important source of high-quality secondary aluminum raw materials. Post-consumer aluminum scrap is more scattered in source and more complex in composition, requiring stronger sorting, impurity removal, and alloy identification capabilities. Automotive, construction, and packaging aluminum scrap are more influenced by replacement cycles, dismantling systems, recycling policies, and the end-use aluminum consumption structure.
From the perspective of downstream applications, aluminum scrap mainly flows to recycled aluminum alloy producers, casting and die casting companies, rolling companies, extrusion companies, and cross-border secondary raw material markets. Among them, recycled aluminum alloy producers and casting or die casting companies have relatively strong aluminum scrap consumption capacity, mainly using it for cast or die-cast products such as automotive components, machinery parts, and hardware products. Rolling and extrusion companies have higher requirements for aluminum scrap purity, alloy grade consistency, and impurity control, and therefore prefer industrial new scrap, closed-loop used beverage can scrap, and high-quality sorted materials. With the increasing use of low-carbon aluminum, closed-loop recycling, and recycled materials, aluminum scrap is becoming a more strategic raw material within the aluminum value chain.
From the perspective of cost structure and manufacturing operations, the costs of aluminum scrap companies mainly include aluminum scrap procurement costs, manual sorting costs, transportation and warehousing costs, shredding, baling and briquetting costs, equipment depreciation, energy consumption, environmental treatment, and administrative expenses. Among these, aluminum scrap procurement cost accounts for the largest share and usually determines the company’s profit sensitivity. In terms of single-line capacity, small sorting and baling lines usually have an annual processing capacity of 10,000–30,000 tons, medium-sized shredding, sorting and briquetting lines typically have an annual capacity of 30,000–100,000 tons, while large automated lines equipped with shredding, eddy current separation, optical sorting, and pretreatment systems can reach more than 100,000–300,000 tons per year. The overall gross margin of the industry is relatively low. Ordinary recycling and trading companies usually have gross margins of 3%–8%, processing companies with sorting, shredding, briquetting, and impurity removal capabilities generally achieve gross margins of 8%–15%, while companies with stable closed-loop customers, high-quality aluminum scrap grading capabilities, or internal consumption systems can reach gross margins of around 15%–20%.
In terms of competitive landscape, the global aluminum scrap market is characterized by the coexistence of regional recycling networks and large secondary aluminum consumers. The European and North American markets are mainly led by large integrated scrap metal recyclers, end-of-life vehicle dismantling systems, and closed-loop packaging recycling systems. In China, India, and Southeast Asia, the market is influenced by the growth of industrial aluminum scrap, expansion of secondary aluminum capacity, and changes in import policies. Future industry trends mainly include the improvement of automated aluminum scrap sorting, wider adoption of precise alloy grade identification, strengthening of automotive and packaging closed-loop recycling, improvement of low-carbon aluminum certification systems, higher regional recycling ratios, and the transformation of aluminum scrap from a low-end recycled material into a strategic secondary metal raw material.
This report delivers a comprehensive overview of the global Aluminum Scrap market, with both quantitative and qualitative analyses, to help readers develop growth strategies, assess the competitive landscape, evaluate their position in the current market, and make informed business decisions regarding Aluminum Scrap. The Aluminum Scrap market size, estimates, and forecasts are provided in terms of revenue (US$ millions), with 2025 as the base year and historical and forecast data for 2021–2032.
The report segments the global Aluminum Scrap market comprehensively. Regional market sizes by Type, by Application, by Physical Form, and by player are also provided. For deeper insight, the report profiles the competitive landscape, key competitors, and their respective market rankings, and discusses technological trends and new product developments.
This report will assist Aluminum Scrap manufacturers, new entrants, and companies across the industry value chain with information on revenues, sales volume, and average prices for the overall market and its sub-segments, by company, by Type, by Application, and by region.
Market Segmentation

Scope of Aluminum Scrap Market Report

Report Metric Details
Report Name Aluminum Scrap Market
Accounted market size in 2025 US$ 83520 million
Forecasted market size in 2032 US$ 98787 million
CAGR 2.2%
Base Year 2025
Forecasted years 2026 - 2032
Segment by Type
  • Industrial Aluminum Scrap
  • Post-consumer Aluminum Scrap
  • Automotive Aluminum Scrap
  • Construction Aluminum Scrap
  • Packaging Aluminum Scrap
  • Others
Segment by Physical Form
  • Aluminum Shredded Scrap
  • Aluminum Baled Scrap
  • Aluminum Briquetted Scrap
  • Aluminum Turnings and Chips
  • Mixed Aluminum Scrap
  • Others
Segment by Application
  • Recycled Aluminum Alloy Producers
  • Casting/Die Casting Companies
  • Rolling Companies
  • Extrusion Companies
  • Others
By Region
  • North America (United States, Canada)
  • Europe (Germany, France, UK, Italy, Russia) Rest of Europe
  • Nordic Countries
  • Asia-Pacific (China, Japan, South Korea)
  • Southeast Asia (India, Australia)
  • Rest of Asia
  • Latin America (Mexico, Brazil)
  • Rest of Latin America
  • Middle East & Africa (Turkey, Saudi Arabia, UAE, Rest of MEA)
By Company Novelis Inc., Norsk Hydro ASA, Innovation New Material Technology Co., Ltd., Matalco Inc., Constellium SE, Speira GmbH, Sims Limited, EMR Metal Recycling, Real Alloy, SA Recycling LLC, OmniSource, LLC, Derichebourg Environnement, Chiho Environmental Group Limited, Radius Recycling, Inc., TSR Recycling GmbH & Co. KG, Stena Recycling, Galloo Group, Kuusakoski Oy, Scholz Recycling GmbH, Daiki Aluminium Industry Co., Ltd., Raffmetal S.p.A., AMAG Austria Metall AG, UACJ Corporation, Ye Chiu Metal Recycling (China) Ltd., Chongqing Shunbo Aluminum Co., Ltd., Lizhong Group, Henan Mingtai Al. Industrial Co., Ltd., Shandong Nanshan Aluminium Co., Ltd., Metal Exchange Corporation, Audubon Metals LLC, Alter Trading Corporation, PADNOS, Alutrade Ltd., China Resources Recycling Group Co., Ltd., China Recycling Development Co., Ltd., Nupur Recyclers Limited, Gravita India Limited, Befesa S.A.
Forecast units USD million in value
Report coverage Revenue and volume forecast, company share, competitive landscape, growth factors and trends

Chapter Outline

  • Chapter 1: Defines the scope of the report and presents an executive summary of market segments (by Type, by Application, by Physical Form, etc.), including the size of each segment and its future growth potential. It offers a high-level view of the current market and its likely evolution in the short, medium, and long term.
  • Chapter 2: Summarizes global and regional market size and outlines market dynamics and recent developments, including key drivers, restraints, challenges and risks for industry participants, and relevant policy analysis.
  • Chapter 3: Provides a detailed view of the competitive landscape for Aluminum Scrap companies, covering revenue share, development plans, and mergers and acquisitions.
  • Chapter 4: Analyzes segments by Type, detailing the size and growth potential of each segment to help readers identify blue-ocean opportunities.
  • Chapter 5: Analyzes segments by Application, detailing the size and growth potential of each downstream segment to help readers identify blue-ocean opportunities.
  • Chapter 6–10: Regional deep dives (North America, Europe, Asia Pacific, Latin America, Middle East & Africa) broken down by country. Each chapter quantifies market size and growth potential by region and key countries, and outlines market development, outlook, addressable space, and capacity.
  • Chapter 11: Profiles key players, presenting essential information on leading companies, including product/ service offerings, revenue, gross margin, product introductions/portfolios, recent developments, etc.
  • Chapter 12: Key findings and conclusions of the report.

FAQ for this report

How fast is Aluminum Scrap Market growing?

Ans: The Aluminum Scrap Market witnessing a CAGR of 2.2% during the forecast period 2026-2032.

What is the Aluminum Scrap Market size in 2032?

Ans: The Aluminum Scrap Market size in 2032 will be US$ 98787 million.

Who are the main players in the Aluminum Scrap Market report?

Ans: The main players in the Aluminum Scrap Market are Novelis Inc., Norsk Hydro ASA, Innovation New Material Technology Co., Ltd., Matalco Inc., Constellium SE, Speira GmbH, Sims Limited, EMR Metal Recycling, Real Alloy, SA Recycling LLC, OmniSource, LLC, Derichebourg Environnement, Chiho Environmental Group Limited, Radius Recycling, Inc., TSR Recycling GmbH & Co. KG, Stena Recycling, Galloo Group, Kuusakoski Oy, Scholz Recycling GmbH, Daiki Aluminium Industry Co., Ltd., Raffmetal S.p.A., AMAG Austria Metall AG, UACJ Corporation, Ye Chiu Metal Recycling (China) Ltd., Chongqing Shunbo Aluminum Co., Ltd., Lizhong Group, Henan Mingtai Al. Industrial Co., Ltd., Shandong Nanshan Aluminium Co., Ltd., Metal Exchange Corporation, Audubon Metals LLC, Alter Trading Corporation, PADNOS, Alutrade Ltd., China Resources Recycling Group Co., Ltd., China Recycling Development Co., Ltd., Nupur Recyclers Limited, Gravita India Limited, Befesa S.A.

What are the Application segmentation covered in the Aluminum Scrap Market report?

Ans: The Applications covered in the Aluminum Scrap Market report are Recycled Aluminum Alloy Producers, Casting/Die Casting Companies, Rolling Companies, Extrusion Companies, Others

What are the Type segmentation covered in the Aluminum Scrap Market report?

Ans: The Types covered in the Aluminum Scrap Market report are Industrial Aluminum Scrap, Post-consumer Aluminum Scrap, Automotive Aluminum Scrap, Construction Aluminum Scrap, Packaging Aluminum Scrap, Others

1 Report Overview
1.1 Study Scope
1.2 Market Analysis by Type
1.2.1 Global Aluminum Scrap Market Size Growth Rate by Type: 2021 vs 2025 vs 2032
1.2.2 Industrial Aluminum Scrap
1.2.3 Post-consumer Aluminum Scrap
1.2.4 Automotive Aluminum Scrap
1.2.5 Construction Aluminum Scrap
1.2.6 Packaging Aluminum Scrap
1.2.7 Others
1.3 Market by Physical Form
1.3.1 Global Aluminum Scrap Market Size Growth Rate by Physical Form: 2021 vs 2025 vs 2032
1.3.2 Aluminum Shredded Scrap
1.3.3 Aluminum Baled Scrap
1.3.4 Aluminum Briquetted Scrap
1.3.5 Aluminum Turnings and Chips
1.3.6 Mixed Aluminum Scrap
1.3.7 Others
1.4 Market by Application
1.4.1 Global Aluminum Scrap Market Growth by Application: 2021 vs 2025 vs 2032
1.4.2 Recycled Aluminum Alloy Producers
1.4.3 Casting/Die Casting Companies
1.4.4 Rolling Companies
1.4.5 Extrusion Companies
1.4.6 Others
1.5 Assumptions and Limitations
1.6 Study Objectives
1.7 Years Considered
2 Global Growth Trends
2.1 Global Aluminum Scrap Market Perspective (2021–2032)
2.2 Global Aluminum Scrap Growth Trends by Region
2.2.1 Global Aluminum Scrap Market Size by Region: 2021 vs 2025 vs 2032
2.2.2 Aluminum Scrap Historic Market Size by Region (2021–2026)
2.2.3 Aluminum Scrap Forecasted Market Size by Region (2027–2032)
2.3 Aluminum Scrap Market Dynamics
2.3.1 Aluminum Scrap Industry Trends
2.3.2 Aluminum Scrap Market Drivers
2.3.3 Aluminum Scrap Market Challenges
2.3.4 Aluminum Scrap Market Restraints
3 Competition Landscape by Key Players
3.1 Global Top Aluminum Scrap Players by Revenue
3.1.1 Global Top Aluminum Scrap Players by Revenue (2021–2026)
3.1.2 Global Aluminum Scrap Revenue Market Share by Players (2021–2026)
3.2 Global Top Aluminum Scrap Players Market Share by Company Tier (Tier 1, Tier 2, Tier 3)
3.3 Global Key Players Ranking by Aluminum Scrap Revenue
3.4 Global Aluminum Scrap Market Concentration Ratio
3.4.1 Global Aluminum Scrap Market Concentration Ratio (CR5 and HHI)
3.4.2 Global Top 10 and Top 5 Companies by Aluminum Scrap Revenue in 2025
3.5 Global Key Players of Aluminum Scrap Head Offices and Areas Served
3.6 Global Key Players of Aluminum Scrap, Products and Applications
3.7 Global Key Players of Aluminum Scrap, Date of General Availability (GA)
3.8 Mergers and Acquisitions, Expansion Plans
4 Aluminum Scrap Breakdown Data by Type
4.1 Global Aluminum Scrap Historic Market Size by Type (2021–2026)
4.2 Global Aluminum Scrap Forecasted Market Size by Type (2027–2032)
5 Aluminum Scrap Breakdown Data by Application
5.1 Global Aluminum Scrap Historic Market Size by Application (2021–2026)
5.2 Global Aluminum Scrap Forecasted Market Size by Application (2027–2032)
6 North America
6.1 North America Aluminum Scrap Market Size (2021–2032)
6.2 North America Aluminum Scrap Market Growth Rate by Country: 2021 vs 2025 vs 2032
6.3 North America Aluminum Scrap Market Size by Country (2021–2026)
6.4 North America Aluminum Scrap Market Size by Country (2027–2032)
6.5 United States
6.6 Canada
7 Europe
7.1 Europe Aluminum Scrap Market Size (2021–2032)
7.2 Europe Aluminum Scrap Market Growth Rate by Country: 2021 vs 2025 vs 2032
7.3 Europe Aluminum Scrap Market Size by Country (2021–2026)
7.4 Europe Aluminum Scrap Market Size by Country (2027–2032)
7.5 Germany
7.6 France
7.7 U.K.
7.8 Italy
7.9 Russia
7.10 Ireland
8 Asia-Pacific
8.1 Asia-Pacific Aluminum Scrap Market Size (2021–2032)
8.2 Asia-Pacific Aluminum Scrap Market Growth Rate by Region: 2021 vs 2025 vs 2032
8.3 Asia-Pacific Aluminum Scrap Market Size by Region (2021–2026)
8.4 Asia-Pacific Aluminum Scrap Market Size by Region (2027–2032)
8.5 China
8.6 Japan
8.7 South Korea
8.8 Southeast Asia
8.9 India
8.10 Australia & New Zealand
9 Latin America
9.1 Latin America Aluminum Scrap Market Size (2021–2032)
9.2 Latin America Aluminum Scrap Market Growth Rate by Country: 2021 vs 2025 vs 2032
9.3 Latin America Aluminum Scrap Market Size by Country (2021–2026)
9.4 Latin America Aluminum Scrap Market Size by Country (2027–2032)
9.5 Mexico
9.6 Brazil
10 Middle East & Africa
10.1 Middle East & Africa Aluminum Scrap Market Size (2021–2032)
10.2 Middle East & Africa Aluminum Scrap Market Growth Rate by Country: 2021 vs 2025 vs 2032
10.3 Middle East & Africa Aluminum Scrap Market Size by Country (2021–2026)
10.4 Middle East & Africa Aluminum Scrap Market Size by Country (2027–2032)
10.5 Israel
10.6 Saudi Arabia
10.7 UAE
11 Key Players Profiles
11.1 Novelis Inc.
11.1.1 Novelis Inc. Company Details
11.1.2 Novelis Inc. Business Overview
11.1.3 Novelis Inc. Aluminum Scrap Introduction
11.1.4 Novelis Inc. Revenue in Aluminum Scrap Business (2021–2026)
11.1.5 Novelis Inc. Recent Development
11.2 Norsk Hydro ASA
11.2.1 Norsk Hydro ASA Company Details
11.2.2 Norsk Hydro ASA Business Overview
11.2.3 Norsk Hydro ASA Aluminum Scrap Introduction
11.2.4 Norsk Hydro ASA Revenue in Aluminum Scrap Business (2021–2026)
11.2.5 Norsk Hydro ASA Recent Development
11.3 Innovation New Material Technology Co., Ltd.
11.3.1 Innovation New Material Technology Co., Ltd. Company Details
11.3.2 Innovation New Material Technology Co., Ltd. Business Overview
11.3.3 Innovation New Material Technology Co., Ltd. Aluminum Scrap Introduction
11.3.4 Innovation New Material Technology Co., Ltd. Revenue in Aluminum Scrap Business (2021–2026)
11.3.5 Innovation New Material Technology Co., Ltd. Recent Development
11.4 Matalco Inc.
11.4.1 Matalco Inc. Company Details
11.4.2 Matalco Inc. Business Overview
11.4.3 Matalco Inc. Aluminum Scrap Introduction
11.4.4 Matalco Inc. Revenue in Aluminum Scrap Business (2021–2026)
11.4.5 Matalco Inc. Recent Development
11.5 Constellium SE
11.5.1 Constellium SE Company Details
11.5.2 Constellium SE Business Overview
11.5.3 Constellium SE Aluminum Scrap Introduction
11.5.4 Constellium SE Revenue in Aluminum Scrap Business (2021–2026)
11.5.5 Constellium SE Recent Development
11.6 Speira GmbH
11.6.1 Speira GmbH Company Details
11.6.2 Speira GmbH Business Overview
11.6.3 Speira GmbH Aluminum Scrap Introduction
11.6.4 Speira GmbH Revenue in Aluminum Scrap Business (2021–2026)
11.6.5 Speira GmbH Recent Development
11.7 Sims Limited
11.7.1 Sims Limited Company Details
11.7.2 Sims Limited Business Overview
11.7.3 Sims Limited Aluminum Scrap Introduction
11.7.4 Sims Limited Revenue in Aluminum Scrap Business (2021–2026)
11.7.5 Sims Limited Recent Development
11.8 EMR Metal Recycling
11.8.1 EMR Metal Recycling Company Details
11.8.2 EMR Metal Recycling Business Overview
11.8.3 EMR Metal Recycling Aluminum Scrap Introduction
11.8.4 EMR Metal Recycling Revenue in Aluminum Scrap Business (2021–2026)
11.8.5 EMR Metal Recycling Recent Development
11.9 Real Alloy
11.9.1 Real Alloy Company Details
11.9.2 Real Alloy Business Overview
11.9.3 Real Alloy Aluminum Scrap Introduction
11.9.4 Real Alloy Revenue in Aluminum Scrap Business (2021–2026)
11.9.5 Real Alloy Recent Development
11.10 SA Recycling LLC
11.10.1 SA Recycling LLC Company Details
11.10.2 SA Recycling LLC Business Overview
11.10.3 SA Recycling LLC Aluminum Scrap Introduction
11.10.4 SA Recycling LLC Revenue in Aluminum Scrap Business (2021–2026)
11.10.5 SA Recycling LLC Recent Development
11.11 OmniSource, LLC
11.11.1 OmniSource, LLC Company Details
11.11.2 OmniSource, LLC Business Overview
11.11.3 OmniSource, LLC Aluminum Scrap Introduction
11.11.4 OmniSource, LLC Revenue in Aluminum Scrap Business (2021–2026)
11.11.5 OmniSource, LLC Recent Development
11.12 Derichebourg Environnement
11.12.1 Derichebourg Environnement Company Details
11.12.2 Derichebourg Environnement Business Overview
11.12.3 Derichebourg Environnement Aluminum Scrap Introduction
11.12.4 Derichebourg Environnement Revenue in Aluminum Scrap Business (2021–2026)
11.12.5 Derichebourg Environnement Recent Development
11.13 Chiho Environmental Group Limited
11.13.1 Chiho Environmental Group Limited Company Details
11.13.2 Chiho Environmental Group Limited Business Overview
11.13.3 Chiho Environmental Group Limited Aluminum Scrap Introduction
11.13.4 Chiho Environmental Group Limited Revenue in Aluminum Scrap Business (2021–2026)
11.13.5 Chiho Environmental Group Limited Recent Development
11.14 Radius Recycling, Inc.
11.14.1 Radius Recycling, Inc. Company Details
11.14.2 Radius Recycling, Inc. Business Overview
11.14.3 Radius Recycling, Inc. Aluminum Scrap Introduction
11.14.4 Radius Recycling, Inc. Revenue in Aluminum Scrap Business (2021–2026)
11.14.5 Radius Recycling, Inc. Recent Development
11.15 TSR Recycling GmbH & Co. KG
11.15.1 TSR Recycling GmbH & Co. KG Company Details
11.15.2 TSR Recycling GmbH & Co. KG Business Overview
11.15.3 TSR Recycling GmbH & Co. KG Aluminum Scrap Introduction
11.15.4 TSR Recycling GmbH & Co. KG Revenue in Aluminum Scrap Business (2021–2026)
11.15.5 TSR Recycling GmbH & Co. KG Recent Development
11.16 Stena Recycling
11.16.1 Stena Recycling Company Details
11.16.2 Stena Recycling Business Overview
11.16.3 Stena Recycling Aluminum Scrap Introduction
11.16.4 Stena Recycling Revenue in Aluminum Scrap Business (2021–2026)
11.16.5 Stena Recycling Recent Development
11.17 Galloo Group
11.17.1 Galloo Group Company Details
11.17.2 Galloo Group Business Overview
11.17.3 Galloo Group Aluminum Scrap Introduction
11.17.4 Galloo Group Revenue in Aluminum Scrap Business (2021–2026)
11.17.5 Galloo Group Recent Development
11.18 Kuusakoski Oy
11.18.1 Kuusakoski Oy Company Details
11.18.2 Kuusakoski Oy Business Overview
11.18.3 Kuusakoski Oy Aluminum Scrap Introduction
11.18.4 Kuusakoski Oy Revenue in Aluminum Scrap Business (2021–2026)
11.18.5 Kuusakoski Oy Recent Development
11.19 Scholz Recycling GmbH
11.19.1 Scholz Recycling GmbH Company Details
11.19.2 Scholz Recycling GmbH Business Overview
11.19.3 Scholz Recycling GmbH Aluminum Scrap Introduction
11.19.4 Scholz Recycling GmbH Revenue in Aluminum Scrap Business (2021–2026)
11.19.5 Scholz Recycling GmbH Recent Development
11.20 Daiki Aluminium Industry Co., Ltd.
11.20.1 Daiki Aluminium Industry Co., Ltd. Company Details
11.20.2 Daiki Aluminium Industry Co., Ltd. Business Overview
11.20.3 Daiki Aluminium Industry Co., Ltd. Aluminum Scrap Introduction
11.20.4 Daiki Aluminium Industry Co., Ltd. Revenue in Aluminum Scrap Business (2021–2026)
11.20.5 Daiki Aluminium Industry Co., Ltd. Recent Development
11.21 Raffmetal S.p.A.
11.21.1 Raffmetal S.p.A. Company Details
11.21.2 Raffmetal S.p.A. Business Overview
11.21.3 Raffmetal S.p.A. Aluminum Scrap Introduction
11.21.4 Raffmetal S.p.A. Revenue in Aluminum Scrap Business (2021–2026)
11.21.5 Raffmetal S.p.A. Recent Development
11.22 AMAG Austria Metall AG
11.22.1 AMAG Austria Metall AG Company Details
11.22.2 AMAG Austria Metall AG Business Overview
11.22.3 AMAG Austria Metall AG Aluminum Scrap Introduction
11.22.4 AMAG Austria Metall AG Revenue in Aluminum Scrap Business (2021–2026)
11.22.5 AMAG Austria Metall AG Recent Development
11.23 UACJ Corporation
11.23.1 UACJ Corporation Company Details
11.23.2 UACJ Corporation Business Overview
11.23.3 UACJ Corporation Aluminum Scrap Introduction
11.23.4 UACJ Corporation Revenue in Aluminum Scrap Business (2021–2026)
11.23.5 UACJ Corporation Recent Development
11.24 Ye Chiu Metal Recycling (China) Ltd.
11.24.1 Ye Chiu Metal Recycling (China) Ltd. Company Details
11.24.2 Ye Chiu Metal Recycling (China) Ltd. Business Overview
11.24.3 Ye Chiu Metal Recycling (China) Ltd. Aluminum Scrap Introduction
11.24.4 Ye Chiu Metal Recycling (China) Ltd. Revenue in Aluminum Scrap Business (2021–2026)
11.24.5 Ye Chiu Metal Recycling (China) Ltd. Recent Development
11.25 Chongqing Shunbo Aluminum Co., Ltd.
11.25.1 Chongqing Shunbo Aluminum Co., Ltd. Company Details
11.25.2 Chongqing Shunbo Aluminum Co., Ltd. Business Overview
11.25.3 Chongqing Shunbo Aluminum Co., Ltd. Aluminum Scrap Introduction
11.25.4 Chongqing Shunbo Aluminum Co., Ltd. Revenue in Aluminum Scrap Business (2021–2026)
11.25.5 Chongqing Shunbo Aluminum Co., Ltd. Recent Development
11.26 Lizhong Group
11.26.1 Lizhong Group Company Details
11.26.2 Lizhong Group Business Overview
11.26.3 Lizhong Group Aluminum Scrap Introduction
11.26.4 Lizhong Group Revenue in Aluminum Scrap Business (2021–2026)
11.26.5 Lizhong Group Recent Development
11.27 Henan Mingtai Al. Industrial Co., Ltd.
11.27.1 Henan Mingtai Al. Industrial Co., Ltd. Company Details
11.27.2 Henan Mingtai Al. Industrial Co., Ltd. Business Overview
11.27.3 Henan Mingtai Al. Industrial Co., Ltd. Aluminum Scrap Introduction
11.27.4 Henan Mingtai Al. Industrial Co., Ltd. Revenue in Aluminum Scrap Business (2021–2026)
11.27.5 Henan Mingtai Al. Industrial Co., Ltd. Recent Development
11.28 Shandong Nanshan Aluminium Co., Ltd.
11.28.1 Shandong Nanshan Aluminium Co., Ltd. Company Details
11.28.2 Shandong Nanshan Aluminium Co., Ltd. Business Overview
11.28.3 Shandong Nanshan Aluminium Co., Ltd. Aluminum Scrap Introduction
11.28.4 Shandong Nanshan Aluminium Co., Ltd. Revenue in Aluminum Scrap Business (2021–2026)
11.28.5 Shandong Nanshan Aluminium Co., Ltd. Recent Development
11.29 Metal Exchange Corporation
11.29.1 Metal Exchange Corporation Company Details
11.29.2 Metal Exchange Corporation Business Overview
11.29.3 Metal Exchange Corporation Aluminum Scrap Introduction
11.29.4 Metal Exchange Corporation Revenue in Aluminum Scrap Business (2021–2026)
11.29.5 Metal Exchange Corporation Recent Development
11.30 Audubon Metals LLC
11.30.1 Audubon Metals LLC Company Details
11.30.2 Audubon Metals LLC Business Overview
11.30.3 Audubon Metals LLC Aluminum Scrap Introduction
11.30.4 Audubon Metals LLC Revenue in Aluminum Scrap Business (2021–2026)
11.30.5 Audubon Metals LLC Recent Development
11.31 Alter Trading Corporation
11.31.1 Alter Trading Corporation Company Details
11.31.2 Alter Trading Corporation Business Overview
11.31.3 Alter Trading Corporation Aluminum Scrap Introduction
11.31.4 Alter Trading Corporation Revenue in Aluminum Scrap Business (2021–2026)
11.31.5 Alter Trading Corporation Recent Development
11.32 PADNOS
11.32.1 PADNOS Company Details
11.32.2 PADNOS Business Overview
11.32.3 PADNOS Aluminum Scrap Introduction
11.32.4 PADNOS Revenue in Aluminum Scrap Business (2021–2026)
11.32.5 PADNOS Recent Development
11.33 Alutrade Ltd.
11.33.1 Alutrade Ltd. Company Details
11.33.2 Alutrade Ltd. Business Overview
11.33.3 Alutrade Ltd. Aluminum Scrap Introduction
11.33.4 Alutrade Ltd. Revenue in Aluminum Scrap Business (2021–2026)
11.33.5 Alutrade Ltd. Recent Development
11.34 China Resources Recycling Group Co., Ltd.
11.34.1 China Resources Recycling Group Co., Ltd. Company Details
11.34.2 China Resources Recycling Group Co., Ltd. Business Overview
11.34.3 China Resources Recycling Group Co., Ltd. Aluminum Scrap Introduction
11.34.4 China Resources Recycling Group Co., Ltd. Revenue in Aluminum Scrap Business (2021–2026)
11.34.5 China Resources Recycling Group Co., Ltd. Recent Development
11.35 China Recycling Development Co., Ltd.
11.35.1 China Recycling Development Co., Ltd. Company Details
11.35.2 China Recycling Development Co., Ltd. Business Overview
11.35.3 China Recycling Development Co., Ltd. Aluminum Scrap Introduction
11.35.4 China Recycling Development Co., Ltd. Revenue in Aluminum Scrap Business (2021–2026)
11.35.5 China Recycling Development Co., Ltd. Recent Development
11.36 Nupur Recyclers Limited
11.36.1 Nupur Recyclers Limited Company Details
11.36.2 Nupur Recyclers Limited Business Overview
11.36.3 Nupur Recyclers Limited Aluminum Scrap Introduction
11.36.4 Nupur Recyclers Limited Revenue in Aluminum Scrap Business (2021–2026)
11.36.5 Nupur Recyclers Limited Recent Development
11.37 Gravita India Limited
11.37.1 Gravita India Limited Company Details
11.37.2 Gravita India Limited Business Overview
11.37.3 Gravita India Limited Aluminum Scrap Introduction
11.37.4 Gravita India Limited Revenue in Aluminum Scrap Business (2021–2026)
11.37.5 Gravita India Limited Recent Development
11.38 Befesa S.A.
11.38.1 Befesa S.A. Company Details
11.38.2 Befesa S.A. Business Overview
11.38.3 Befesa S.A. Aluminum Scrap Introduction
11.38.4 Befesa S.A. Revenue in Aluminum Scrap Business (2021–2026)
11.38.5 Befesa S.A. Recent Development
12 Analyst's Viewpoints/Conclusions
13 Appendix
13.1 Research Methodology
13.1.1 Methodology/Research Approach
13.1.1.1 Research Programs/Design
13.1.1.2 Market Size Estimation
13.1.1.3 Market Breakdown and Data Triangulation
13.1.2 Data Source
13.1.2.1 Secondary Sources
13.1.2.2 Primary Sources
13.2 Author Details
13.3 Disclaimer
List of Tables
 Table 1. Global Aluminum Scrap Market Size Growth Rate by Type (US$ Million): 2021 vs 2025 vs 2032
 Table 2. Key Players of Industrial Aluminum Scrap
 Table 3. Key Players of Post-consumer Aluminum Scrap
 Table 4. Key Players of Automotive Aluminum Scrap
 Table 5. Key Players of Construction Aluminum Scrap
 Table 6. Key Players of Packaging Aluminum Scrap
 Table 7. Key Players of Others
 Table 8. Global Aluminum Scrap Market Size Growth Rate by Physical Form (US$ Million): 2021 vs 2025 vs 2032
 Table 9. Key Players of Aluminum Shredded Scrap
 Table 10. Key Players of Aluminum Baled Scrap
 Table 11. Key Players of Aluminum Briquetted Scrap
 Table 12. Key Players of Aluminum Turnings and Chips
 Table 13. Key Players of Mixed Aluminum Scrap
 Table 14. Key Players of Others
 Table 15. Global Aluminum Scrap Market Size Growth by Application (US$ Million): 2021 vs 2025 vs 2032
 Table 16. Global Aluminum Scrap Market Size by Region (US$ Million): 2021 vs 2025 vs 2032
 Table 17. Global Aluminum Scrap Market Size by Region (US$ Million), 2021–2026
 Table 18. Global Aluminum Scrap Market Share by Region (2021–2026)
 Table 19. Global Aluminum Scrap Forecasted Market Size by Region (US$ Million), 2027–2032
 Table 20. Global Aluminum Scrap Market Share by Region (2027–2032)
 Table 21. Aluminum Scrap Market Trends
 Table 22. Aluminum Scrap Market Drivers
 Table 23. Aluminum Scrap Market Challenges
 Table 24. Aluminum Scrap Market Restraints
 Table 25. Global Aluminum Scrap Revenue by Players (US$ Million), 2021–2026
 Table 26. Global Aluminum Scrap Market Share by Players (2021–2026)
 Table 27. Global Top Aluminum Scrap Players by Tier (Tier 1, Tier 2, and Tier 3), based on Aluminum Scrap Revenue, 2025
 Table 28. Ranking of Global Top Aluminum Scrap Companies by Revenue (US$ Million) in 2025
 Table 29. Global 5 Largest Players Market Share by Aluminum Scrap Revenue (CR5 and HHI), 2021–2026
 Table 30. Global Key Players of Aluminum Scrap, Headquarters and Area Served
 Table 31. Global Key Players of Aluminum Scrap, Products and Applications
 Table 32. Global Key Players of Aluminum Scrap, Date of General Availability (GA)
 Table 33. Mergers and Acquisitions, Expansion Plans
 Table 34. Global Aluminum Scrap Market Size by Type (US$ Million), 2021–2026
 Table 35. Global Aluminum Scrap Revenue Market Share by Type (2021–2026)
 Table 36. Global Aluminum Scrap Forecasted Market Size by Type (US$ Million), 2027–2032
 Table 37. Global Aluminum Scrap Revenue Market Share by Type (2027–2032)
 Table 38. Global Aluminum Scrap Market Size by Application (US$ Million), 2021–2026
 Table 39. Global Aluminum Scrap Revenue Market Share by Application (2021–2026)
 Table 40. Global Aluminum Scrap Forecasted Market Size by Application (US$ Million), 2027–2032
 Table 41. Global Aluminum Scrap Revenue Market Share by Application (2027–2032)
 Table 42. North America Aluminum Scrap Market Size Growth Rate by Country (US$ Million): 2021 vs 2025 vs 2032
 Table 43. North America Aluminum Scrap Market Size by Country (US$ Million), 2021–2026
 Table 44. North America Aluminum Scrap Market Size by Country (US$ Million), 2027–2032
 Table 45. Europe Aluminum Scrap Market Size Growth Rate by Country (US$ Million): 2021 vs 2025 vs 2032
 Table 46. Europe Aluminum Scrap Market Size by Country (US$ Million), 2021–2026
 Table 47. Europe Aluminum Scrap Market Size by Country (US$ Million), 2027–2032
 Table 48. Asia-Pacific Aluminum Scrap Market Size Growth Rate by Region (US$ Million): 2021 vs 2025 vs 2032
 Table 49. Asia-Pacific Aluminum Scrap Market Size by Region (US$ Million), 2021–2026
 Table 50. Asia-Pacific Aluminum Scrap Market Size by Region (US$ Million), 2027–2032
 Table 51. Latin America Aluminum Scrap Market Size Growth Rate by Country (US$ Million): 2021 vs 2025 vs 2032
 Table 52. Latin America Aluminum Scrap Market Size by Country (US$ Million), 2021–2026
 Table 53. Latin America Aluminum Scrap Market Size by Country (US$ Million), 2027–2032
 Table 54. Middle East & Africa Aluminum Scrap Market Size Growth Rate by Country (US$ Million): 2021 vs 2025 vs 2032
 Table 55. Middle East & Africa Aluminum Scrap Market Size by Country (US$ Million), 2021–2026
 Table 56. Middle East & Africa Aluminum Scrap Market Size by Country (US$ Million), 2027–2032
 Table 57. Novelis Inc. Company Details
 Table 58. Novelis Inc. Business Overview
 Table 59. Novelis Inc. Aluminum Scrap Product
 Table 60. Novelis Inc. Revenue in Aluminum Scrap Business (US$ Million), 2021–2026
 Table 61. Novelis Inc. Recent Development
 Table 62. Norsk Hydro ASA Company Details
 Table 63. Norsk Hydro ASA Business Overview
 Table 64. Norsk Hydro ASA Aluminum Scrap Product
 Table 65. Norsk Hydro ASA Revenue in Aluminum Scrap Business (US$ Million), 2021–2026
 Table 66. Norsk Hydro ASA Recent Development
 Table 67. Innovation New Material Technology Co., Ltd. Company Details
 Table 68. Innovation New Material Technology Co., Ltd. Business Overview
 Table 69. Innovation New Material Technology Co., Ltd. Aluminum Scrap Product
 Table 70. Innovation New Material Technology Co., Ltd. Revenue in Aluminum Scrap Business (US$ Million), 2021–2026
 Table 71. Innovation New Material Technology Co., Ltd. Recent Development
 Table 72. Matalco Inc. Company Details
 Table 73. Matalco Inc. Business Overview
 Table 74. Matalco Inc. Aluminum Scrap Product
 Table 75. Matalco Inc. Revenue in Aluminum Scrap Business (US$ Million), 2021–2026
 Table 76. Matalco Inc. Recent Development
 Table 77. Constellium SE Company Details
 Table 78. Constellium SE Business Overview
 Table 79. Constellium SE Aluminum Scrap Product
 Table 80. Constellium SE Revenue in Aluminum Scrap Business (US$ Million), 2021–2026
 Table 81. Constellium SE Recent Development
 Table 82. Speira GmbH Company Details
 Table 83. Speira GmbH Business Overview
 Table 84. Speira GmbH Aluminum Scrap Product
 Table 85. Speira GmbH Revenue in Aluminum Scrap Business (US$ Million), 2021–2026
 Table 86. Speira GmbH Recent Development
 Table 87. Sims Limited Company Details
 Table 88. Sims Limited Business Overview
 Table 89. Sims Limited Aluminum Scrap Product
 Table 90. Sims Limited Revenue in Aluminum Scrap Business (US$ Million), 2021–2026
 Table 91. Sims Limited Recent Development
 Table 92. EMR Metal Recycling Company Details
 Table 93. EMR Metal Recycling Business Overview
 Table 94. EMR Metal Recycling Aluminum Scrap Product
 Table 95. EMR Metal Recycling Revenue in Aluminum Scrap Business (US$ Million), 2021–2026
 Table 96. EMR Metal Recycling Recent Development
 Table 97. Real Alloy Company Details
 Table 98. Real Alloy Business Overview
 Table 99. Real Alloy Aluminum Scrap Product
 Table 100. Real Alloy Revenue in Aluminum Scrap Business (US$ Million), 2021–2026
 Table 101. Real Alloy Recent Development
 Table 102. SA Recycling LLC Company Details
 Table 103. SA Recycling LLC Business Overview
 Table 104. SA Recycling LLC Aluminum Scrap Product
 Table 105. SA Recycling LLC Revenue in Aluminum Scrap Business (US$ Million), 2021–2026
 Table 106. SA Recycling LLC Recent Development
 Table 107. OmniSource, LLC Company Details
 Table 108. OmniSource, LLC Business Overview
 Table 109. OmniSource, LLC Aluminum Scrap Product
 Table 110. OmniSource, LLC Revenue in Aluminum Scrap Business (US$ Million), 2021–2026
 Table 111. OmniSource, LLC Recent Development
 Table 112. Derichebourg Environnement Company Details
 Table 113. Derichebourg Environnement Business Overview
 Table 114. Derichebourg Environnement Aluminum Scrap Product
 Table 115. Derichebourg Environnement Revenue in Aluminum Scrap Business (US$ Million), 2021–2026
 Table 116. Derichebourg Environnement Recent Development
 Table 117. Chiho Environmental Group Limited Company Details
 Table 118. Chiho Environmental Group Limited Business Overview
 Table 119. Chiho Environmental Group Limited Aluminum Scrap Product
 Table 120. Chiho Environmental Group Limited Revenue in Aluminum Scrap Business (US$ Million), 2021–2026
 Table 121. Chiho Environmental Group Limited Recent Development
 Table 122. Radius Recycling, Inc. Company Details
 Table 123. Radius Recycling, Inc. Business Overview
 Table 124. Radius Recycling, Inc. Aluminum Scrap Product
 Table 125. Radius Recycling, Inc. Revenue in Aluminum Scrap Business (US$ Million), 2021–2026
 Table 126. Radius Recycling, Inc. Recent Development
 Table 127. TSR Recycling GmbH & Co. KG Company Details
 Table 128. TSR Recycling GmbH & Co. KG Business Overview
 Table 129. TSR Recycling GmbH & Co. KG Aluminum Scrap Product
 Table 130. TSR Recycling GmbH & Co. KG Revenue in Aluminum Scrap Business (US$ Million), 2021–2026
 Table 131. TSR Recycling GmbH & Co. KG Recent Development
 Table 132. Stena Recycling Company Details
 Table 133. Stena Recycling Business Overview
 Table 134. Stena Recycling Aluminum Scrap Product
 Table 135. Stena Recycling Revenue in Aluminum Scrap Business (US$ Million), 2021–2026
 Table 136. Stena Recycling Recent Development
 Table 137. Galloo Group Company Details
 Table 138. Galloo Group Business Overview
 Table 139. Galloo Group Aluminum Scrap Product
 Table 140. Galloo Group Revenue in Aluminum Scrap Business (US$ Million), 2021–2026
 Table 141. Galloo Group Recent Development
 Table 142. Kuusakoski Oy Company Details
 Table 143. Kuusakoski Oy Business Overview
 Table 144. Kuusakoski Oy Aluminum Scrap Product
 Table 145. Kuusakoski Oy Revenue in Aluminum Scrap Business (US$ Million), 2021–2026
 Table 146. Kuusakoski Oy Recent Development
 Table 147. Scholz Recycling GmbH Company Details
 Table 148. Scholz Recycling GmbH Business Overview
 Table 149. Scholz Recycling GmbH Aluminum Scrap Product
 Table 150. Scholz Recycling GmbH Revenue in Aluminum Scrap Business (US$ Million), 2021–2026
 Table 151. Scholz Recycling GmbH Recent Development
 Table 152. Daiki Aluminium Industry Co., Ltd. Company Details
 Table 153. Daiki Aluminium Industry Co., Ltd. Business Overview
 Table 154. Daiki Aluminium Industry Co., Ltd. Aluminum Scrap Product
 Table 155. Daiki Aluminium Industry Co., Ltd. Revenue in Aluminum Scrap Business (US$ Million), 2021–2026
 Table 156. Daiki Aluminium Industry Co., Ltd. Recent Development
 Table 157. Raffmetal S.p.A. Company Details
 Table 158. Raffmetal S.p.A. Business Overview
 Table 159. Raffmetal S.p.A. Aluminum Scrap Product
 Table 160. Raffmetal S.p.A. Revenue in Aluminum Scrap Business (US$ Million), 2021–2026
 Table 161. Raffmetal S.p.A. Recent Development
 Table 162. AMAG Austria Metall AG Company Details
 Table 163. AMAG Austria Metall AG Business Overview
 Table 164. AMAG Austria Metall AG Aluminum Scrap Product
 Table 165. AMAG Austria Metall AG Revenue in Aluminum Scrap Business (US$ Million), 2021–2026
 Table 166. AMAG Austria Metall AG Recent Development
 Table 167. UACJ Corporation Company Details
 Table 168. UACJ Corporation Business Overview
 Table 169. UACJ Corporation Aluminum Scrap Product
 Table 170. UACJ Corporation Revenue in Aluminum Scrap Business (US$ Million), 2021–2026
 Table 171. UACJ Corporation Recent Development
 Table 172. Ye Chiu Metal Recycling (China) Ltd. Company Details
 Table 173. Ye Chiu Metal Recycling (China) Ltd. Business Overview
 Table 174. Ye Chiu Metal Recycling (China) Ltd. Aluminum Scrap Product
 Table 175. Ye Chiu Metal Recycling (China) Ltd. Revenue in Aluminum Scrap Business (US$ Million), 2021–2026
 Table 176. Ye Chiu Metal Recycling (China) Ltd. Recent Development
 Table 177. Chongqing Shunbo Aluminum Co., Ltd. Company Details
 Table 178. Chongqing Shunbo Aluminum Co., Ltd. Business Overview
 Table 179. Chongqing Shunbo Aluminum Co., Ltd. Aluminum Scrap Product
 Table 180. Chongqing Shunbo Aluminum Co., Ltd. Revenue in Aluminum Scrap Business (US$ Million), 2021–2026
 Table 181. Chongqing Shunbo Aluminum Co., Ltd. Recent Development
 Table 182. Lizhong Group Company Details
 Table 183. Lizhong Group Business Overview
 Table 184. Lizhong Group Aluminum Scrap Product
 Table 185. Lizhong Group Revenue in Aluminum Scrap Business (US$ Million), 2021–2026
 Table 186. Lizhong Group Recent Development
 Table 187. Henan Mingtai Al. Industrial Co., Ltd. Company Details
 Table 188. Henan Mingtai Al. Industrial Co., Ltd. Business Overview
 Table 189. Henan Mingtai Al. Industrial Co., Ltd. Aluminum Scrap Product
 Table 190. Henan Mingtai Al. Industrial Co., Ltd. Revenue in Aluminum Scrap Business (US$ Million), 2021–2026
 Table 191. Henan Mingtai Al. Industrial Co., Ltd. Recent Development
 Table 192. Shandong Nanshan Aluminium Co., Ltd. Company Details
 Table 193. Shandong Nanshan Aluminium Co., Ltd. Business Overview
 Table 194. Shandong Nanshan Aluminium Co., Ltd. Aluminum Scrap Product
 Table 195. Shandong Nanshan Aluminium Co., Ltd. Revenue in Aluminum Scrap Business (US$ Million), 2021–2026
 Table 196. Shandong Nanshan Aluminium Co., Ltd. Recent Development
 Table 197. Metal Exchange Corporation Company Details
 Table 198. Metal Exchange Corporation Business Overview
 Table 199. Metal Exchange Corporation Aluminum Scrap Product
 Table 200. Metal Exchange Corporation Revenue in Aluminum Scrap Business (US$ Million), 2021–2026
 Table 201. Metal Exchange Corporation Recent Development
 Table 202. Audubon Metals LLC Company Details
 Table 203. Audubon Metals LLC Business Overview
 Table 204. Audubon Metals LLC Aluminum Scrap Product
 Table 205. Audubon Metals LLC Revenue in Aluminum Scrap Business (US$ Million), 2021–2026
 Table 206. Audubon Metals LLC Recent Development
 Table 207. Alter Trading Corporation Company Details
 Table 208. Alter Trading Corporation Business Overview
 Table 209. Alter Trading Corporation Aluminum Scrap Product
 Table 210. Alter Trading Corporation Revenue in Aluminum Scrap Business (US$ Million), 2021–2026
 Table 211. Alter Trading Corporation Recent Development
 Table 212. PADNOS Company Details
 Table 213. PADNOS Business Overview
 Table 214. PADNOS Aluminum Scrap Product
 Table 215. PADNOS Revenue in Aluminum Scrap Business (US$ Million), 2021–2026
 Table 216. PADNOS Recent Development
 Table 217. Alutrade Ltd. Company Details
 Table 218. Alutrade Ltd. Business Overview
 Table 219. Alutrade Ltd. Aluminum Scrap Product
 Table 220. Alutrade Ltd. Revenue in Aluminum Scrap Business (US$ Million), 2021–2026
 Table 221. Alutrade Ltd. Recent Development
 Table 222. China Resources Recycling Group Co., Ltd. Company Details
 Table 223. China Resources Recycling Group Co., Ltd. Business Overview
 Table 224. China Resources Recycling Group Co., Ltd. Aluminum Scrap Product
 Table 225. China Resources Recycling Group Co., Ltd. Revenue in Aluminum Scrap Business (US$ Million), 2021–2026
 Table 226. China Resources Recycling Group Co., Ltd. Recent Development
 Table 227. China Recycling Development Co., Ltd. Company Details
 Table 228. China Recycling Development Co., Ltd. Business Overview
 Table 229. China Recycling Development Co., Ltd. Aluminum Scrap Product
 Table 230. China Recycling Development Co., Ltd. Revenue in Aluminum Scrap Business (US$ Million), 2021–2026
 Table 231. China Recycling Development Co., Ltd. Recent Development
 Table 232. Nupur Recyclers Limited Company Details
 Table 233. Nupur Recyclers Limited Business Overview
 Table 234. Nupur Recyclers Limited Aluminum Scrap Product
 Table 235. Nupur Recyclers Limited Revenue in Aluminum Scrap Business (US$ Million), 2021–2026
 Table 236. Nupur Recyclers Limited Recent Development
 Table 237. Gravita India Limited Company Details
 Table 238. Gravita India Limited Business Overview
 Table 239. Gravita India Limited Aluminum Scrap Product
 Table 240. Gravita India Limited Revenue in Aluminum Scrap Business (US$ Million), 2021–2026
 Table 241. Gravita India Limited Recent Development
 Table 242. Befesa S.A. Company Details
 Table 243. Befesa S.A. Business Overview
 Table 244. Befesa S.A. Aluminum Scrap Product
 Table 245. Befesa S.A. Revenue in Aluminum Scrap Business (US$ Million), 2021–2026
 Table 246. Befesa S.A. Recent Development
 Table 247. Research Programs/Design for This Report
 Table 248. Key Data Information from Secondary Sources
 Table 249. Key Data Information from Primary Sources
 Table 250. Authors List of This Report


List of Figures
 Figure 1. Aluminum Scrap Picture
 Figure 2. Global Aluminum Scrap Market Size Comparison by Type (US$ Million), 2021–2032
 Figure 3. Global Aluminum Scrap Market Share by Type: 2025 vs 2032
 Figure 4. Industrial Aluminum Scrap Features
 Figure 5. Post-consumer Aluminum Scrap Features
 Figure 6. Automotive Aluminum Scrap Features
 Figure 7. Construction Aluminum Scrap Features
 Figure 8. Packaging Aluminum Scrap Features
 Figure 9. Others Features
 Figure 10. Global Aluminum Scrap Market Size Comparison by Physical Form (US$ Million), 2021–2032
 Figure 11. Aluminum Shredded Scrap Features
 Figure 12. Aluminum Baled Scrap Features
 Figure 13. Aluminum Briquetted Scrap Features
 Figure 14. Aluminum Turnings and Chips Features
 Figure 15. Mixed Aluminum Scrap Features
 Figure 16. Others Features
 Figure 17. Global Aluminum Scrap Market Size by Application (US$ Million), 2021–2032
 Figure 18. Global Aluminum Scrap Market Share by Application: 2025 vs 2032
 Figure 19. Recycled Aluminum Alloy Producers Case Studies
 Figure 20. Casting/Die Casting Companies Case Studies
 Figure 21. Rolling Companies Case Studies
 Figure 22. Extrusion Companies Case Studies
 Figure 23. Others Case Studies
 Figure 24. Aluminum Scrap Report Years Considered
 Figure 25. Global Aluminum Scrap Market Size (US$ Million), Year-over-Year: 2021–2032
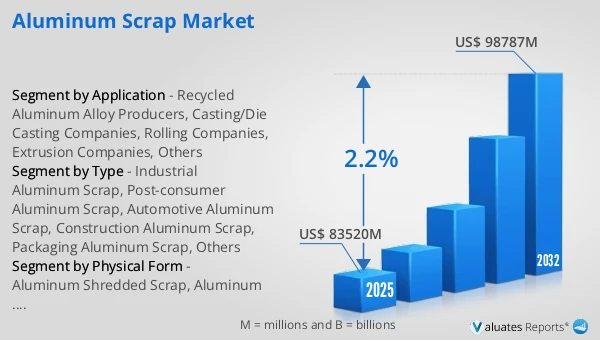
 Figure 26. Global Aluminum Scrap Market Size, (US$ Million), 2021 vs 2025 vs 2032
 Figure 27. Global Aluminum Scrap Market Share by Region: 2025 vs 2032
 Figure 28. Global Aluminum Scrap Market Share by Players in 2025
 Figure 29. Global Aluminum Scrap Market Share by Company Type (Tier 1, Tier 2, and Tier 3)
 Figure 30. The Top 10 and 5 Players Market Share by Aluminum Scrap Revenue in 2025
 Figure 31. North America Aluminum Scrap Market Size YoY Growth (US$ Million), 2021–2032
 Figure 32. North America Aluminum Scrap Market Share by Country (2021–2032)
 Figure 33. United States Aluminum Scrap Market Size YoY Growth (US$ Million), 2021–2032
 Figure 34. Canada Aluminum Scrap Market Size YoY Growth (US$ Million), 2021–2032
 Figure 35. Europe Aluminum Scrap Market Size YoY Growth (US$ Million), 2021–2032
 Figure 36. Europe Aluminum Scrap Market Share by Country (2021–2032)
 Figure 37. Germany Aluminum Scrap Market Size YoY Growth (US$ Million), 2021–2032
 Figure 38. France Aluminum Scrap Market Size YoY Growth (US$ Million), 2021–2032
 Figure 39. U.K. Aluminum Scrap Market Size YoY Growth (US$ Million), 2021–2032
 Figure 40. Italy Aluminum Scrap Market Size YoY Growth (US$ Million), 2021–2032
 Figure 41. Russia Aluminum Scrap Market Size YoY Growth (US$ Million), 2021–2032
 Figure 42. Ireland Aluminum Scrap Market Size YoY Growth (US$ Million), 2021–2032
 Figure 43. Asia-Pacific Aluminum Scrap Market Size YoY Growth (US$ Million), 2021–2032
 Figure 44. Asia-Pacific Aluminum Scrap Market Share by Region (2021–2032)
 Figure 45. China Aluminum Scrap Market Size YoY Growth (US$ Million), 2021–2032
 Figure 46. Japan Aluminum Scrap Market Size YoY Growth (US$ Million), 2021–2032
 Figure 47. South Korea Aluminum Scrap Market Size YoY Growth (US$ Million), 2021–2032
 Figure 48. Southeast Asia Aluminum Scrap Market Size YoY Growth (US$ Million), 2021–2032
 Figure 49. India Aluminum Scrap Market Size YoY Growth (US$ Million), 2021–2032
 Figure 50. Australia & New Zealand Aluminum Scrap Market Size YoY Growth (US$ Million), 2021–2032
 Figure 51. Latin America Aluminum Scrap Market Size YoY Growth (US$ Million), 2021–2032
 Figure 52. Latin America Aluminum Scrap Market Share by Country (2021–2032)
 Figure 53. Mexico Aluminum Scrap Market Size YoY Growth (US$ Million), 2021–2032
 Figure 54. Brazil Aluminum Scrap Market Size YoY Growth (US$ Million), 2021–2032
 Figure 55. Middle East & Africa Aluminum Scrap Market Size YoY Growth (US$ Million), 2021–2032
 Figure 56. Middle East & Africa Aluminum Scrap Market Share by Country (2021–2032)
 Figure 57. Israel Aluminum Scrap Market Size YoY Growth (US$ Million), 2021–2032
 Figure 58. Saudi Arabia Aluminum Scrap Market Size YoY Growth (US$ Million), 2021–2032
 Figure 59. UAE Aluminum Scrap Market Size YoY Growth (US$ Million), 2021–2032
 Figure 60. Novelis Inc. Revenue Growth Rate in Aluminum Scrap Business (2021–2026)
 Figure 61. Norsk Hydro ASA Revenue Growth Rate in Aluminum Scrap Business (2021–2026)
 Figure 62. Innovation New Material Technology Co., Ltd. Revenue Growth Rate in Aluminum Scrap Business (2021–2026)
 Figure 63. Matalco Inc. Revenue Growth Rate in Aluminum Scrap Business (2021–2026)
 Figure 64. Constellium SE Revenue Growth Rate in Aluminum Scrap Business (2021–2026)
 Figure 65. Speira GmbH Revenue Growth Rate in Aluminum Scrap Business (2021–2026)
 Figure 66. Sims Limited Revenue Growth Rate in Aluminum Scrap Business (2021–2026)
 Figure 67. EMR Metal Recycling Revenue Growth Rate in Aluminum Scrap Business (2021–2026)
 Figure 68. Real Alloy Revenue Growth Rate in Aluminum Scrap Business (2021–2026)
 Figure 69. SA Recycling LLC Revenue Growth Rate in Aluminum Scrap Business (2021–2026)
 Figure 70. OmniSource, LLC Revenue Growth Rate in Aluminum Scrap Business (2021–2026)
 Figure 71. Derichebourg Environnement Revenue Growth Rate in Aluminum Scrap Business (2021–2026)
 Figure 72. Chiho Environmental Group Limited Revenue Growth Rate in Aluminum Scrap Business (2021–2026)
 Figure 73. Radius Recycling, Inc. Revenue Growth Rate in Aluminum Scrap Business (2021–2026)
 Figure 74. TSR Recycling GmbH & Co. KG Revenue Growth Rate in Aluminum Scrap Business (2021–2026)
 Figure 75. Stena Recycling Revenue Growth Rate in Aluminum Scrap Business (2021–2026)
 Figure 76. Galloo Group Revenue Growth Rate in Aluminum Scrap Business (2021–2026)
 Figure 77. Kuusakoski Oy Revenue Growth Rate in Aluminum Scrap Business (2021–2026)
 Figure 78. Scholz Recycling GmbH Revenue Growth Rate in Aluminum Scrap Business (2021–2026)
 Figure 79. Daiki Aluminium Industry Co., Ltd. Revenue Growth Rate in Aluminum Scrap Business (2021–2026)
 Figure 80. Raffmetal S.p.A. Revenue Growth Rate in Aluminum Scrap Business (2021–2026)
 Figure 81. AMAG Austria Metall AG Revenue Growth Rate in Aluminum Scrap Business (2021–2026)
 Figure 82. UACJ Corporation Revenue Growth Rate in Aluminum Scrap Business (2021–2026)
 Figure 83. Ye Chiu Metal Recycling (China) Ltd. Revenue Growth Rate in Aluminum Scrap Business (2021–2026)
 Figure 84. Chongqing Shunbo Aluminum Co., Ltd. Revenue Growth Rate in Aluminum Scrap Business (2021–2026)
 Figure 85. Lizhong Group Revenue Growth Rate in Aluminum Scrap Business (2021–2026)
 Figure 86. Henan Mingtai Al. Industrial Co., Ltd. Revenue Growth Rate in Aluminum Scrap Business (2021–2026)
 Figure 87. Shandong Nanshan Aluminium Co., Ltd. Revenue Growth Rate in Aluminum Scrap Business (2021–2026)
 Figure 88. Metal Exchange Corporation Revenue Growth Rate in Aluminum Scrap Business (2021–2026)
 Figure 89. Audubon Metals LLC Revenue Growth Rate in Aluminum Scrap Business (2021–2026)
 Figure 90. Alter Trading Corporation Revenue Growth Rate in Aluminum Scrap Business (2021–2026)
 Figure 91. PADNOS Revenue Growth Rate in Aluminum Scrap Business (2021–2026)
 Figure 92. Alutrade Ltd. Revenue Growth Rate in Aluminum Scrap Business (2021–2026)
 Figure 93. China Resources Recycling Group Co., Ltd. Revenue Growth Rate in Aluminum Scrap Business (2021–2026)
 Figure 94. China Recycling Development Co., Ltd. Revenue Growth Rate in Aluminum Scrap Business (2021–2026)
 Figure 95. Nupur Recyclers Limited Revenue Growth Rate in Aluminum Scrap Business (2021–2026)
 Figure 96. Gravita India Limited Revenue Growth Rate in Aluminum Scrap Business (2021–2026)
 Figure 97. Befesa S.A. Revenue Growth Rate in Aluminum Scrap Business (2021–2026)
 Figure 98. Bottom-up and Top-down Approaches for This Report
 Figure 99. Data Triangulation
 Figure 100. Key Executives Interviewed
SELECT A FORMAT
Added to Cart
Electronic

$2900

Single User License
Electronic

$4350

Multi User License
Electronic

$5800

Enterprise License
Add to Cart
Buy Now (15% Discount)

OUR CUSTOMER

SIS Group of Schools

SIMILAR REPORTS