List of Tables
Table 1. Online Electronic Repair Service Market Trends
Table 2. Online Electronic Repair Service Market Drivers & Opportunities
Table 3. Online Electronic Repair Service Market Challenges
Table 4. Online Electronic Repair Service Market Restraints
Table 5. Global Online Electronic Repair Service Revenue by Company (US$ Million), 2021–2026
Table 6. Global Online Electronic Repair Service Revenue Market Share by Company (2021–2026)
Table 7. Key Companies’ R&D and Operations Footprint and Headquarters
Table 8. Key Companies Online Electronic Repair Service Product Type
Table 9. Key Companies General Availability (GA) Timeline for Online Electronic Repair Service
Table 10. Global Online Electronic Repair Service Companies Market Concentration Ratio (CR5 and HHI)
Table 11. Global Companies by Tier (Tier 1, Tier 2, Tier 3), based on Online Electronic Repair Service revenue, 2025
Table 12. Mergers & Acquisitions and Expansion Plans
Table 13. Global Online Electronic Repair Service Sales Value by Type: 2021 vs 2025 vs 2032 (US$ Million)
Table 14. Global Online Electronic Repair Service Sales Value by Type (US$ Million), 2021–2026
Table 15. Global Online Electronic Repair Service Sales Value by Type (US$ Million), 2027–2032
Table 16. Global Online Electronic Repair Service Sales Market Share in Value by Type (2021–2026)
Table 17. Global Online Electronic Repair Service Sales Market Share in Value by Type (2027–2032)
Table 18. Global Online Electronic Repair Service Sales Value by Service Model: 2021 vs 2025 vs 2032 (US$ Million)
Table 19. Global Online Electronic Repair Service Sales Value by Service Model (US$ Million), 2021–2026
Table 20. Global Online Electronic Repair Service Sales Value by Service Model (US$ Million), 2027–2032
Table 21. Global Online Electronic Repair Service Sales Market Share in Value by Service Model (2021–2026)
Table 22. Global Online Electronic Repair Service Sales Market Share in Value by Service Model (2027–2032)
Table 23. Global Online Electronic Repair Service Sales Value by Repair Type: 2021 vs 2025 vs 2032 (US$ Million)
Table 24. Global Online Electronic Repair Service Sales Value by Repair Type (US$ Million), 2021–2026
Table 25. Global Online Electronic Repair Service Sales Value by Repair Type (US$ Million), 2027–2032
Table 26. Global Online Electronic Repair Service Sales Market Share in Value by Repair Type (2021–2026)
Table 27. Global Online Electronic Repair Service Sales Market Share in Value by Repair Type (2027–2032)
Table 28. Global Online Electronic Repair Service Sales Value by Application: 2021 vs 2025 vs 2032 (US$ Million)
Table 29. Global Online Electronic Repair Service Sales Value by Application (US$ Million), 2021–2026
Table 30. Global Online Electronic Repair Service Sales Value by Application (US$ Million), 2027–2032
Table 31. Global Online Electronic Repair Service Sales Market Share in Value by Application (2021–2026)
Table 32. Global Online Electronic Repair Service Sales Market Share in Value by Application (2027–2032)
Table 33. Global Online Electronic Repair Service Sales Value by Region, (US$ Million), 2021 vs 2025 vs 2032
Table 34. Global Online Electronic Repair Service Sales Value by Region (US$ Million), 2021–2026
Table 35. Global Online Electronic Repair Service Sales Value by Region (US$ Million), 2027–2032
Table 36. Global Online Electronic Repair Service Sales Value by Region (%), 2021–2026
Table 37. Global Online Electronic Repair Service Sales Value by Region (%), 2027–2032
Table 38. Key Countries/Regions Online Electronic Repair Service Sales Value Growth Trends, (US$ Million): 2021 vs 2025 vs 2032
Table 39. Key Countries/Regions Online Electronic Repair Service Sales Value, (US$ Million), 2021–2026
Table 40. Key Countries/Regions Online Electronic Repair Service Sales Value, (US$ Million), 2027–2032
Table 41. iCracked Basic Information List
Table 42. iCracked Description and Business Overview
Table 43. iCracked Online Electronic Repair Service Products, Services, and Solutions
Table 44. Revenue (US$ Million) in Online Electronic Repair Service Business of iCracked (2021–2026)
Table 45. iCracked Recent Developments
Table 46. uBreakiFix Basic Information List
Table 47. uBreakiFix Description and Business Overview
Table 48. uBreakiFix Online Electronic Repair Service Products, Services, and Solutions
Table 49. Revenue (US$ Million) in Online Electronic Repair Service Business of uBreakiFix (2021–2026)
Table 50. uBreakiFix Recent Developments
Table 51. Puls Technologies Inc. Basic Information List
Table 52. Puls Technologies Inc. Description and Business Overview
Table 53. Puls Technologies Inc. Online Electronic Repair Service Products, Services, and Solutions
Table 54. Revenue (US$ Million) in Online Electronic Repair Service Business of Puls Technologies Inc. (2021–2026)
Table 55. Puls Technologies Inc. Recent Developments
Table 56. CellSavers Basic Information List
Table 57. CellSavers Description and Business Overview
Table 58. CellSavers Online Electronic Repair Service Products, Services, and Solutions
Table 59. Revenue (US$ Million) in Online Electronic Repair Service Business of CellSavers (2021–2026)
Table 60. CellSavers Recent Developments
Table 61. SquareTrade Basic Information List
Table 62. SquareTrade Description and Business Overview
Table 63. SquareTrade Online Electronic Repair Service Products, Services, and Solutions
Table 64. Revenue (US$ Million) in Online Electronic Repair Service Business of SquareTrade (2021–2026)
Table 65. SquareTrade Recent Developments
Table 66. CPR Cell Phone Repair Basic Information List
Table 67. CPR Cell Phone Repair Description and Business Overview
Table 68. CPR Cell Phone Repair Online Electronic Repair Service Products, Services, and Solutions
Table 69. Revenue (US$ Million) in Online Electronic Repair Service Business of CPR Cell Phone Repair (2021–2026)
Table 70. CPR Cell Phone Repair Recent Developments
Table 71. Batteries Plus Bulbs Basic Information List
Table 72. Batteries Plus Bulbs Description and Business Overview
Table 73. Batteries Plus Bulbs Online Electronic Repair Service Products, Services, and Solutions
Table 74. Revenue (US$ Million) in Online Electronic Repair Service Business of Batteries Plus Bulbs (2021–2026)
Table 75. Batteries Plus Bulbs Recent Developments
Table 76. Phone Medic Basic Information List
Table 77. Phone Medic Description and Business Overview
Table 78. Phone Medic Online Electronic Repair Service Products, Services, and Solutions
Table 79. Revenue (US$ Million) in Online Electronic Repair Service Business of Phone Medic (2021–2026)
Table 80. Phone Medic Recent Developments
Table 81. Geek Squad Basic Information List
Table 82. Geek Squad Description and Business Overview
Table 83. Geek Squad Online Electronic Repair Service Products, Services, and Solutions
Table 84. Revenue (US$ Million) in Online Electronic Repair Service Business of Geek Squad (2021–2026)
Table 85. Geek Squad Recent Developments
Table 86. iFixYouri Basic Information List
Table 87. iFixYouri Description and Business Overview
Table 88. iFixYouri Online Electronic Repair Service Products, Services, and Solutions
Table 89. Revenue (US$ Million) in Online Electronic Repair Service Business of iFixYouri (2021–2026)
Table 90. iFixYouri Recent Developments
Table 91. Quick Mobile Repair Basic Information List
Table 92. Quick Mobile Repair Description and Business Overview
Table 93. Quick Mobile Repair Online Electronic Repair Service Products, Services, and Solutions
Table 94. Revenue (US$ Million) in Online Electronic Repair Service Business of Quick Mobile Repair (2021–2026)
Table 95. Quick Mobile Repair Recent Developments
Table 96. iFixit Basic Information List
Table 97. iFixit Description and Business Overview
Table 98. iFixit Online Electronic Repair Service Products, Services, and Solutions
Table 99. Revenue (US$ Million) in Online Electronic Repair Service Business of iFixit (2021–2026)
Table 100. iFixit Recent Developments
Table 101. iResQ Basic Information List
Table 102. iResQ Description and Business Overview
Table 103. iResQ Online Electronic Repair Service Products, Services, and Solutions
Table 104. Revenue (US$ Million) in Online Electronic Repair Service Business of iResQ (2021–2026)
Table 105. iResQ Recent Developments
Table 106. MendMyi Basic Information List
Table 107. MendMyi Description and Business Overview
Table 108. MendMyi Online Electronic Repair Service Products, Services, and Solutions
Table 109. Revenue (US$ Million) in Online Electronic Repair Service Business of MendMyi (2021–2026)
Table 110. MendMyi Recent Developments
Table 111. Timeless Mobile Tech Basic Information List
Table 112. Timeless Mobile Tech Description and Business Overview
Table 113. Timeless Mobile Tech Online Electronic Repair Service Products, Services, and Solutions
Table 114. Revenue (US$ Million) in Online Electronic Repair Service Business of Timeless Mobile Tech (2021–2026)
Table 115. Timeless Mobile Tech Recent Developments
Table 116. Fix My Gadget Basic Information List
Table 117. Fix My Gadget Description and Business Overview
Table 118. Fix My Gadget Online Electronic Repair Service Products, Services, and Solutions
Table 119. Revenue (US$ Million) in Online Electronic Repair Service Business of Fix My Gadget (2021–2026)
Table 120. Fix My Gadget Recent Developments
Table 121. One Hour Device Repair Basic Information List
Table 122. One Hour Device Repair Description and Business Overview
Table 123. One Hour Device Repair Online Electronic Repair Service Products, Services, and Solutions
Table 124. Revenue (US$ Million) in Online Electronic Repair Service Business of One Hour Device Repair (2021–2026)
Table 125. One Hour Device Repair Recent Developments
Table 126. The Tech Know Space Basic Information List
Table 127. The Tech Know Space Description and Business Overview
Table 128. The Tech Know Space Online Electronic Repair Service Products, Services, and Solutions
Table 129. Revenue (US$ Million) in Online Electronic Repair Service Business of The Tech Know Space (2021–2026)
Table 130. The Tech Know Space Recent Developments
Table 131. Gophermods Basic Information List
Table 132. Gophermods Description and Business Overview
Table 133. Gophermods Online Electronic Repair Service Products, Services, and Solutions
Table 134. Revenue (US$ Million) in Online Electronic Repair Service Business of Gophermods (2021–2026)
Table 135. Gophermods Recent Developments
Table 136. Mission:Repair Basic Information List
Table 137. Mission:Repair Description and Business Overview
Table 138. Mission:Repair Online Electronic Repair Service Products, Services, and Solutions
Table 139. Revenue (US$ Million) in Online Electronic Repair Service Business of Mission:Repair (2021–2026)
Table 140. Mission:Repair Recent Developments
Table 141. SmartChoice Repair Center Basic Information List
Table 142. SmartChoice Repair Center Description and Business Overview
Table 143. SmartChoice Repair Center Online Electronic Repair Service Products, Services, and Solutions
Table 144. Revenue (US$ Million) in Online Electronic Repair Service Business of SmartChoice Repair Center (2021–2026)
Table 145. SmartChoice Repair Center Recent Developments
Table 146. Phone-ER Basic Information List
Table 147. Phone-ER Description and Business Overview
Table 148. Phone-ER Online Electronic Repair Service Products, Services, and Solutions
Table 149. Revenue (US$ Million) in Online Electronic Repair Service Business of Phone-ER (2021–2026)
Table 150. Phone-ER Recent Developments
Table 151. TechRestore Basic Information List
Table 152. TechRestore Description and Business Overview
Table 153. TechRestore Online Electronic Repair Service Products, Services, and Solutions
Table 154. Revenue (US$ Million) in Online Electronic Repair Service Business of TechRestore (2021–2026)
Table 155. TechRestore Recent Developments
Table 156. Jet City Device Repair Basic Information List
Table 157. Jet City Device Repair Description and Business Overview
Table 158. Jet City Device Repair Online Electronic Repair Service Products, Services, and Solutions
Table 159. Revenue (US$ Million) in Online Electronic Repair Service Business of Jet City Device Repair (2021–2026)
Table 160. Jet City Device Repair Recent Developments
Table 161. JCD Repair Basic Information List
Table 162. JCD Repair Description and Business Overview
Table 163. JCD Repair Online Electronic Repair Service Products, Services, and Solutions
Table 164. Revenue (US$ Million) in Online Electronic Repair Service Business of JCD Repair (2021–2026)
Table 165. JCD Repair Recent Developments
Table 166. Revenue (US$ Million) in Online Electronic Repair Service Business of Company 40 (2021–2026)
Table 167. Company 40 Recent Developments
Table 168. Key Raw Materials Lists
Table 169. Key Suppliers of Raw Materials Lists
Table 170. Online Electronic Repair Service Downstream Customers
Table 171. Online Electronic Repair Service Distributors List
Table 172. Research Programs/Design for This Report
Table 173. Key Data Information from Secondary Sources
Table 174. Key Data Information from Primary Sources
List of Figures
Figure 1. Online Electronic Repair Service Product Picture
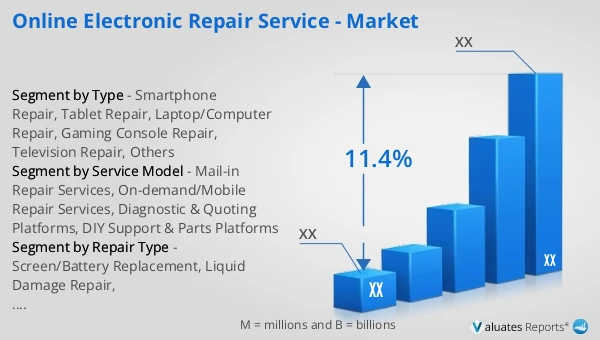
Figure 2. Global Online Electronic Repair Service Sales Value, 2021 vs 2025 vs 2032 (US$ Million)
Figure 3. Global Online Electronic Repair Service Sales Value (US$ Million), 2021–2032
Figure 4. Online Electronic Repair Service Report Years Considered
Figure 5. Global Online Electronic Repair Service Players Revenue Ranking (US$ Million), 2025
Figure 6. The 5 and 10 Largest Companies in the World: Market Share by Online Electronic Repair Service Revenue in 2025
Figure 7. Online Electronic Repair Service Market Share by Company Type (Tier 1, Tier 2, and Tier 3): 2021 vs 2025
Figure 8. Smartphone Repair Picture
Figure 9. Tablet Repair Picture
Figure 10. Laptop/Computer Repair Picture
Figure 11. Gaming Console Repair Picture
Figure 12. Television Repair Picture
Figure 13. Others Picture
Figure 14. Global Online Electronic Repair Service Sales Value by Type (US$ Million), 2021 vs 2025 vs 2032
Figure 15. Global Online Electronic Repair Service Sales Value Market Share by Type, 2025 & 2032
Figure 16. Mail-in Repair Services Picture
Figure 17. On-demand/Mobile Repair Services Picture
Figure 18. Diagnostic & Quoting Platforms Picture
Figure 19. DIY Support & Parts Platforms Picture
Figure 20. Global Online Electronic Repair Service Sales Value by Service Model (US$ Million), 2021 vs 2025 vs 2032
Figure 21. Global Online Electronic Repair Service Sales Value Market Share by Service Model, 2025 & 2032
Figure 22. Screen/Battery Replacement Picture
Figure 23. Liquid Damage Repair Picture
Figure 24. Component-level/Motherboard Repair Picture
Figure 25. Software & Diagnostic Services Picture
Figure 26. Global Online Electronic Repair Service Sales Value by Repair Type (US$ Million), 2021 vs 2025 vs 2032
Figure 27. Global Online Electronic Repair Service Sales Value Market Share by Repair Type, 2025 & 2032
Figure 28. Product Picture of Consumer Electronics Industry
Figure 29. Product Picture of Telecommunications Industry
Figure 30. Product Picture of IT Industry
Figure 31. Product Picture of Entertainment and Media Industry
Figure 32. Product Picture of Others
Figure 33. Global Online Electronic Repair Service Sales Value by Application (US$ Million), 2021 vs 2025 vs 2032
Figure 34. Global Online Electronic Repair Service Sales Value Market Share by Application, 2025 & 2032
Figure 35. North America Online Electronic Repair Service Sales Value (US$ Million), 2021–2032
Figure 36. North America Online Electronic Repair Service Sales Value by Country (%), 2025 vs 2032
Figure 37. Europe Online Electronic Repair Service Sales Value (US$ Million), 2021–2032
Figure 38. Europe Online Electronic Repair Service Sales Value by Country (%), 2025 vs 2032
Figure 39. Asia Pacific Online Electronic Repair Service Sales Value (US$ Million), 2021–2032
Figure 40. Asia Pacific Online Electronic Repair Service Sales Value by Subregion (%), 2025 vs 2032
Figure 41. South America Online Electronic Repair Service Sales Value (US$ Million), 2021–2032
Figure 42. South America Online Electronic Repair Service Sales Value by Country (%), 2025 vs 2032
Figure 43. Middle East & Africa Online Electronic Repair Service Sales Value (US$ Million), 2021–2032
Figure 44. Middle East & Africa Online Electronic Repair Service Sales Value by Country (%), 2025 vs 2032
Figure 45. Key Countries/Regions Online Electronic Repair Service Sales Value (%), 2021–2032
Figure 46. United States Online Electronic Repair Service Sales Value (US$ Million), 2021–2032
Figure 47. United States Online Electronic Repair Service Sales Value by Type (%), 2025 vs 2032
Figure 48. United States Online Electronic Repair Service Sales Value by Application (%), 2025 vs 2032
Figure 49. Europe Online Electronic Repair Service Sales Value (US$ Million), 2021–2032
Figure 50. Europe Online Electronic Repair Service Sales Value by Type (%), 2025 vs 2032
Figure 51. Europe Online Electronic Repair Service Sales Value by Application (%), 2025 vs 2032
Figure 52. China Online Electronic Repair Service Sales Value (US$ Million), 2021–2032
Figure 53. China Online Electronic Repair Service Sales Value by Type (%), 2025 vs 2032
Figure 54. China Online Electronic Repair Service Sales Value by Application (%), 2025 vs 2032
Figure 55. Japan Online Electronic Repair Service Sales Value (US$ Million), 2021–2032
Figure 56. Japan Online Electronic Repair Service Sales Value by Type (%), 2025 vs 2032
Figure 57. Japan Online Electronic Repair Service Sales Value by Application (%), 2025 vs 2032
Figure 58. South Korea Online Electronic Repair Service Sales Value (US$ Million), 2021–2032
Figure 59. South Korea Online Electronic Repair Service Sales Value by Type (%), 2025 vs 2032
Figure 60. South Korea Online Electronic Repair Service Sales Value by Application (%), 2025 vs 2032
Figure 61. Southeast Asia Online Electronic Repair Service Sales Value (US$ Million), 2021–2032
Figure 62. Southeast Asia Online Electronic Repair Service Sales Value by Type (%), 2025 vs 2032
Figure 63. Southeast Asia Online Electronic Repair Service Sales Value by Application (%), 2025 vs 2032
Figure 64. India Online Electronic Repair Service Sales Value (US$ Million), 2021–2032
Figure 65. India Online Electronic Repair Service Sales Value by Type (%), 2025 vs 2032
Figure 66. India Online Electronic Repair Service Sales Value by Application (%), 2025 vs 2032
Figure 67. Online Electronic Repair Service Value Chain
Figure 68. Online Electronic Repair Service Cost Structure
Figure 69. Channels of Distribution (Direct Sales, and Distribution)
Figure 70. Bottom-up and Top-down Approaches for This Report
Figure 71. Data Triangulation
Figure 72. Key Executives Interviewed