List of Tables
Table 1. Global Athleisure Products Market Size Growth Rate by Type (US$ Million): 2021 vs 2025 vs 2032
Table 2. Key Players of Footwear
Table 3. Key Players of Pants
Table 4. Key Players of Hats
Table 5. Key Players of Hoodies
Table 6. Key Players of Tops
Table 7. Key Players of Leggings
Table 8. Key Players of Shorts
Table 9. Global Athleisure Products Market Size Growth by Application (US$ Million): 2021 vs 2025 vs 2032
Table 10. Global Athleisure Products Market Size by Region (US$ Million): 2021 vs 2025 vs 2032
Table 11. Global Athleisure Products Market Size by Region (US$ Million), 2021–2026
Table 12. Global Athleisure Products Market Share by Region (2021–2026)
Table 13. Global Athleisure Products Forecasted Market Size by Region (US$ Million), 2027–2032
Table 14. Global Athleisure Products Market Share by Region (2027–2032)
Table 15. Athleisure Products Market Trends
Table 16. Athleisure Products Market Drivers
Table 17. Athleisure Products Market Challenges
Table 18. Athleisure Products Market Restraints
Table 19. Global Athleisure Products Revenue by Players (US$ Million), 2021–2026
Table 20. Global Athleisure Products Market Share by Players (2021–2026)
Table 21. Global Top Athleisure Products Players by Tier (Tier 1, Tier 2, and Tier 3), based on Athleisure Products Revenue, 2025
Table 22. Ranking of Global Top Athleisure Products Companies by Revenue (US$ Million) in 2025
Table 23. Global 5 Largest Players Market Share by Athleisure Products Revenue (CR5 and HHI), 2021–2026
Table 24. Global Key Players of Athleisure Products, Headquarters and Area Served
Table 25. Global Key Players of Athleisure Products, Products and Applications
Table 26. Global Key Players of Athleisure Products, Date of General Availability (GA)
Table 27. Mergers and Acquisitions, Expansion Plans
Table 28. Global Athleisure Products Market Size by Type (US$ Million), 2021–2026
Table 29. Global Athleisure Products Revenue Market Share by Type (2021–2026)
Table 30. Global Athleisure Products Forecasted Market Size by Type (US$ Million), 2027–2032
Table 31. Global Athleisure Products Revenue Market Share by Type (2027–2032)
Table 32. Global Athleisure Products Market Size by Application (US$ Million), 2021–2026
Table 33. Global Athleisure Products Revenue Market Share by Application (2021–2026)
Table 34. Global Athleisure Products Forecasted Market Size by Application (US$ Million), 2027–2032
Table 35. Global Athleisure Products Revenue Market Share by Application (2027–2032)
Table 36. North America Athleisure Products Market Size Growth Rate by Country (US$ Million): 2021 vs 2025 vs 2032
Table 37. North America Athleisure Products Market Size by Country (US$ Million), 2021–2026
Table 38. North America Athleisure Products Market Size by Country (US$ Million), 2027–2032
Table 39. Europe Athleisure Products Market Size Growth Rate by Country (US$ Million): 2021 vs 2025 vs 2032
Table 40. Europe Athleisure Products Market Size by Country (US$ Million), 2021–2026
Table 41. Europe Athleisure Products Market Size by Country (US$ Million), 2027–2032
Table 42. Asia-Pacific Athleisure Products Market Size Growth Rate by Region (US$ Million): 2021 vs 2025 vs 2032
Table 43. Asia-Pacific Athleisure Products Market Size by Region (US$ Million), 2021–2026
Table 44. Asia-Pacific Athleisure Products Market Size by Region (US$ Million), 2027–2032
Table 45. Latin America Athleisure Products Market Size Growth Rate by Country (US$ Million): 2021 vs 2025 vs 2032
Table 46. Latin America Athleisure Products Market Size by Country (US$ Million), 2021–2026
Table 47. Latin America Athleisure Products Market Size by Country (US$ Million), 2027–2032
Table 48. Middle East & Africa Athleisure Products Market Size Growth Rate by Country (US$ Million): 2021 vs 2025 vs 2032
Table 49. Middle East & Africa Athleisure Products Market Size by Country (US$ Million), 2021–2026
Table 50. Middle East & Africa Athleisure Products Market Size by Country (US$ Million), 2027–2032
Table 51. Adidas Company Details
Table 52. Adidas Business Overview
Table 53. Adidas Athleisure Products Product
Table 54. Adidas Revenue in Athleisure Products Business (US$ Million), 2021–2026
Table 55. Adidas Recent Development
Table 56. Sweaty Betty Company Details
Table 57. Sweaty Betty Business Overview
Table 58. Sweaty Betty Athleisure Products Product
Table 59. Sweaty Betty Revenue in Athleisure Products Business (US$ Million), 2021–2026
Table 60. Sweaty Betty Recent Development
Table 61. Nike Company Details
Table 62. Nike Business Overview
Table 63. Nike Athleisure Products Product
Table 64. Nike Revenue in Athleisure Products Business (US$ Million), 2021–2026
Table 65. Nike Recent Development
Table 66. Lululemon Company Details
Table 67. Lululemon Business Overview
Table 68. Lululemon Athleisure Products Product
Table 69. Lululemon Revenue in Athleisure Products Business (US$ Million), 2021–2026
Table 70. Lululemon Recent Development
Table 71. Alala Company Details
Table 72. Alala Business Overview
Table 73. Alala Athleisure Products Product
Table 74. Alala Revenue in Athleisure Products Business (US$ Million), 2021–2026
Table 75. Alala Recent Development
Table 76. Puma Company Details
Table 77. Puma Business Overview
Table 78. Puma Athleisure Products Product
Table 79. Puma Revenue in Athleisure Products Business (US$ Million), 2021–2026
Table 80. Puma Recent Development
Table 81. Under Armour Company Details
Table 82. Under Armour Business Overview
Table 83. Under Armour Athleisure Products Product
Table 84. Under Armour Revenue in Athleisure Products Business (US$ Million), 2021–2026
Table 85. Under Armour Recent Development
Table 86. Tory Sport Company Details
Table 87. Tory Sport Business Overview
Table 88. Tory Sport Athleisure Products Product
Table 89. Tory Sport Revenue in Athleisure Products Business (US$ Million), 2021–2026
Table 90. Tory Sport Recent Development
Table 91. Girlfriend Collective Company Details
Table 92. Girlfriend Collective Business Overview
Table 93. Girlfriend Collective Athleisure Products Product
Table 94. Girlfriend Collective Revenue in Athleisure Products Business (US$ Million), 2021–2026
Table 95. Girlfriend Collective Recent Development
Table 96. Athleta (Gap Inc.) Company Details
Table 97. Athleta (Gap Inc.) Business Overview
Table 98. Athleta (Gap Inc.) Athleisure Products Product
Table 99. Athleta (Gap Inc.) Revenue in Athleisure Products Business (US$ Million), 2021–2026
Table 100. Athleta (Gap Inc.) Recent Development
Table 101. Uniqlo Company Details
Table 102. Uniqlo Business Overview
Table 103. Uniqlo Athleisure Products Product
Table 104. Uniqlo Revenue in Athleisure Products Business (US$ Million), 2021–2026
Table 105. Uniqlo Recent Development
Table 106. Olivers Apparel Company Details
Table 107. Olivers Apparel Business Overview
Table 108. Olivers Apparel Athleisure Products Product
Table 109. Olivers Apparel Revenue in Athleisure Products Business (US$ Million), 2021–2026
Table 110. Olivers Apparel Recent Development
Table 111. Unbridled Apparel Company Details
Table 112. Unbridled Apparel Business Overview
Table 113. Unbridled Apparel Athleisure Products Product
Table 114. Unbridled Apparel Revenue in Athleisure Products Business (US$ Million), 2021–2026
Table 115. Unbridled Apparel Recent Development
Table 116. Lysse Company Details
Table 117. Lysse Business Overview
Table 118. Lysse Athleisure Products Product
Table 119. Lysse Revenue in Athleisure Products Business (US$ Million), 2021–2026
Table 120. Lysse Recent Development
Table 121. Ultracor Company Details
Table 122. Ultracor Business Overview
Table 123. Ultracor Athleisure Products Product
Table 124. Ultracor Revenue in Athleisure Products Business (US$ Million), 2021–2026
Table 125. Ultracor Recent Development
Table 126. Alo Yoga Company Details
Table 127. Alo Yoga Business Overview
Table 128. Alo Yoga Athleisure Products Product
Table 129. Alo Yoga Revenue in Athleisure Products Business (US$ Million), 2021–2026
Table 130. Alo Yoga Recent Development
Table 131. Vuori Company Details
Table 132. Vuori Business Overview
Table 133. Vuori Athleisure Products Product
Table 134. Vuori Revenue in Athleisure Products Business (US$ Million), 2021–2026
Table 135. Vuori Recent Development
Table 136. Rhone Apparel Company Details
Table 137. Rhone Apparel Business Overview
Table 138. Rhone Apparel Athleisure Products Product
Table 139. Rhone Apparel Revenue in Athleisure Products Business (US$ Million), 2021–2026
Table 140. Rhone Apparel Recent Development
Table 141. Research Programs/Design for This Report
Table 142. Key Data Information from Secondary Sources
Table 143. Key Data Information from Primary Sources
Table 144. Authors List of This Report
List of Figures
Figure 1. Athleisure Products Picture
Figure 2. Global Athleisure Products Market Size Comparison by Type (US$ Million), 2021–2032
Figure 3. Global Athleisure Products Market Share by Type: 2025 vs 2032
Figure 4. Footwear Features
Figure 5. Pants Features
Figure 6. Hats Features
Figure 7. Hoodies Features
Figure 8. Tops Features
Figure 9. Leggings Features
Figure 10. Shorts Features
Figure 11. Jackets Features
Figure 12. Others Features
Figure 13. Global Athleisure Products Market Size by Application (US$ Million), 2021–2032
Figure 14. Global Athleisure Products Market Share by Application: 2025 vs 2032
Figure 15. Men Case Studies
Figure 16. Women Case Studies
Figure 17. Children Case Studies
Figure 18. Athleisure Products Report Years Considered
Figure 19. Global Athleisure Products Market Size (US$ Million), Year-over-Year: 2021–2032
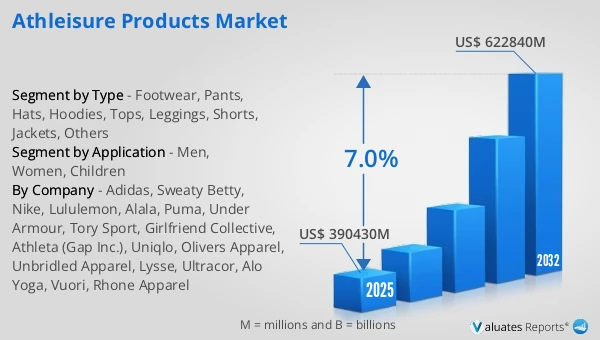
Figure 20. Global Athleisure Products Market Size, (US$ Million), 2021 vs 2025 vs 2032
Figure 21. Global Athleisure Products Market Share by Region: 2025 vs 2032
Figure 22. Global Athleisure Products Market Share by Players in 2025
Figure 23. Global Athleisure Products Market Share by Company Type (Tier 1, Tier 2, and Tier 3)
Figure 24. The Top 10 and 5 Players Market Share by Athleisure Products Revenue in 2025
Figure 25. North America Athleisure Products Market Size YoY Growth (US$ Million), 2021–2032
Figure 26. North America Athleisure Products Market Share by Country (2021–2032)
Figure 27. United States Athleisure Products Market Size YoY Growth (US$ Million), 2021–2032
Figure 28. Canada Athleisure Products Market Size YoY Growth (US$ Million), 2021–2032
Figure 29. Europe Athleisure Products Market Size YoY Growth (US$ Million), 2021–2032
Figure 30. Europe Athleisure Products Market Share by Country (2021–2032)
Figure 31. Germany Athleisure Products Market Size YoY Growth (US$ Million), 2021–2032
Figure 32. France Athleisure Products Market Size YoY Growth (US$ Million), 2021–2032
Figure 33. U.K. Athleisure Products Market Size YoY Growth (US$ Million), 2021–2032
Figure 34. Italy Athleisure Products Market Size YoY Growth (US$ Million), 2021–2032
Figure 35. Russia Athleisure Products Market Size YoY Growth (US$ Million), 2021–2032
Figure 36. Ireland Athleisure Products Market Size YoY Growth (US$ Million), 2021–2032
Figure 37. Asia-Pacific Athleisure Products Market Size YoY Growth (US$ Million), 2021–2032
Figure 38. Asia-Pacific Athleisure Products Market Share by Region (2021–2032)
Figure 39. China Athleisure Products Market Size YoY Growth (US$ Million), 2021–2032
Figure 40. Japan Athleisure Products Market Size YoY Growth (US$ Million), 2021–2032
Figure 41. South Korea Athleisure Products Market Size YoY Growth (US$ Million), 2021–2032
Figure 42. Southeast Asia Athleisure Products Market Size YoY Growth (US$ Million), 2021–2032
Figure 43. India Athleisure Products Market Size YoY Growth (US$ Million), 2021–2032
Figure 44. Australia & New Zealand Athleisure Products Market Size YoY Growth (US$ Million), 2021–2032
Figure 45. Latin America Athleisure Products Market Size YoY Growth (US$ Million), 2021–2032
Figure 46. Latin America Athleisure Products Market Share by Country (2021–2032)
Figure 47. Mexico Athleisure Products Market Size YoY Growth (US$ Million), 2021–2032
Figure 48. Brazil Athleisure Products Market Size YoY Growth (US$ Million), 2021–2032
Figure 49. Middle East & Africa Athleisure Products Market Size YoY Growth (US$ Million), 2021–2032
Figure 50. Middle East & Africa Athleisure Products Market Share by Country (2021–2032)
Figure 51. Israel Athleisure Products Market Size YoY Growth (US$ Million), 2021–2032
Figure 52. Saudi Arabia Athleisure Products Market Size YoY Growth (US$ Million), 2021–2032
Figure 53. UAE Athleisure Products Market Size YoY Growth (US$ Million), 2021–2032
Figure 54. Adidas Revenue Growth Rate in Athleisure Products Business (2021–2026)
Figure 55. Sweaty Betty Revenue Growth Rate in Athleisure Products Business (2021–2026)
Figure 56. Nike Revenue Growth Rate in Athleisure Products Business (2021–2026)
Figure 57. Lululemon Revenue Growth Rate in Athleisure Products Business (2021–2026)
Figure 58. Alala Revenue Growth Rate in Athleisure Products Business (2021–2026)
Figure 59. Puma Revenue Growth Rate in Athleisure Products Business (2021–2026)
Figure 60. Under Armour Revenue Growth Rate in Athleisure Products Business (2021–2026)
Figure 61. Tory Sport Revenue Growth Rate in Athleisure Products Business (2021–2026)
Figure 62. Girlfriend Collective Revenue Growth Rate in Athleisure Products Business (2021–2026)
Figure 63. Athleta (Gap Inc.) Revenue Growth Rate in Athleisure Products Business (2021–2026)
Figure 64. Uniqlo Revenue Growth Rate in Athleisure Products Business (2021–2026)
Figure 65. Olivers Apparel Revenue Growth Rate in Athleisure Products Business (2021–2026)
Figure 66. Unbridled Apparel Revenue Growth Rate in Athleisure Products Business (2021–2026)
Figure 67. Lysse Revenue Growth Rate in Athleisure Products Business (2021–2026)
Figure 68. Ultracor Revenue Growth Rate in Athleisure Products Business (2021–2026)
Figure 69. Alo Yoga Revenue Growth Rate in Athleisure Products Business (2021–2026)
Figure 70. Vuori Revenue Growth Rate in Athleisure Products Business (2021–2026)
Figure 71. Rhone Apparel Revenue Growth Rate in Athleisure Products Business (2021–2026)
Figure 72. Bottom-up and Top-down Approaches for This Report
Figure 73. Data Triangulation
Figure 74. Key Executives Interviewed