List of Tables
Table 1. Ceramic Substrate (Metallized) CAGR in Value, India VS Global, 2018 VS 2022 VS 2029
Table 2. Ceramic Substrate (Metallized) Market Trends
Table 3. Ceramic Substrate (Metallized) Market Drivers
Table 4. Ceramic Substrate (Metallized) Market Challenges
Table 5. Ceramic Substrate (Metallized) Market Restraints
Table 6. Global Ceramic Substrate (Metallized) Sales Growth Rate (CAGR) by Material: 2018 VS 2022 VS 2029 (US$ Million)
Table 7. India Ceramic Substrate (Metallized) Sales Growth Rate (CAGR) by Material: 2018 VS 2022 VS 2029 (US$ Million)
Table 8. Global Ceramic Substrate (Metallized) Sales Growth Rate (CAGR) by Application: 2018 VS 2022 VS 2029 (US$ Million)
Table 9. India Ceramic Substrate (Metallized) Sales Growth Rate (CAGR) by Application: 2018 VS 2022 VS 2029 (US$ Million)
Table 10. Global Key Manufacturers of Ceramic Substrate (Metallized), Ranked by Revenue (2022) & (US$ Million)
Table 11. Global Ceramic Substrate (Metallized) Revenue by Manufacturer, (US$ Million), 2018-2023
Table 12. Global Ceramic Substrate (Metallized) Revenue Share by Manufacturer, 2018-2023
Table 13. Global Ceramic Substrate (Metallized) Sales by Manufacturer, (K Sqm), 2018-2023
Table 14. Global Ceramic Substrate (Metallized) Sales Share by Manufacturer, 2018-2023
Table 15. Global Ceramic Substrate (Metallized) Price by Manufacturer (2018-2023) & (USD/Sqm)
Table 16. Global Ceramic Substrate (Metallized) Manufacturers Market Concentration Ratio (CR5 and HHI)
Table 17. Global Ceramic Substrate (Metallized) by Company Type (Tier 1, Tier 2, and Tier 3) & (based on the Revenue in Ceramic Substrate (Metallized) as of 2022)
Table 18. Global Key Manufacturers of Ceramic Substrate (Metallized), Manufacturing Base Distribution and Headquarters
Table 19. Global Key Manufacturers of Ceramic Substrate (Metallized), Product Offered and Application
Table 20. Global Key Manufacturers of Ceramic Substrate (Metallized), Date of Enter into This Industry
Table 21. Manufacturers Mergers & Acquisitions, Expansion Plans
Table 22. Key Players of Ceramic Substrate (Metallized) in India, Ranked by Revenue (2022) & (US$ million)
Table 23. India Ceramic Substrate (Metallized) Revenue by Players, (US$ Million), (2018-2023)
Table 24. India Ceramic Substrate (Metallized) Revenue Share by Players, (2018-2023)
Table 25. India Ceramic Substrate (Metallized) Sales by Players, (K Sqm), (2018-2023)
Table 26. India Ceramic Substrate (Metallized) Sales Share by Players, (2018-2023)
Table 27. Global Ceramic Substrate (Metallized) Market Size Growth Rate (CAGR) by Region (US$ Million): 2018 VS 2022 VS 2029
Table 28. Global Ceramic Substrate (Metallized) Sales in Volume by Region (2018-2023) & (K Sqm)
Table 29. Global Ceramic Substrate (Metallized) Sales in Volume Forecast by Region (2024-2029) & (K Sqm)
Table 30. Global Ceramic Substrate (Metallized) Sales in Value by Region (2018-2023) & (US$ Million)
Table 31. Global Ceramic Substrate (Metallized) Sales in Value Forecast by Region (2024-2029) & (US$ Million)
Table 32. Americas Ceramic Substrate (Metallized) Market Size Growth Rate (CAGR) by Country (US$ Million): 2018 VS 2022 VS 2029
Table 33. Americas Ceramic Substrate (Metallized) Sales in Value by Country (2018-2023) & (US$ Million)
Table 34. Americas Ceramic Substrate (Metallized) Sales in Value by Country (2024-2029) & (US$ Million)
Table 35. Americas Ceramic Substrate (Metallized) Sales in Volume by Country (2018-2023) & (K Sqm)
Table 36. Americas Ceramic Substrate (Metallized) Sales in Volume by Country (2024-2029) & (K Sqm)
Table 37. EMEA Ceramic Substrate (Metallized) Market Size Growth Rate (CAGR) by Country (US$ Million): 2018 VS 2022 VS 2029
Table 38. EMEA Ceramic Substrate (Metallized) Sales in Value by Country (2018-2023) & (US$ Million)
Table 39. EMEA Ceramic Substrate (Metallized) Sales in Value by Country (2024-2029) & (US$ Million)
Table 40. EMEA Ceramic Substrate (Metallized) Sales in Volume by Country (2018-2023) & (K Sqm)
Table 41. EMEA Ceramic Substrate (Metallized) Sales in Volume by Country (2024-2029) & (K Sqm)
Table 42. APAC Ceramic Substrate (Metallized) Market Size Growth Rate (CAGR) by Country (US$ Million): 2018 VS 2022 VS 2029
Table 43. APAC Ceramic Substrate (Metallized) Sales in Value by Country (2018-2023) & (US$ Million)
Table 44. APAC Ceramic Substrate (Metallized) Sales in Value by Country (2024-2029) & (US$ Million)
Table 45. APAC Ceramic Substrate (Metallized) Sales in Volume by Country (2018-2023) & (K Sqm)
Table 46. APAC Ceramic Substrate (Metallized) Sales in Volume by Country (2024-2029) & (K Sqm)
Table 47. Rogers Corporation Company Information
Table 48. Rogers Corporation Description and Business Overview
Table 49. Rogers Corporation Ceramic Substrate (Metallized) Sales (K Sqm), Revenue (US$ Million), Price (USD/Sqm) and Gross Margin (2018-2023)
Table 50. Rogers Corporation Ceramic Substrate (Metallized) Product
Table 51. Rogers Corporation Recent Development
Table 52. Heraeus Electronics Company Information
Table 53. Heraeus Electronics Description and Business Overview
Table 54. Heraeus Electronics Ceramic Substrate (Metallized) Sales (K Sqm), Revenue (US$ Million), Price (USD/Sqm) and Gross Margin (2018-2023)
Table 55. Heraeus Electronics Ceramic Substrate (Metallized) Product
Table 56. Heraeus Electronics Recent Development
Table 57. Kyocera Company Information
Table 58. Kyocera Description and Business Overview
Table 59. Kyocera Ceramic Substrate (Metallized) Sales (K Sqm), Revenue (US$ Million), Price (USD/Sqm) and Gross Margin (2018-2023)
Table 60. Kyocera Ceramic Substrate (Metallized) Product
Table 61. Kyocera Recent Development
Table 62. NGK Electronics Devices Company Information
Table 63. NGK Electronics Devices Description and Business Overview
Table 64. NGK Electronics Devices Ceramic Substrate (Metallized) Sales (K Sqm), Revenue (US$ Million), Price (USD/Sqm) and Gross Margin (2018-2023)
Table 65. NGK Electronics Devices Ceramic Substrate (Metallized) Product
Table 66. NGK Electronics Devices Recent Development
Table 67. Toshiba Materials Company Information
Table 68. Toshiba Materials Description and Business Overview
Table 69. Toshiba Materials Ceramic Substrate (Metallized) Sales (K Sqm), Revenue (US$ Million), Price (USD/Sqm) and Gross Margin (2018-2023)
Table 70. Toshiba Materials Ceramic Substrate (Metallized) Product
Table 71. Toshiba Materials Recent Development
Table 72. Denka Company Information
Table 73. Denka Description and Business Overview
Table 74. Denka Ceramic Substrate (Metallized) Sales (K Sqm), Revenue (US$ Million), Price (USD/Sqm) and Gross Margin (2018-2023)
Table 75. Denka Ceramic Substrate (Metallized) Product
Table 76. Denka Recent Development
Table 77. DOWA METALTECH Company Information
Table 78. DOWA METALTECH Description and Business Overview
Table 79. DOWA METALTECH Ceramic Substrate (Metallized) Sales (K Sqm), Revenue (US$ Million), Price (USD/Sqm) and Gross Margin (2018-2023)
Table 80. DOWA METALTECH Ceramic Substrate (Metallized) Product
Table 81. DOWA METALTECH Recent Development
Table 82. KCC Company Information
Table 83. KCC Description and Business Overview
Table 84. KCC Ceramic Substrate (Metallized) Sales (K Sqm), Revenue (US$ Million), Price (USD/Sqm) and Gross Margin (2018-2023)
Table 85. KCC Ceramic Substrate (Metallized) Product
Table 86. KCC Recent Development
Table 87. Amogreentech Company Information
Table 88. Amogreentech Description and Business Overview
Table 89. Amogreentech Ceramic Substrate (Metallized) Sales (K Sqm), Revenue (US$ Million), Price (USD/Sqm) and Gross Margin (2018-2023)
Table 90. Amogreentech Ceramic Substrate (Metallized) Product
Table 91. Amogreentech Recent Development
Table 92. Ferrotec Company Information
Table 93. Ferrotec Description and Business Overview
Table 94. Ferrotec Ceramic Substrate (Metallized) Sales (K Sqm), Revenue (US$ Million), Price (USD/Sqm) and Gross Margin (2018-2023)
Table 95. Ferrotec Ceramic Substrate (Metallized) Product
Table 96. Ferrotec Recent Development
Table 97. BYD Company Information
Table 98. BYD Description and Business Overview
Table 99. BYD Ceramic Substrate (Metallized) Sales (K Sqm), Revenue (US$ Million), Price (USD/Sqm) and Gross Margin (2018-2023)
Table 100. BYD Ceramic Substrate (Metallized) Product
Table 101. BYD Recent Development
Table 102. Shenzhen Xinzhou Electronic Technology Company Information
Table 103. Shenzhen Xinzhou Electronic Technology Description and Business Overview
Table 104. Shenzhen Xinzhou Electronic Technology Ceramic Substrate (Metallized) Sales (K Sqm), Revenue (US$ Million), Price (USD/Sqm) and Gross Margin (2018-2023)
Table 105. Shenzhen Xinzhou Electronic Technology Ceramic Substrate (Metallized) Product
Table 106. Shenzhen Xinzhou Electronic Technology Recent Development
Table 107. Zhejiang TC Ceramic Electronic Company Information
Table 108. Zhejiang TC Ceramic Electronic Description and Business Overview
Table 109. Zhejiang TC Ceramic Electronic Ceramic Substrate (Metallized) Sales (K Sqm), Revenue (US$ Million), Price (USD/Sqm) and Gross Margin (2018-2023)
Table 110. Zhejiang TC Ceramic Electronic Ceramic Substrate (Metallized) Product
Table 111. Zhejiang TC Ceramic Electronic Recent Development
Table 112. Shengda Tech Company Information
Table 113. Shengda Tech Description and Business Overview
Table 114. Shengda Tech Ceramic Substrate (Metallized) Sales (K Sqm), Revenue (US$ Million), Price (USD/Sqm) and Gross Margin (2018-2023)
Table 115. Shengda Tech Ceramic Substrate (Metallized) Product
Table 116. Shengda Tech Recent Development
Table 117. Beijing Moshi Technology Company Information
Table 118. Beijing Moshi Technology Description and Business Overview
Table 119. Beijing Moshi Technology Ceramic Substrate (Metallized) Sales (K Sqm), Revenue (US$ Million), Price (USD/Sqm) and Gross Margin (2018-2023)
Table 120. Beijing Moshi Technology Ceramic Substrate (Metallized) Product
Table 121. Beijing Moshi Technology Recent Development
Table 122. Nantong Winspower Company Information
Table 123. Nantong Winspower Description and Business Overview
Table 124. Nantong Winspower Ceramic Substrate (Metallized) Sales (K Sqm), Revenue (US$ Million), Price (USD/Sqm) and Gross Margin (2018-2023)
Table 125. Nantong Winspower Ceramic Substrate (Metallized) Product
Table 126. Nantong Winspower Recent Development
Table 127. Wuxi Tianyang Electronics Company Information
Table 128. Wuxi Tianyang Electronics Description and Business Overview
Table 129. Wuxi Tianyang Electronics Ceramic Substrate (Metallized) Sales (K Sqm), Revenue (US$ Million), Price (USD/Sqm) and Gross Margin (2018-2023)
Table 130. Wuxi Tianyang Electronics Ceramic Substrate (Metallized) Product
Table 131. Wuxi Tianyang Electronics Recent Development
Table 132. Nanjing Zhongjiang New Material Science & Technology Company Information
Table 133. Nanjing Zhongjiang New Material Science & Technology Description and Business Overview
Table 134. Nanjing Zhongjiang New Material Science & Technology Ceramic Substrate (Metallized) Sales (K Sqm), Revenue (US$ Million), Price (USD/Sqm) and Gross Margin (2018-2023)
Table 135. Nanjing Zhongjiang New Material Science & Technology Ceramic Substrate (Metallized) Product
Table 136. Nanjing Zhongjiang New Material Science & Technology Recent Development
Table 137. Littelfuse IXYS Company Information
Table 138. Littelfuse IXYS Description and Business Overview
Table 139. Littelfuse IXYS Ceramic Substrate (Metallized) Sales (K Sqm), Revenue (US$ Million), Price (USD/Sqm) and Gross Margin (2018-2023)
Table 140. Littelfuse IXYS Ceramic Substrate (Metallized) Product
Table 141. Littelfuse IXYS Recent Development
Table 142. Remtec Company Information
Table 143. Remtec Description and Business Overview
Table 144. Remtec Ceramic Substrate (Metallized) Sales (K Sqm), Revenue (US$ Million), Price (USD/Sqm) and Gross Margin (2018-2023)
Table 145. Remtec Ceramic Substrate (Metallized) Product
Table 146. Remtec Recent Development
Table 147. Stellar Industries Corp Company Information
Table 148. Stellar Industries Corp Description and Business Overview
Table 149. Stellar Industries Corp Ceramic Substrate (Metallized) Sales (K Sqm), Revenue (US$ Million), Price (USD/Sqm) and Gross Margin (2018-2023)
Table 150. Stellar Industries Corp Ceramic Substrate (Metallized) Product
Table 151. Stellar Industries Corp Recent Development
Table 152. Tong Hsing (acquired HCS) Company Information
Table 153. Tong Hsing (acquired HCS) Description and Business Overview
Table 154. Tong Hsing (acquired HCS) Ceramic Substrate (Metallized) Sales (K Sqm), Revenue (US$ Million), Price (USD/Sqm) and Gross Margin (2018-2023)
Table 155. Tong Hsing (acquired HCS) Ceramic Substrate (Metallized) Product
Table 156. Tong Hsing (acquired HCS) Recent Development
Table 157. Zibo Linzi Yinhe High-Tech Development Company Information
Table 158. Zibo Linzi Yinhe High-Tech Development Description and Business Overview
Table 159. Zibo Linzi Yinhe High-Tech Development Ceramic Substrate (Metallized) Sales (K Sqm), Revenue (US$ Million), Price (USD/Sqm) and Gross Margin (2018-2023)
Table 160. Zibo Linzi Yinhe High-Tech Development Ceramic Substrate (Metallized) Product
Table 161. Zibo Linzi Yinhe High-Tech Development Recent Development
Table 162. Chengdu Wanshida Ceramic Industry Company Information
Table 163. Chengdu Wanshida Ceramic Industry Description and Business Overview
Table 164. Chengdu Wanshida Ceramic Industry Ceramic Substrate (Metallized) Sales (K Sqm), Revenue (US$ Million), Price (USD/Sqm) and Gross Margin (2018-2023)
Table 165. Chengdu Wanshida Ceramic Industry Ceramic Substrate (Metallized) Product
Table 166. Chengdu Wanshida Ceramic Industry Recent Development
Table 167. Tong Hsing Company Information
Table 168. Tong Hsing Description and Business Overview
Table 169. Tong Hsing Ceramic Substrate (Metallized) Sales (K Sqm), Revenue (US$ Million), Price (USD/Sqm) and Gross Margin (2018-2023)
Table 170. Tong Hsing Ceramic Substrate (Metallized) Product
Table 171. Tong Hsing Recent Development
Table 172. ICP Technology Company Information
Table 173. ICP Technology Description and Business Overview
Table 174. ICP Technology Ceramic Substrate (Metallized) Sales (K Sqm), Revenue (US$ Million), Price (USD/Sqm) and Gross Margin (2018-2023)
Table 175. ICP Technology Ceramic Substrate (Metallized) Product
Table 176. ICP Technology Recent Development
Table 177. Ecocera Company Information
Table 178. Ecocera Description and Business Overview
Table 179. Ecocera Ceramic Substrate (Metallized) Sales (K Sqm), Revenue (US$ Million), Price (USD/Sqm) and Gross Margin (2018-2023)
Table 180. Ecocera Ceramic Substrate (Metallized) Product
Table 181. Ecocera Recent Development
Table 182. Tensky (Xellatech) Company Information
Table 183. Tensky (Xellatech) Description and Business Overview
Table 184. Tensky (Xellatech) Ceramic Substrate (Metallized) Sales (K Sqm), Revenue (US$ Million), Price (USD/Sqm) and Gross Margin (2018-2023)
Table 185. Tensky (Xellatech) Ceramic Substrate (Metallized) Product
Table 186. Tensky (Xellatech) Recent Development
Table 187. Ceratron Electric Company Information
Table 188. Ceratron Electric Description and Business Overview
Table 189. Ceratron Electric Ceramic Substrate (Metallized) Sales (K Sqm), Revenue (US$ Million), Price (USD/Sqm) and Gross Margin (2018-2023)
Table 190. Ceratron Electric Ceramic Substrate (Metallized) Product
Table 191. Ceratron Electric Recent Development
Table 192. Wuhan Lizhida Technology Company Information
Table 193. Wuhan Lizhida Technology Description and Business Overview
Table 194. Wuhan Lizhida Technology Ceramic Substrate (Metallized) Sales (K Sqm), Revenue (US$ Million), Price (USD/Sqm) and Gross Margin (2018-2023)
Table 195. Wuhan Lizhida Technology Ceramic Substrate (Metallized) Product
Table 196. Wuhan Lizhida Technology Recent Development
Table 197. Folysky Technology(Wuhan) Details
Table 198. Zhuhai Hanci Jingmi Details
Table 199. Meizhou Zhanzhi Electronic Technology Details
Table 200. Huizhou Xinci Semiconductor Details
Table 201. Yiyang Smuyang Electronic Technology Details
Table 202. Shenzhen Yuan Xuci Electronic Technology Details
Table 203. SinoVio Semiconductor Technol Details
Table 204. Suzhou GYZ Electronic Technology Details
Table 205. Key Raw Materials Lists
Table 206. Raw Materials Key Suppliers Lists
Table 207. Ceramic Substrate (Metallized) Customers List
Table 208. Ceramic Substrate (Metallized) Distributors List
Table 209. Research Programs/Design for This Report
Table 210. Key Data Information from Secondary Sources
Table 211. Key Data Information from Primary Sources
List of Figures
Figure 1. Ceramic Substrate (Metallized) Product Picture
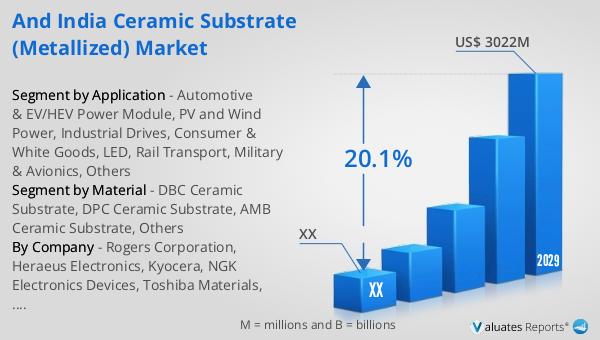
Figure 2. Global Ceramic Substrate (Metallized) Revenue, (US$ Million), 2018 VS 2022 VS 2029
Figure 3. Global Ceramic Substrate (Metallized) Market Size 2018-2029 (US$ Million)
Figure 4. Global Ceramic Substrate (Metallized) Sales 2018-2029 (K Sqm)
Figure 5. India Ceramic Substrate (Metallized) Revenue, (US$ Million), 2018 VS 2022 VS 2029
Figure 6. India Ceramic Substrate (Metallized) Market Size 2018-2029 (US$ Million)
Figure 7. India Ceramic Substrate (Metallized) Sales 2018-2029 (K Sqm)
Figure 8. India Ceramic Substrate (Metallized) Market Share in Global, in Value (US$ Million) 2018-2029
Figure 9. India Ceramic Substrate (Metallized) Market Share in Global, in Volume (K Sqm) 2018-2029
Figure 10. Ceramic Substrate (Metallized) Report Years Considered
Figure 11. Product Picture of DBC Ceramic Substrate
Figure 12. Product Picture of DPC Ceramic Substrate
Figure 13. Product Picture of AMB Ceramic Substrate
Figure 14. Product Picture of Others
Figure 15. Global Ceramic Substrate (Metallized) Market Share by Material in 2022 & 2029
Figure 16. Global Ceramic Substrate (Metallized) Sales in Value by Material (2018-2029) & (US$ Million)
Figure 17. Global Ceramic Substrate (Metallized) Sales Market Share in Value by Material (2018-2029)
Figure 18. Global Ceramic Substrate (Metallized) Sales by Material (2018-2029) & (K Sqm)
Figure 19. Global Ceramic Substrate (Metallized) Sales Market Share in Volume by Material (2018-2029)
Figure 20. Global Ceramic Substrate (Metallized) Price by Material (2018-2029) & (USD/Sqm)
Figure 21. India Ceramic Substrate (Metallized) Market Share by Material in 2022 & 2029
Figure 22. India Ceramic Substrate (Metallized) Sales in Value by Material (2018-2029) & (US$ Million)
Figure 23. India Ceramic Substrate (Metallized) Sales Market Share in Value by Material (2018-2029)
Figure 24. India Ceramic Substrate (Metallized) Sales by Material (2018-2029) & (K Sqm)
Figure 25. India Ceramic Substrate (Metallized) Sales Market Share in Volume by Material (2018-2029)
Figure 26. India Ceramic Substrate (Metallized) Price by Material (2018-2029) & (USD/Sqm)
Figure 27. Product Picture of Automotive & EV/HEV Power Module
Figure 28. Product Picture of PV and Wind Power
Figure 29. Product Picture of Industrial Drives
Figure 30. Product Picture of Consumer & White Goods
Figure 31. Product Picture of LED
Figure 32. Product Picture of Rail Transport
Figure 33. Product Picture of Military & Avionics
Figure 34. Product Picture of Others
Figure 35. Global Ceramic Substrate (Metallized) Market Share by Application in 2022 & 2029
Figure 36. Global Ceramic Substrate (Metallized) Sales in Value by Application (2018-2029) & (US$ Million)
Figure 37. Global Ceramic Substrate (Metallized) Sales Market Share in Value by Application (2018-2029)
Figure 38. Global Ceramic Substrate (Metallized) Sales by Application (2018-2029) & (K Sqm)
Figure 39. Global Ceramic Substrate (Metallized) Sales Market Share in Volume by Application (2018-2029)
Figure 40. Global Ceramic Substrate (Metallized) Price by Application (2018-2029) & (USD/Sqm)
Figure 41. India Ceramic Substrate (Metallized) Market Share by Application in 2022 & 2029
Figure 42. India Ceramic Substrate (Metallized) Sales in Value by Application (2018-2029) & (US$ Million)
Figure 43. India Ceramic Substrate (Metallized) Sales Market Share in Value by Application (2018-2029)
Figure 44. India Ceramic Substrate (Metallized) Sales by Application (2018-2029) & (K Sqm)
Figure 45. India Ceramic Substrate (Metallized) Sales Market Share in Volume by Application (2018-2029)
Figure 46. India Ceramic Substrate (Metallized) Price by Application (2018-2029) & (USD/Sqm)
Figure 47. Americas Ceramic Substrate (Metallized) Sales in Volume Growth Rate 2018-2029 (K Sqm)
Figure 48. Americas Ceramic Substrate (Metallized) Sales in Value Growth Rate 2018-2029 (US$ Million)
Figure 49. Americas Ceramic Substrate (Metallized) Sales by Material (2018-2029) & (K Sqm)
Figure 50. Americas Ceramic Substrate (Metallized) Sales Market Share in Volume by Material (2018-2029)
Figure 51. Americas Ceramic Substrate (Metallized) Sales by Application (2018-2029) & (K Sqm)
Figure 52. Americas Ceramic Substrate (Metallized) Sales Market Share in Volume by Application (2018-2029)
Figure 53. United States Ceramic Substrate (Metallized) Sales in Value Growth Rate (2018-2029) & (US$ Million)
Figure 54. Canada Ceramic Substrate (Metallized) Sales in Value Growth Rate (2018-2029) & (US$ Million)
Figure 55. Mexico Ceramic Substrate (Metallized) Sales in Value Growth Rate (2018-2029) & (US$ Million)
Figure 56. Brazil Ceramic Substrate (Metallized) Sales in Value Growth Rate (2018-2029) & (US$ Million)
Figure 57. EMEA Ceramic Substrate (Metallized) Sales in Volume Growth Rate 2018-2029 (K Sqm)
Figure 58. EMEA Ceramic Substrate (Metallized) Sales in Value Growth Rate 2018-2029 (US$ Million)
Figure 59. EMEA Ceramic Substrate (Metallized) Sales by Material (2018-2029) & (K Sqm)
Figure 60. EMEA Ceramic Substrate (Metallized) Sales Market Share in Volume by Material (2018-2029)
Figure 61. EMEA Ceramic Substrate (Metallized) Sales by Application (2018-2029) & (K Sqm)
Figure 62. EMEA Ceramic Substrate (Metallized) Sales Market Share in Volume by Application (2018-2029)
Figure 63. Europe Ceramic Substrate (Metallized) Sales in Value Growth Rate (2018-2029) & (US$ Million)
Figure 64. Middle East Ceramic Substrate (Metallized) Sales in Value Growth Rate (2018-2029) & (US$ Million)
Figure 65. Africa Ceramic Substrate (Metallized) Sales in Value Growth Rate (2018-2029) & (US$ Million)
Figure 66. China Ceramic Substrate (Metallized) Sales in Volume Growth Rate 2018-2029 (K Sqm)
Figure 67. China Ceramic Substrate (Metallized) Sales in Value Growth Rate 2018-2029 (US$ Million)
Figure 68. China Ceramic Substrate (Metallized) Sales by Material (2018-2029) & (K Sqm)
Figure 69. China Ceramic Substrate (Metallized) Sales Market Share in Volume by Material (2018-2029)
Figure 70. China Ceramic Substrate (Metallized) Sales by Application (2018-2029) & (K Sqm)
Figure 71. China Ceramic Substrate (Metallized) Sales Market Share in Volume by Application (2018-2029)
Figure 72. APAC Ceramic Substrate (Metallized) Sales in Volume Growth Rate 2018-2029 (K Sqm)
Figure 73. APAC Ceramic Substrate (Metallized) Sales in Value Growth Rate 2018-2029 (US$ Million)
Figure 74. APAC Ceramic Substrate (Metallized) Sales by Material (2018-2029) & (K Sqm)
Figure 75. APAC Ceramic Substrate (Metallized) Sales Market Share in Volume by Material (2018-2029)
Figure 76. APAC Ceramic Substrate (Metallized) Sales by Application (2018-2029) & (K Sqm)
Figure 77. APAC Ceramic Substrate (Metallized) Sales Market Share in Volume by Application (2018-2029)
Figure 78. Japan Ceramic Substrate (Metallized) Sales in Value Growth Rate (2018-2029) & (US$ Million)
Figure 79. South Korea Ceramic Substrate (Metallized) Sales in Value Growth Rate (2018-2029) & (US$ Million)
Figure 80. China Taiwan Ceramic Substrate (Metallized) Sales in Value Growth Rate (2018-2029) & (US$ Million)
Figure 81. Southeast Asia Ceramic Substrate (Metallized) Sales in Value Growth Rate (2018-2029) & (US$ Million)
Figure 82. India Ceramic Substrate (Metallized) Sales in Value Growth Rate (2018-2029) & (US$ Million)
Figure 83. Ceramic Substrate (Metallized) Value Chain
Figure 84. Ceramic Substrate (Metallized) Production Process
Figure 85. Channels of Distribution
Figure 86. Distributors Profiles
Figure 87. Bottom-up and Top-down Approaches for This Report
Figure 88. Data Triangulation
Figure 89. Key Executives Interviewed